Download to read offline
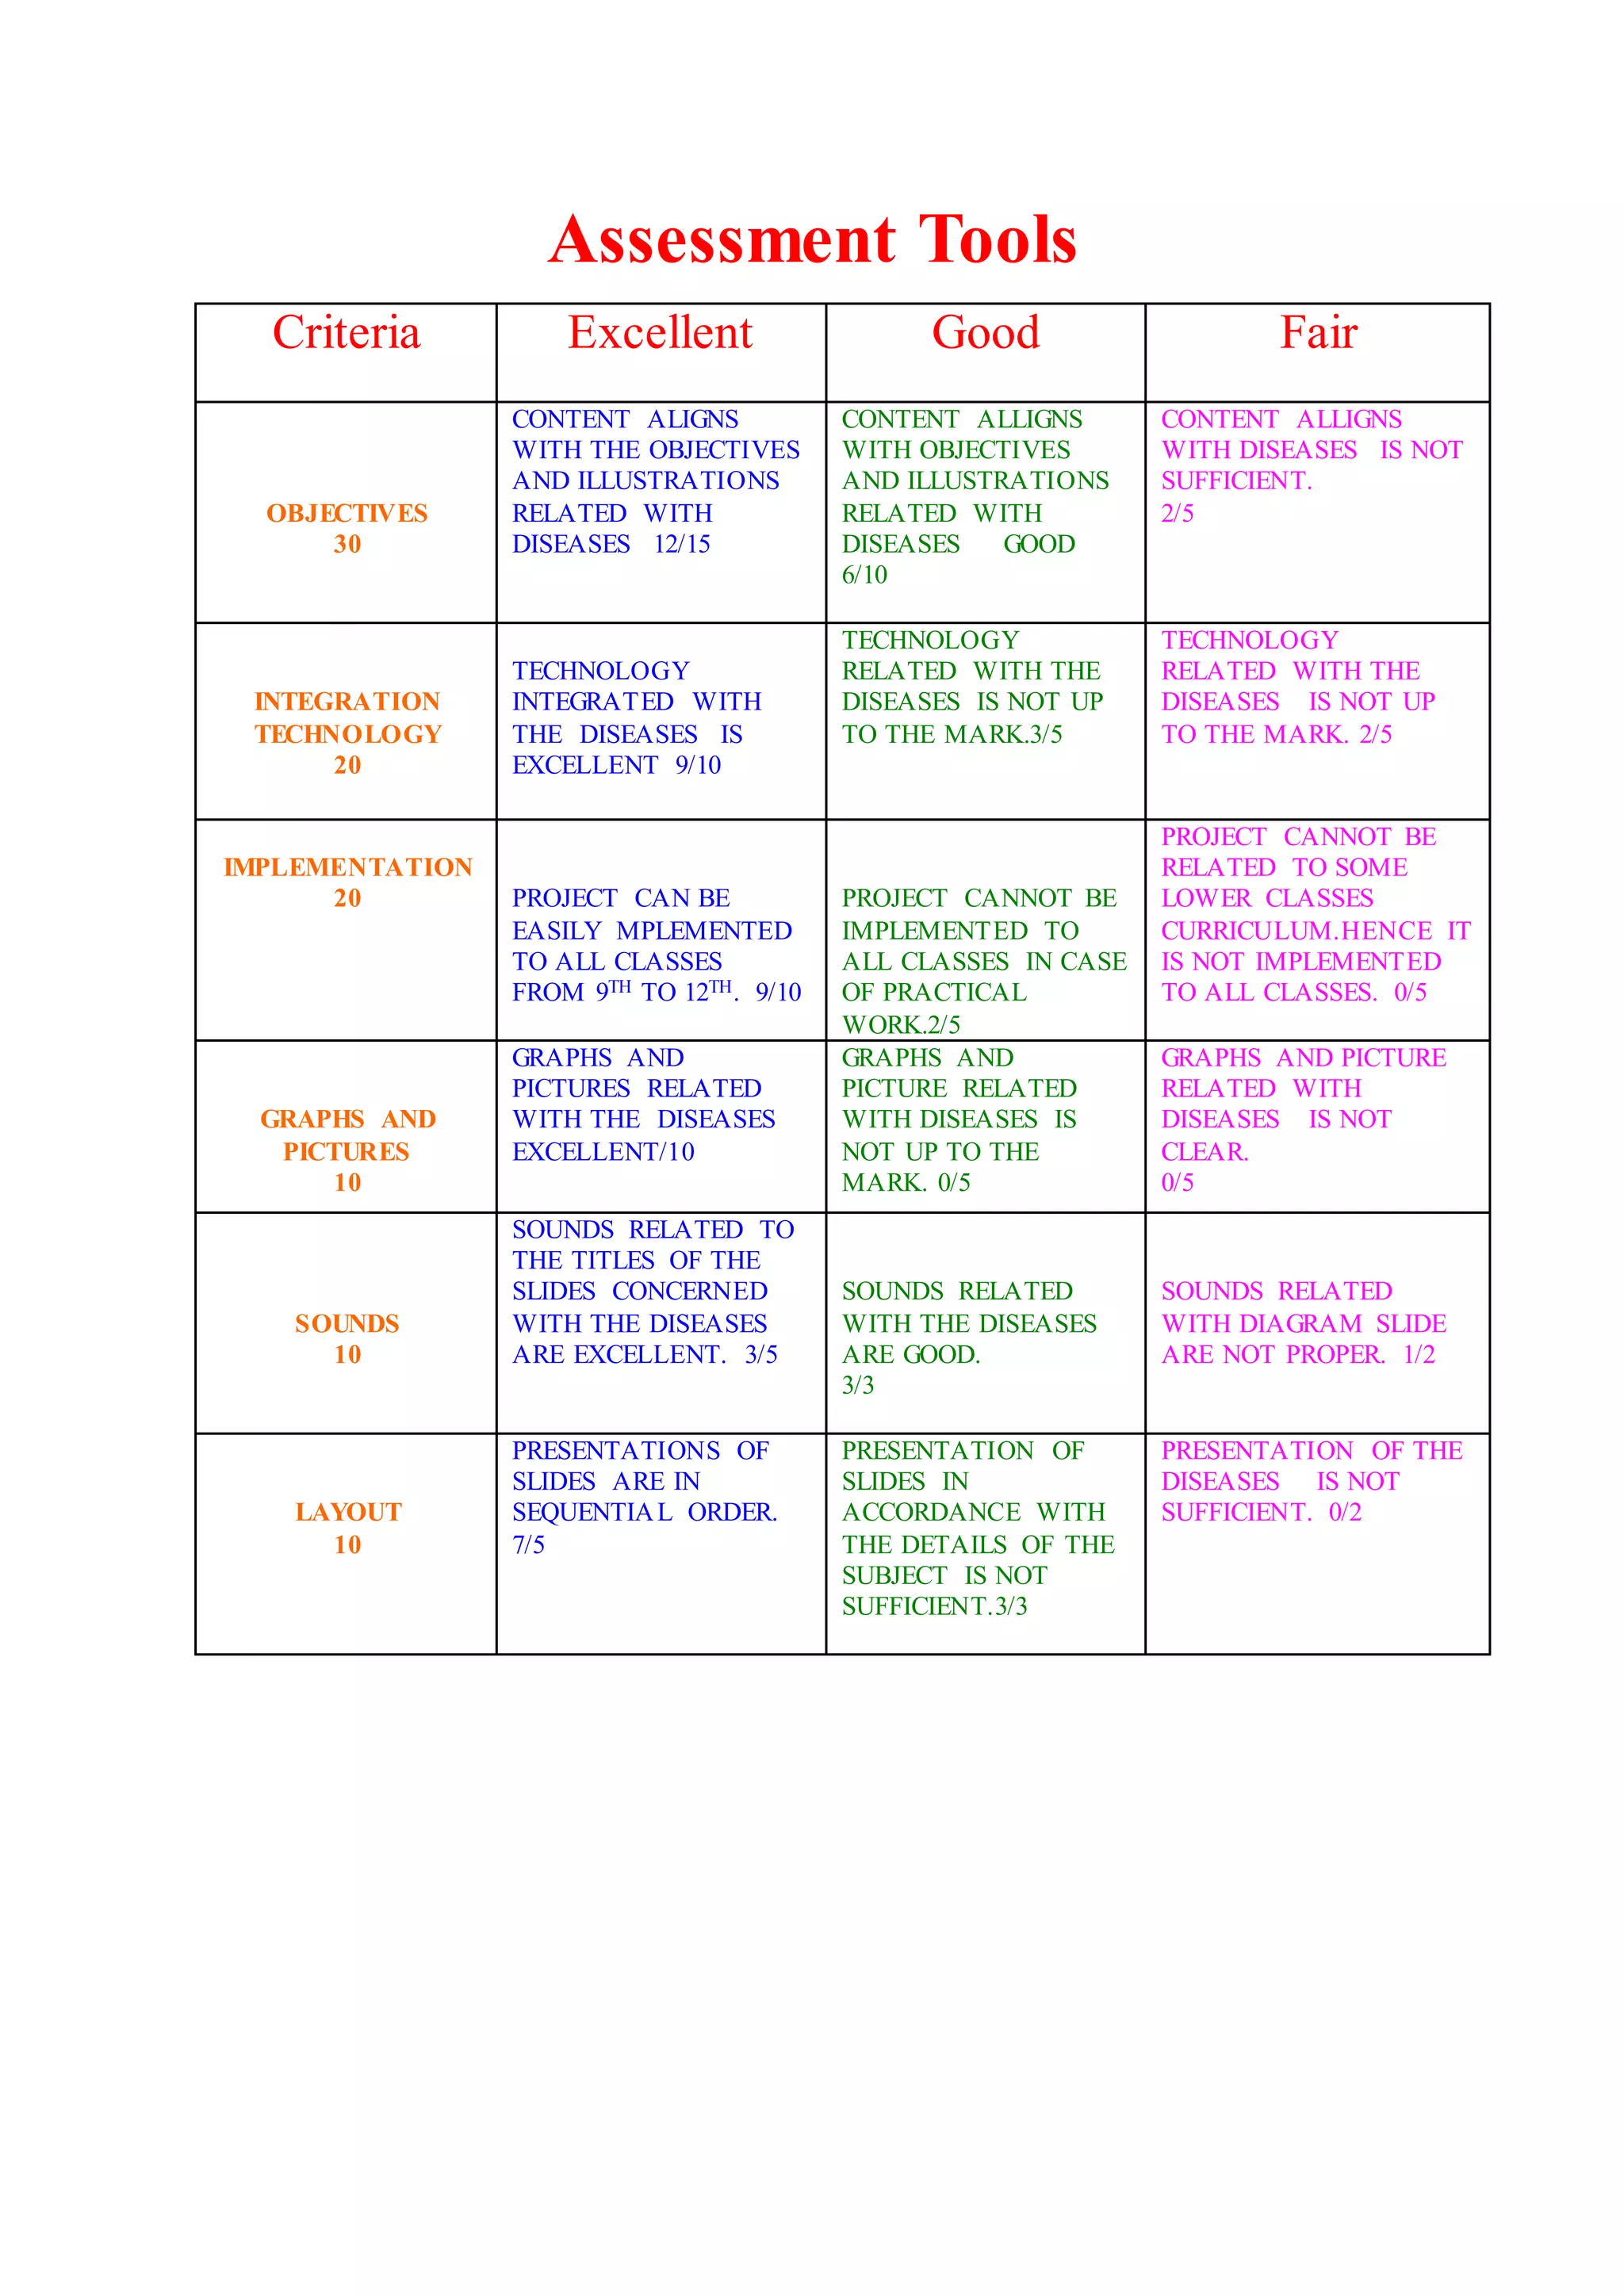


This document provides examples of various graphic organizers and assessment tools that can be used in the classroom. It describes how graphic organizers can help students organize and understand information by visually representing relationships between concepts. Different types of graphic organizers are suitable for different tasks, such as comparing ideas, showing processes, or outlining stories. The document also includes tools to help students reflect on their learning and for teachers to provide feedback and plan assessment practices.