Downloaded 32 times

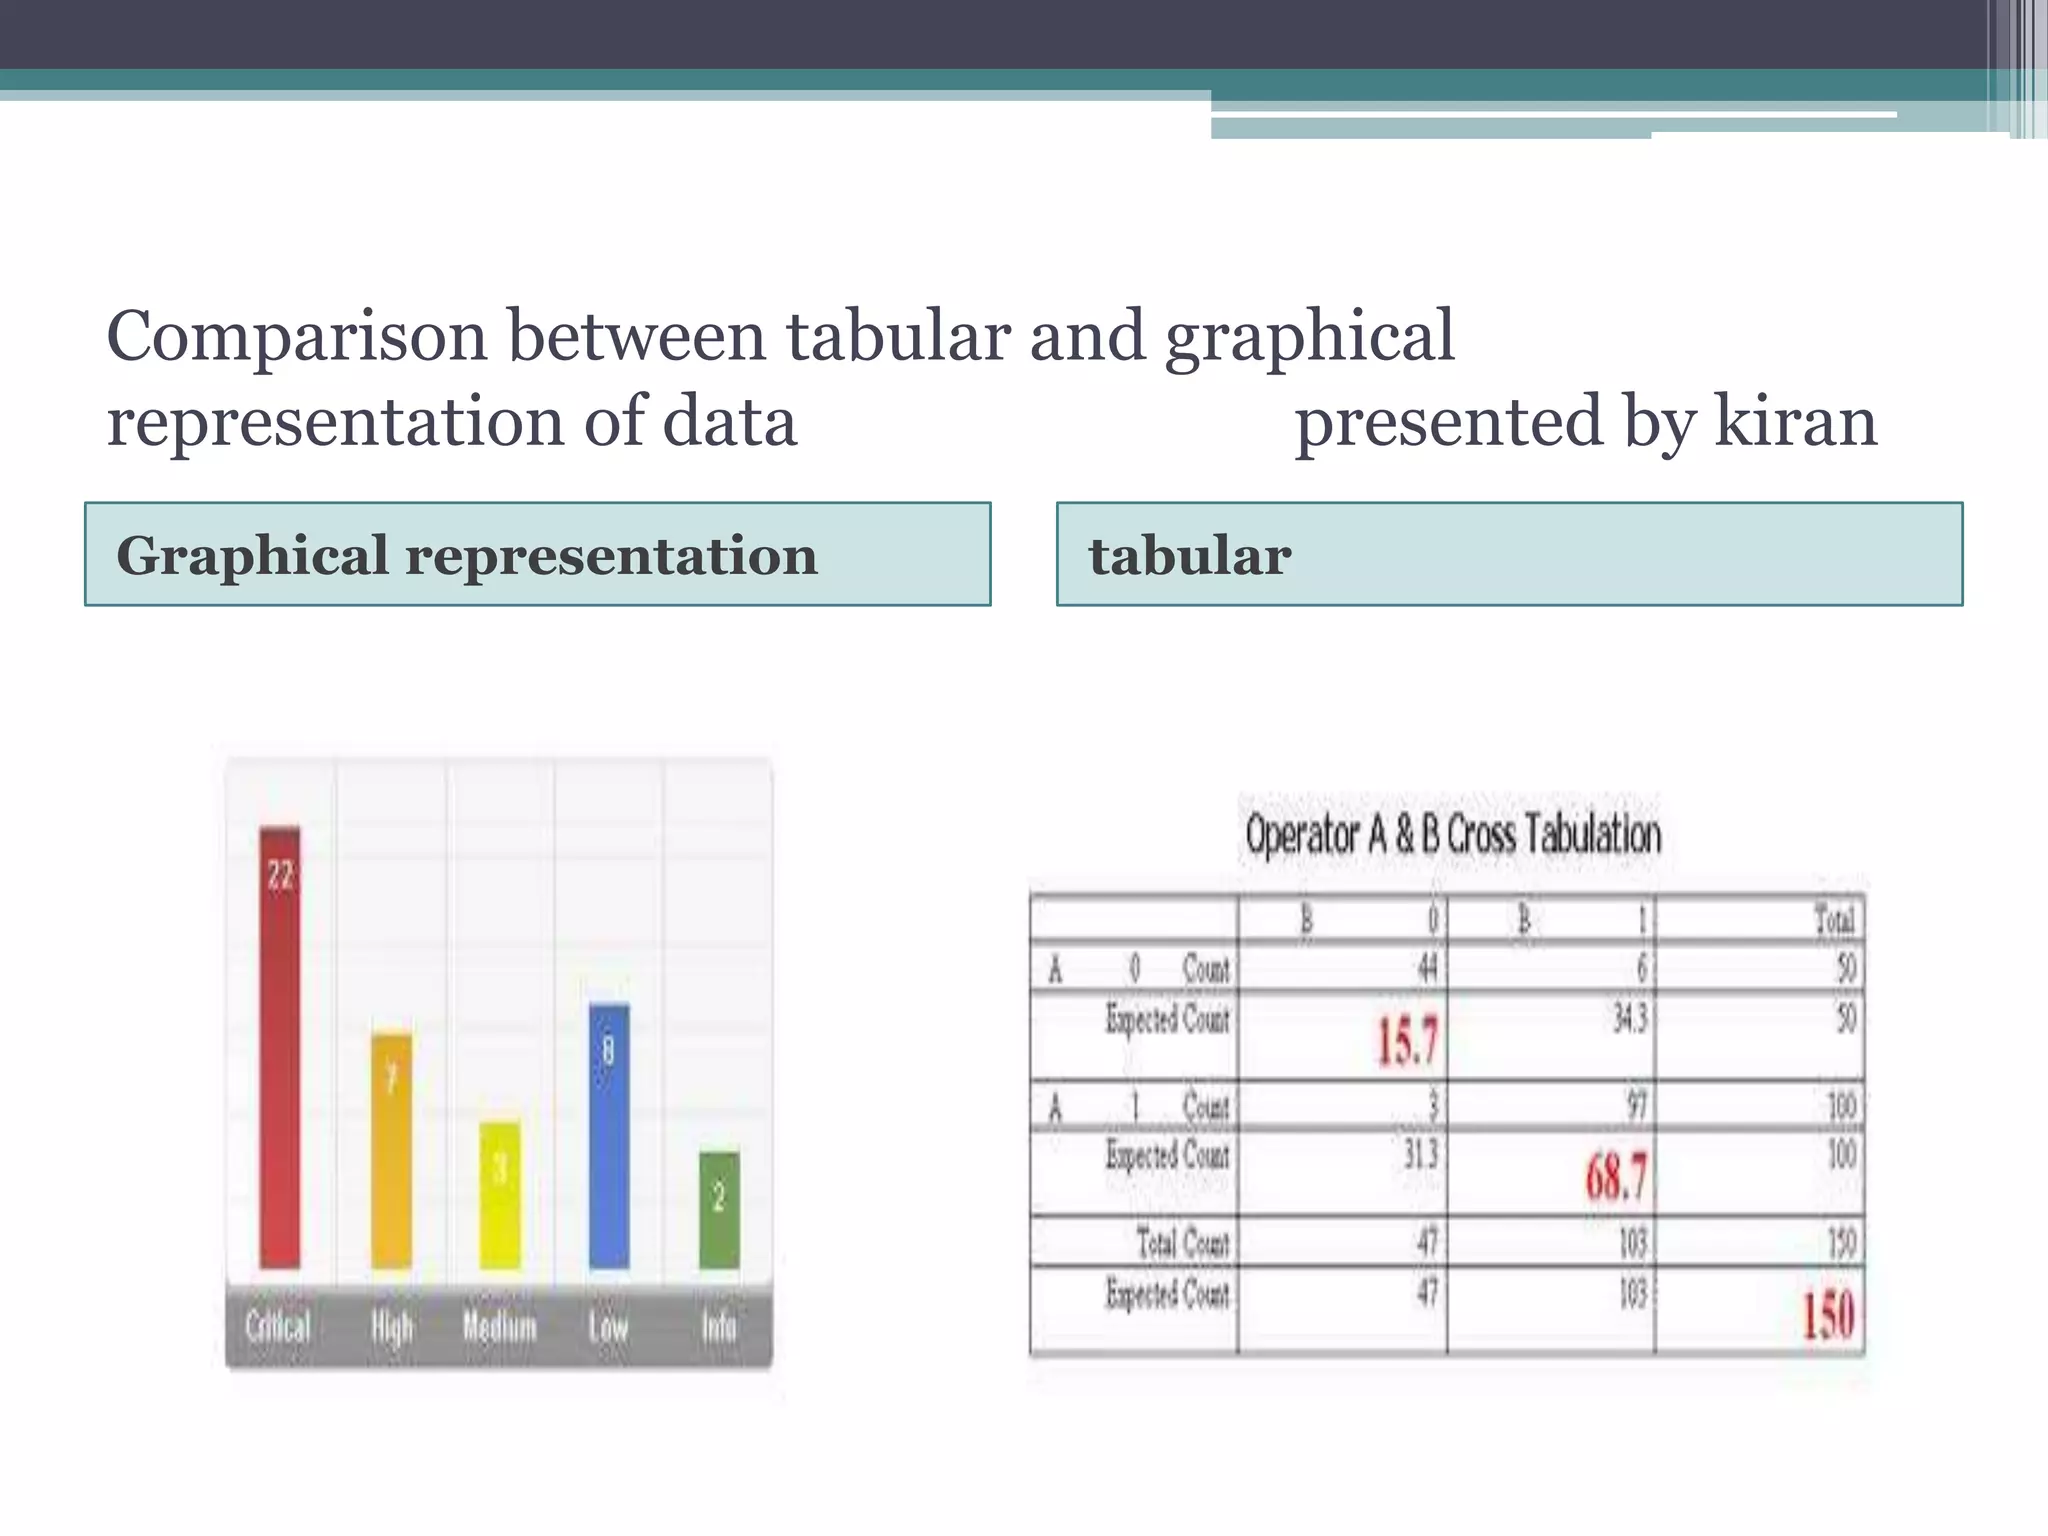
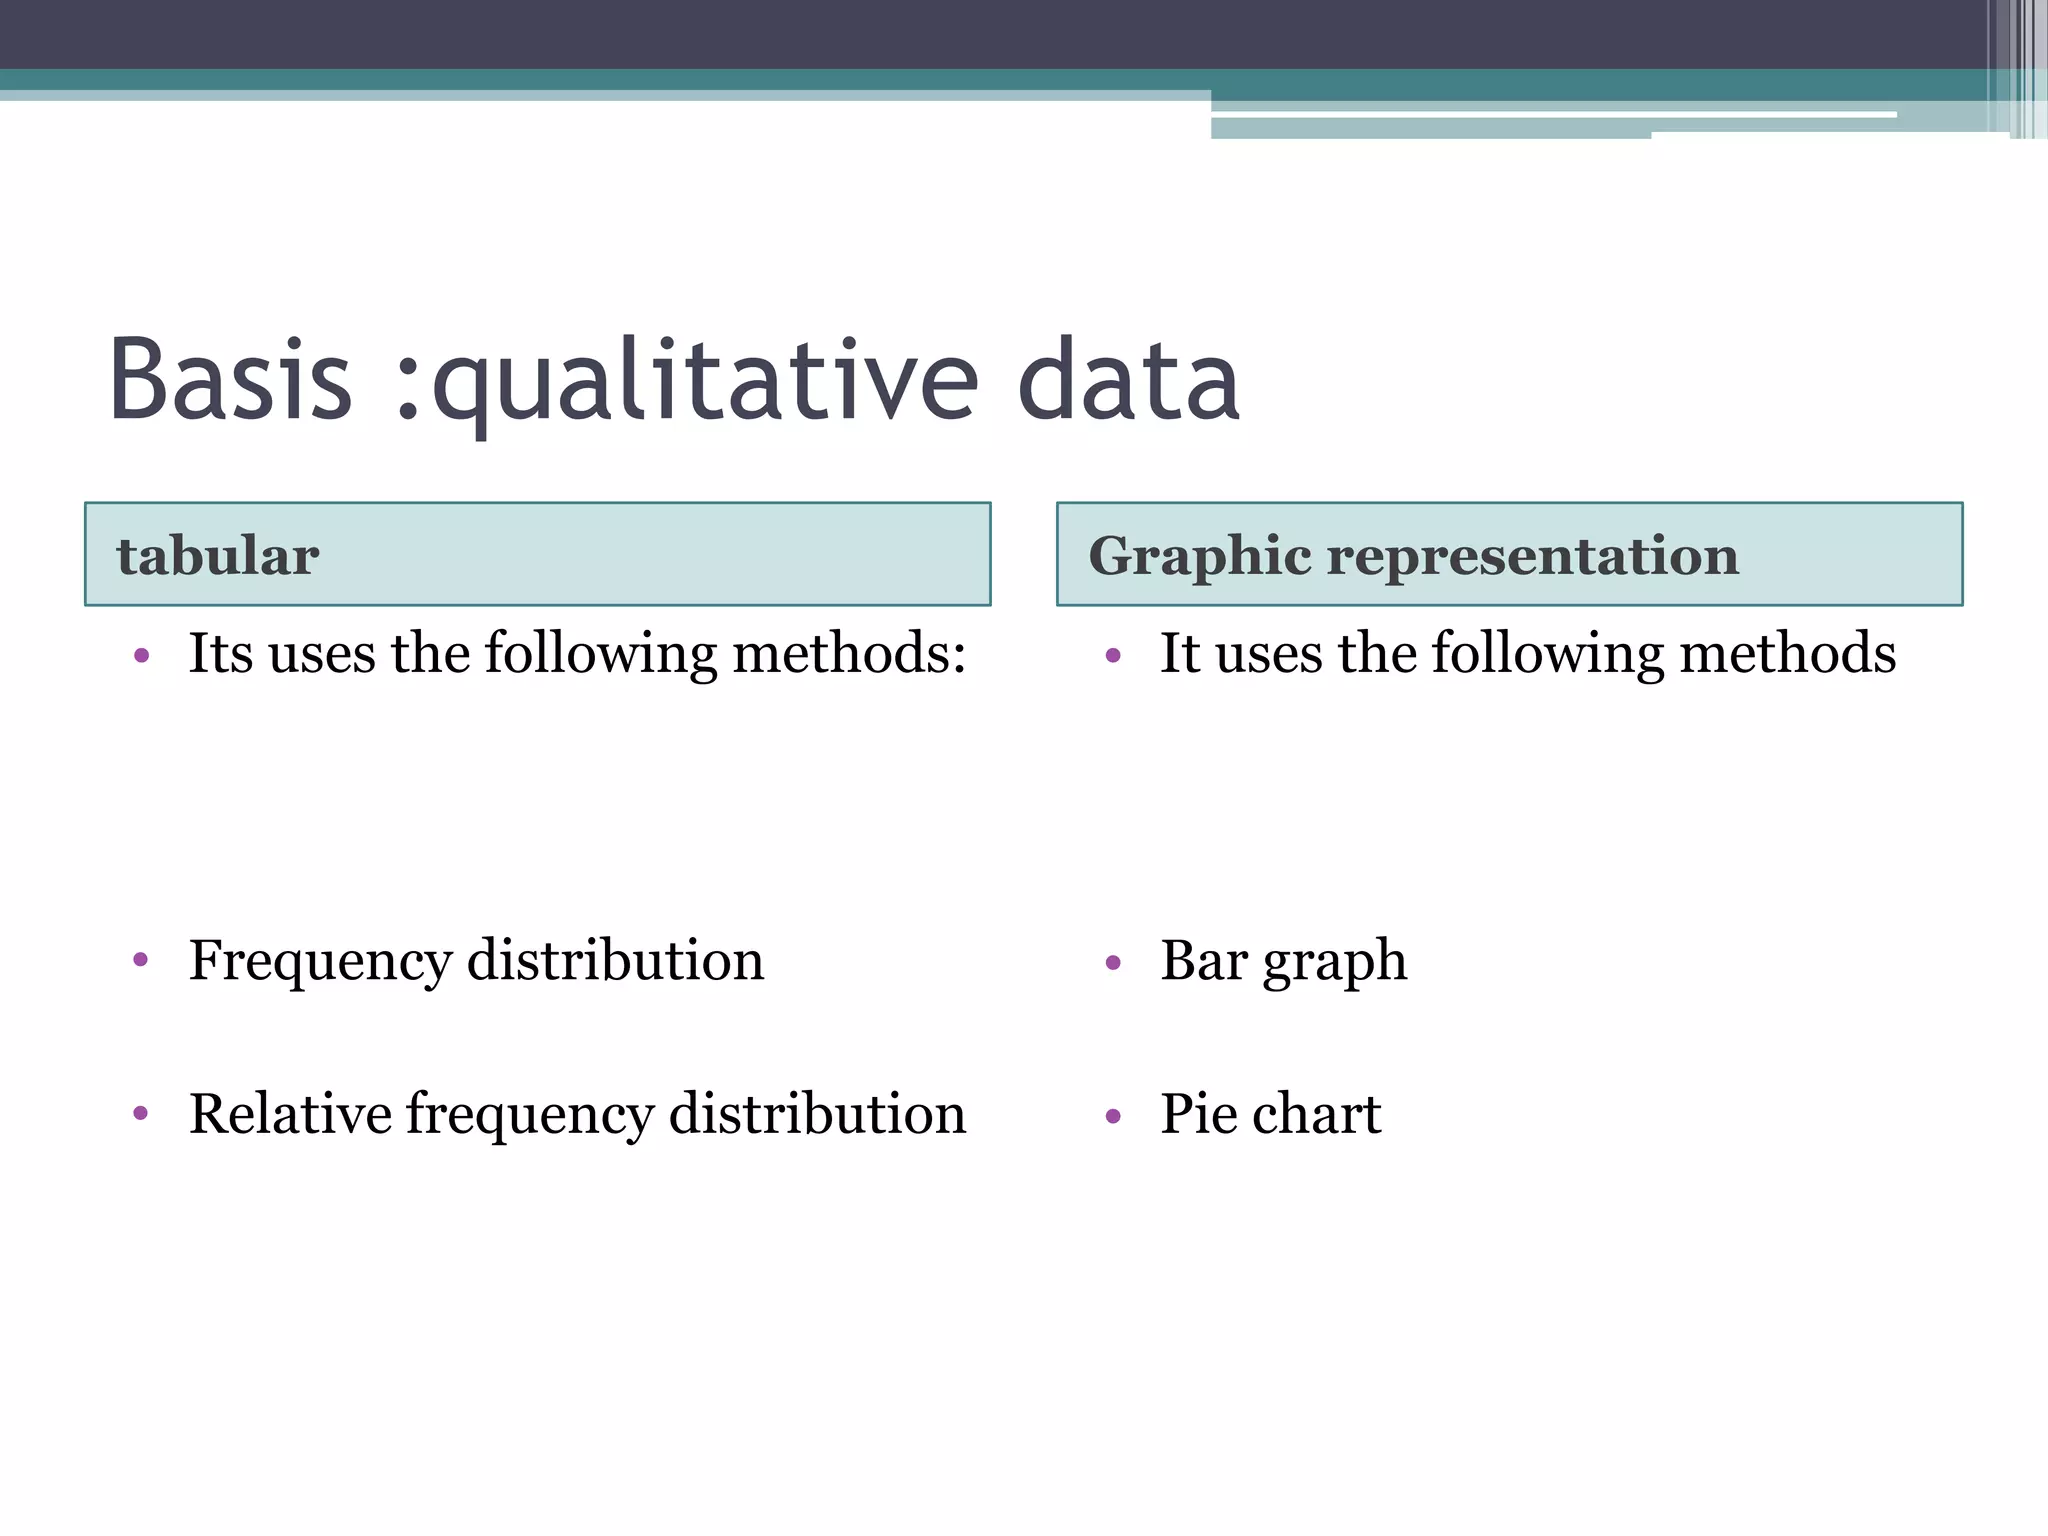
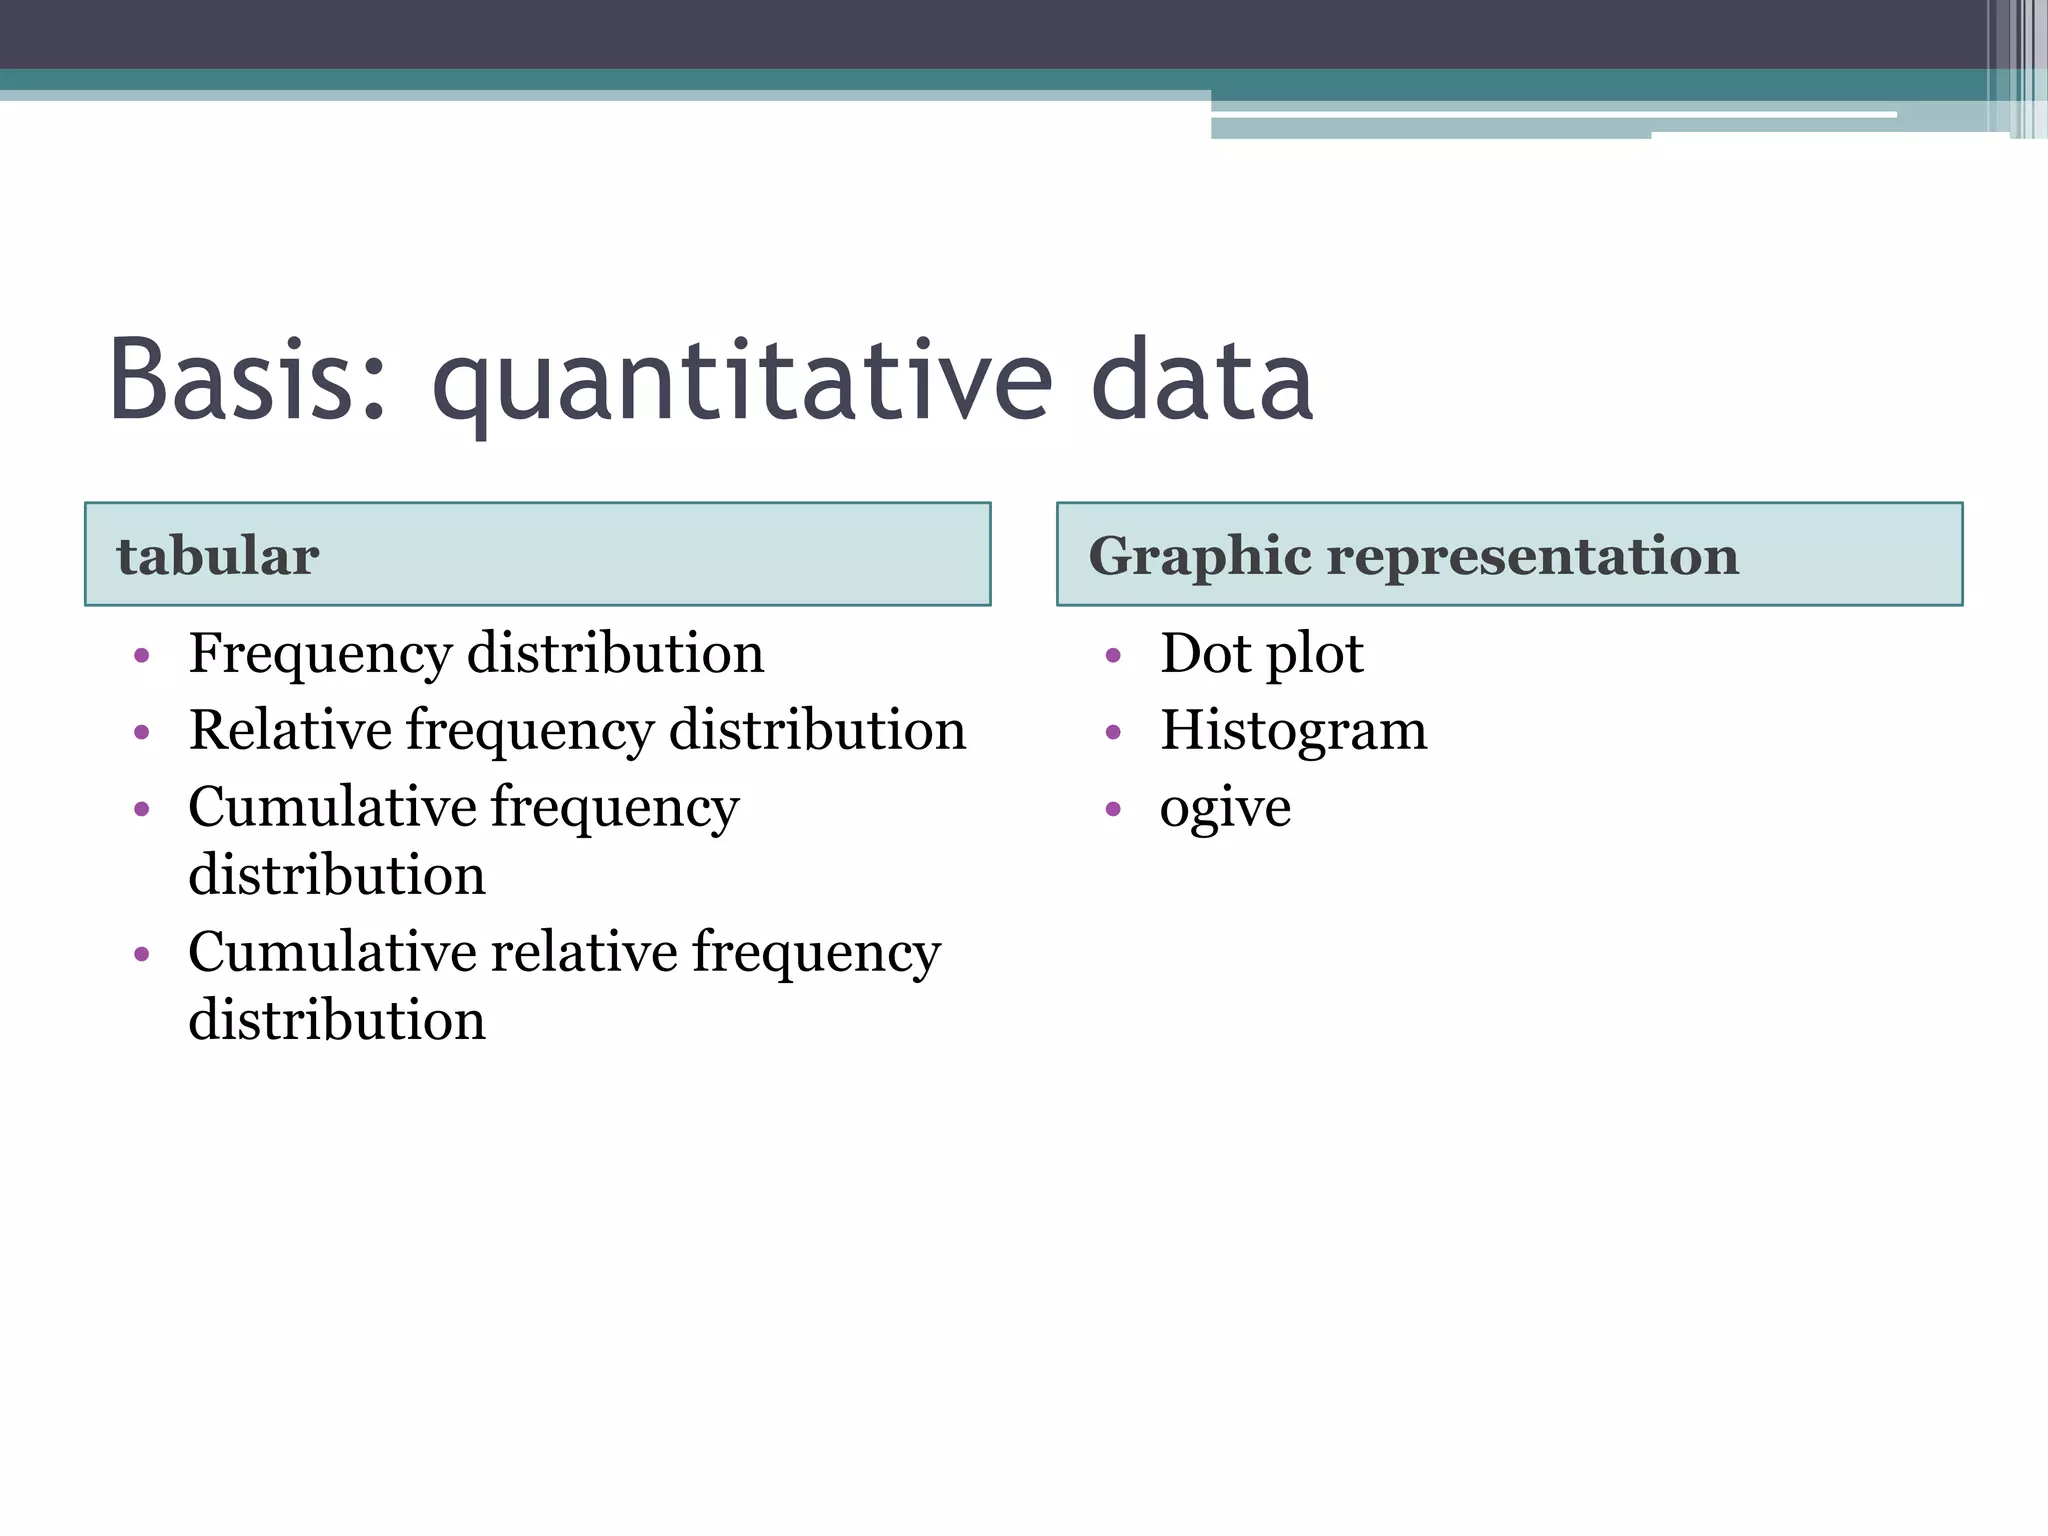
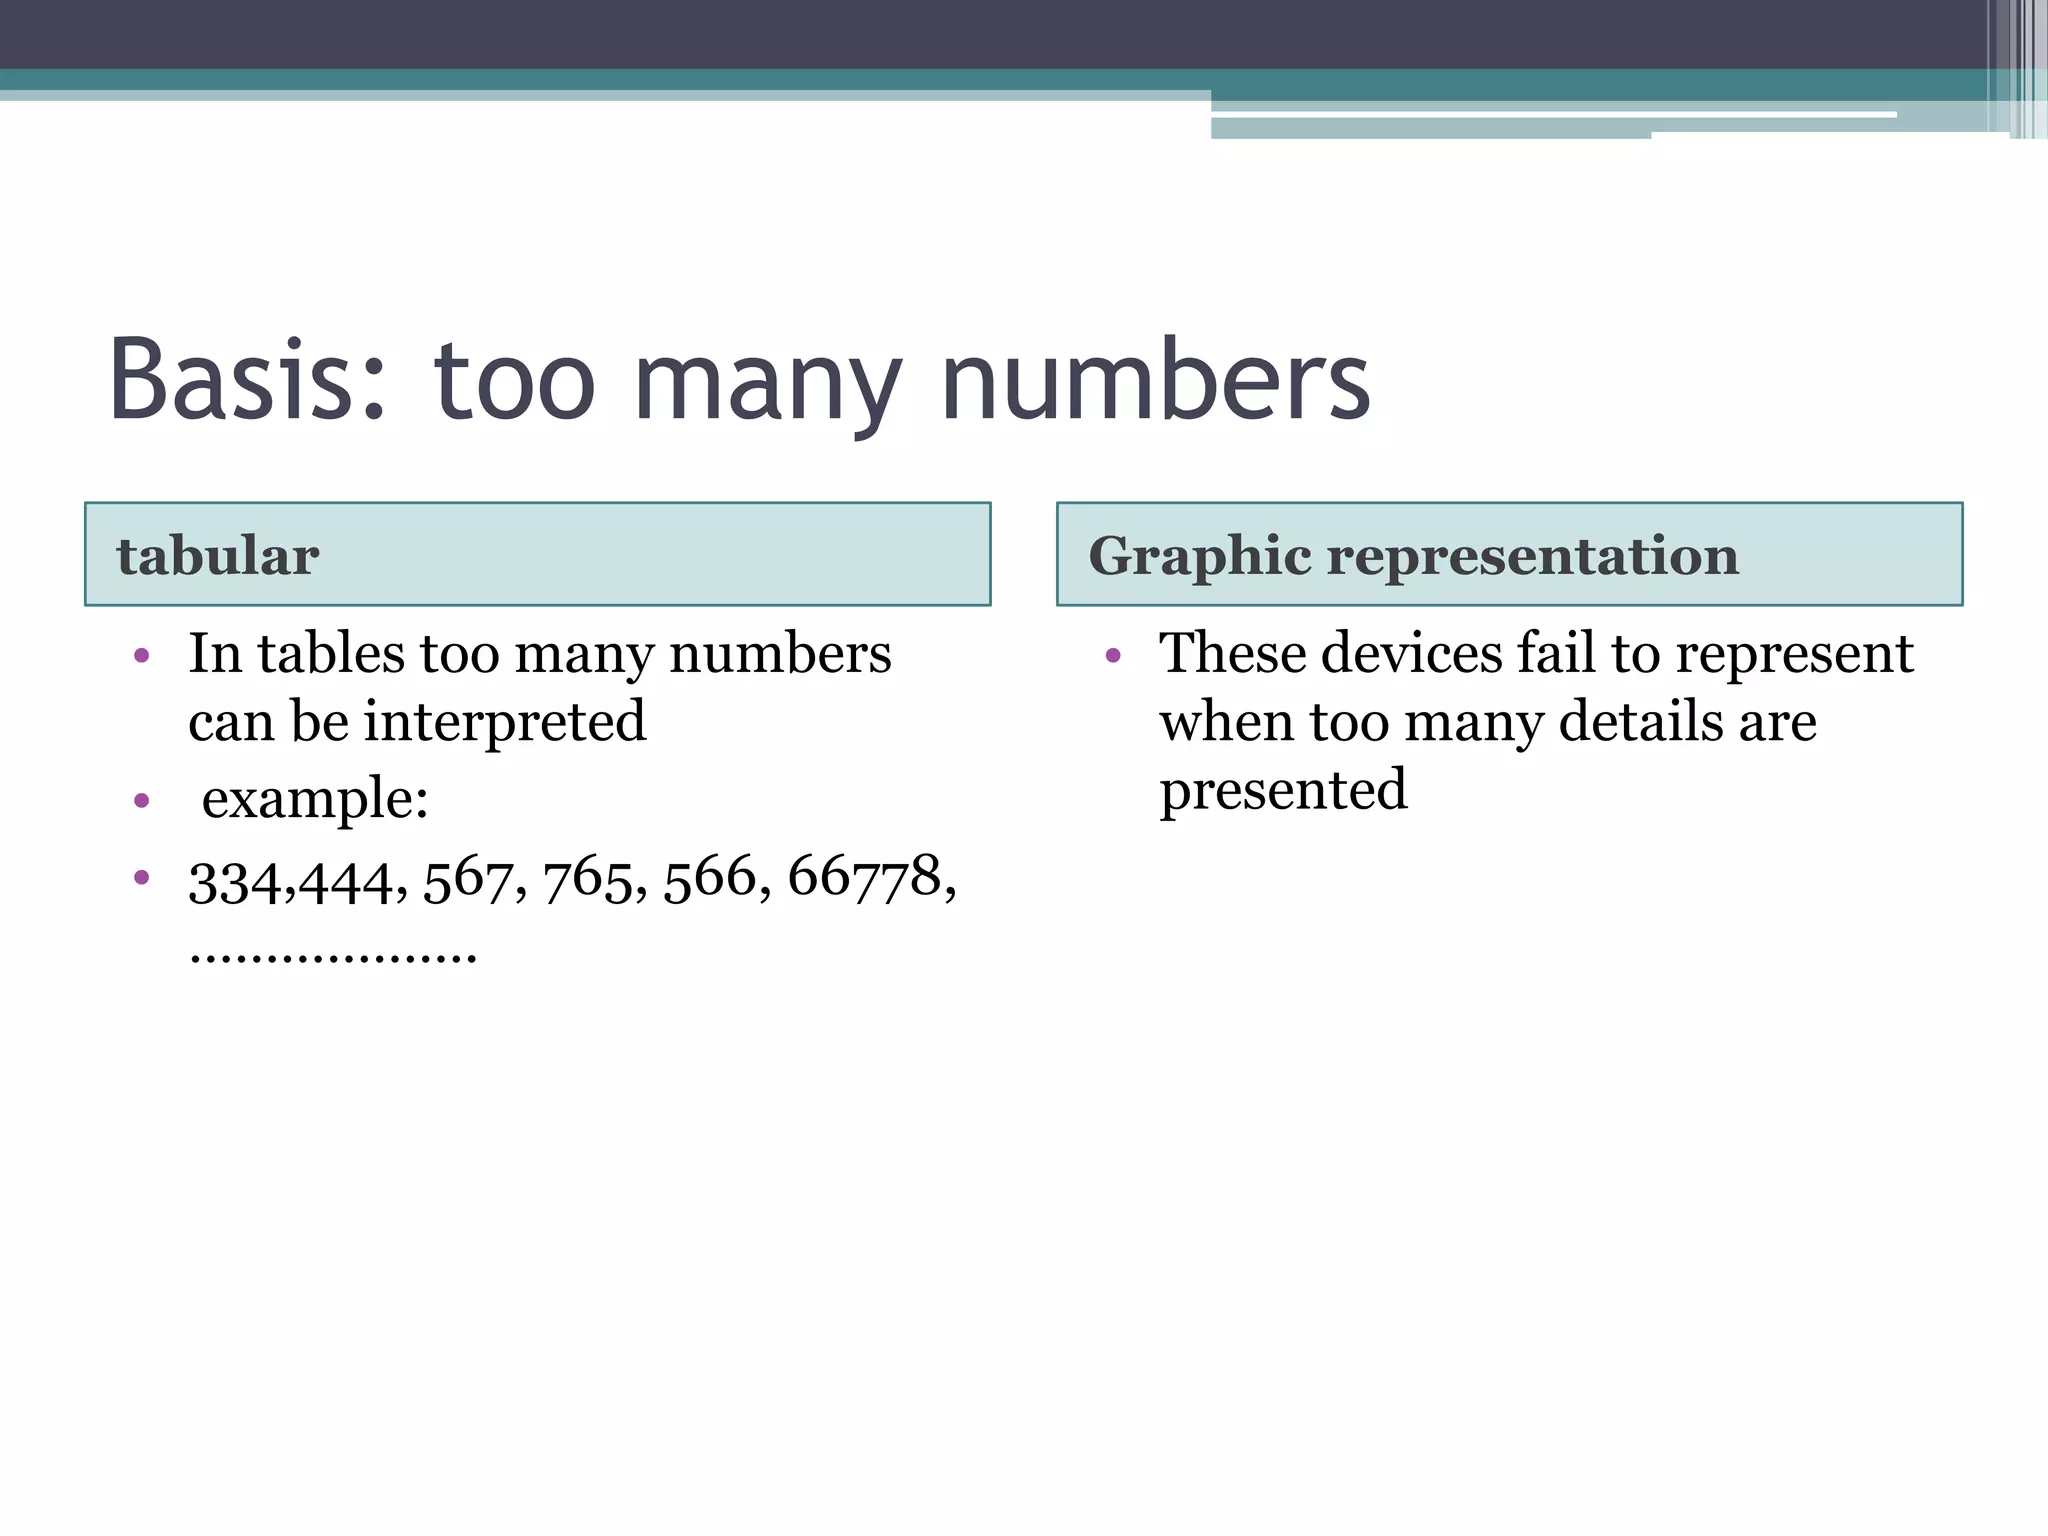
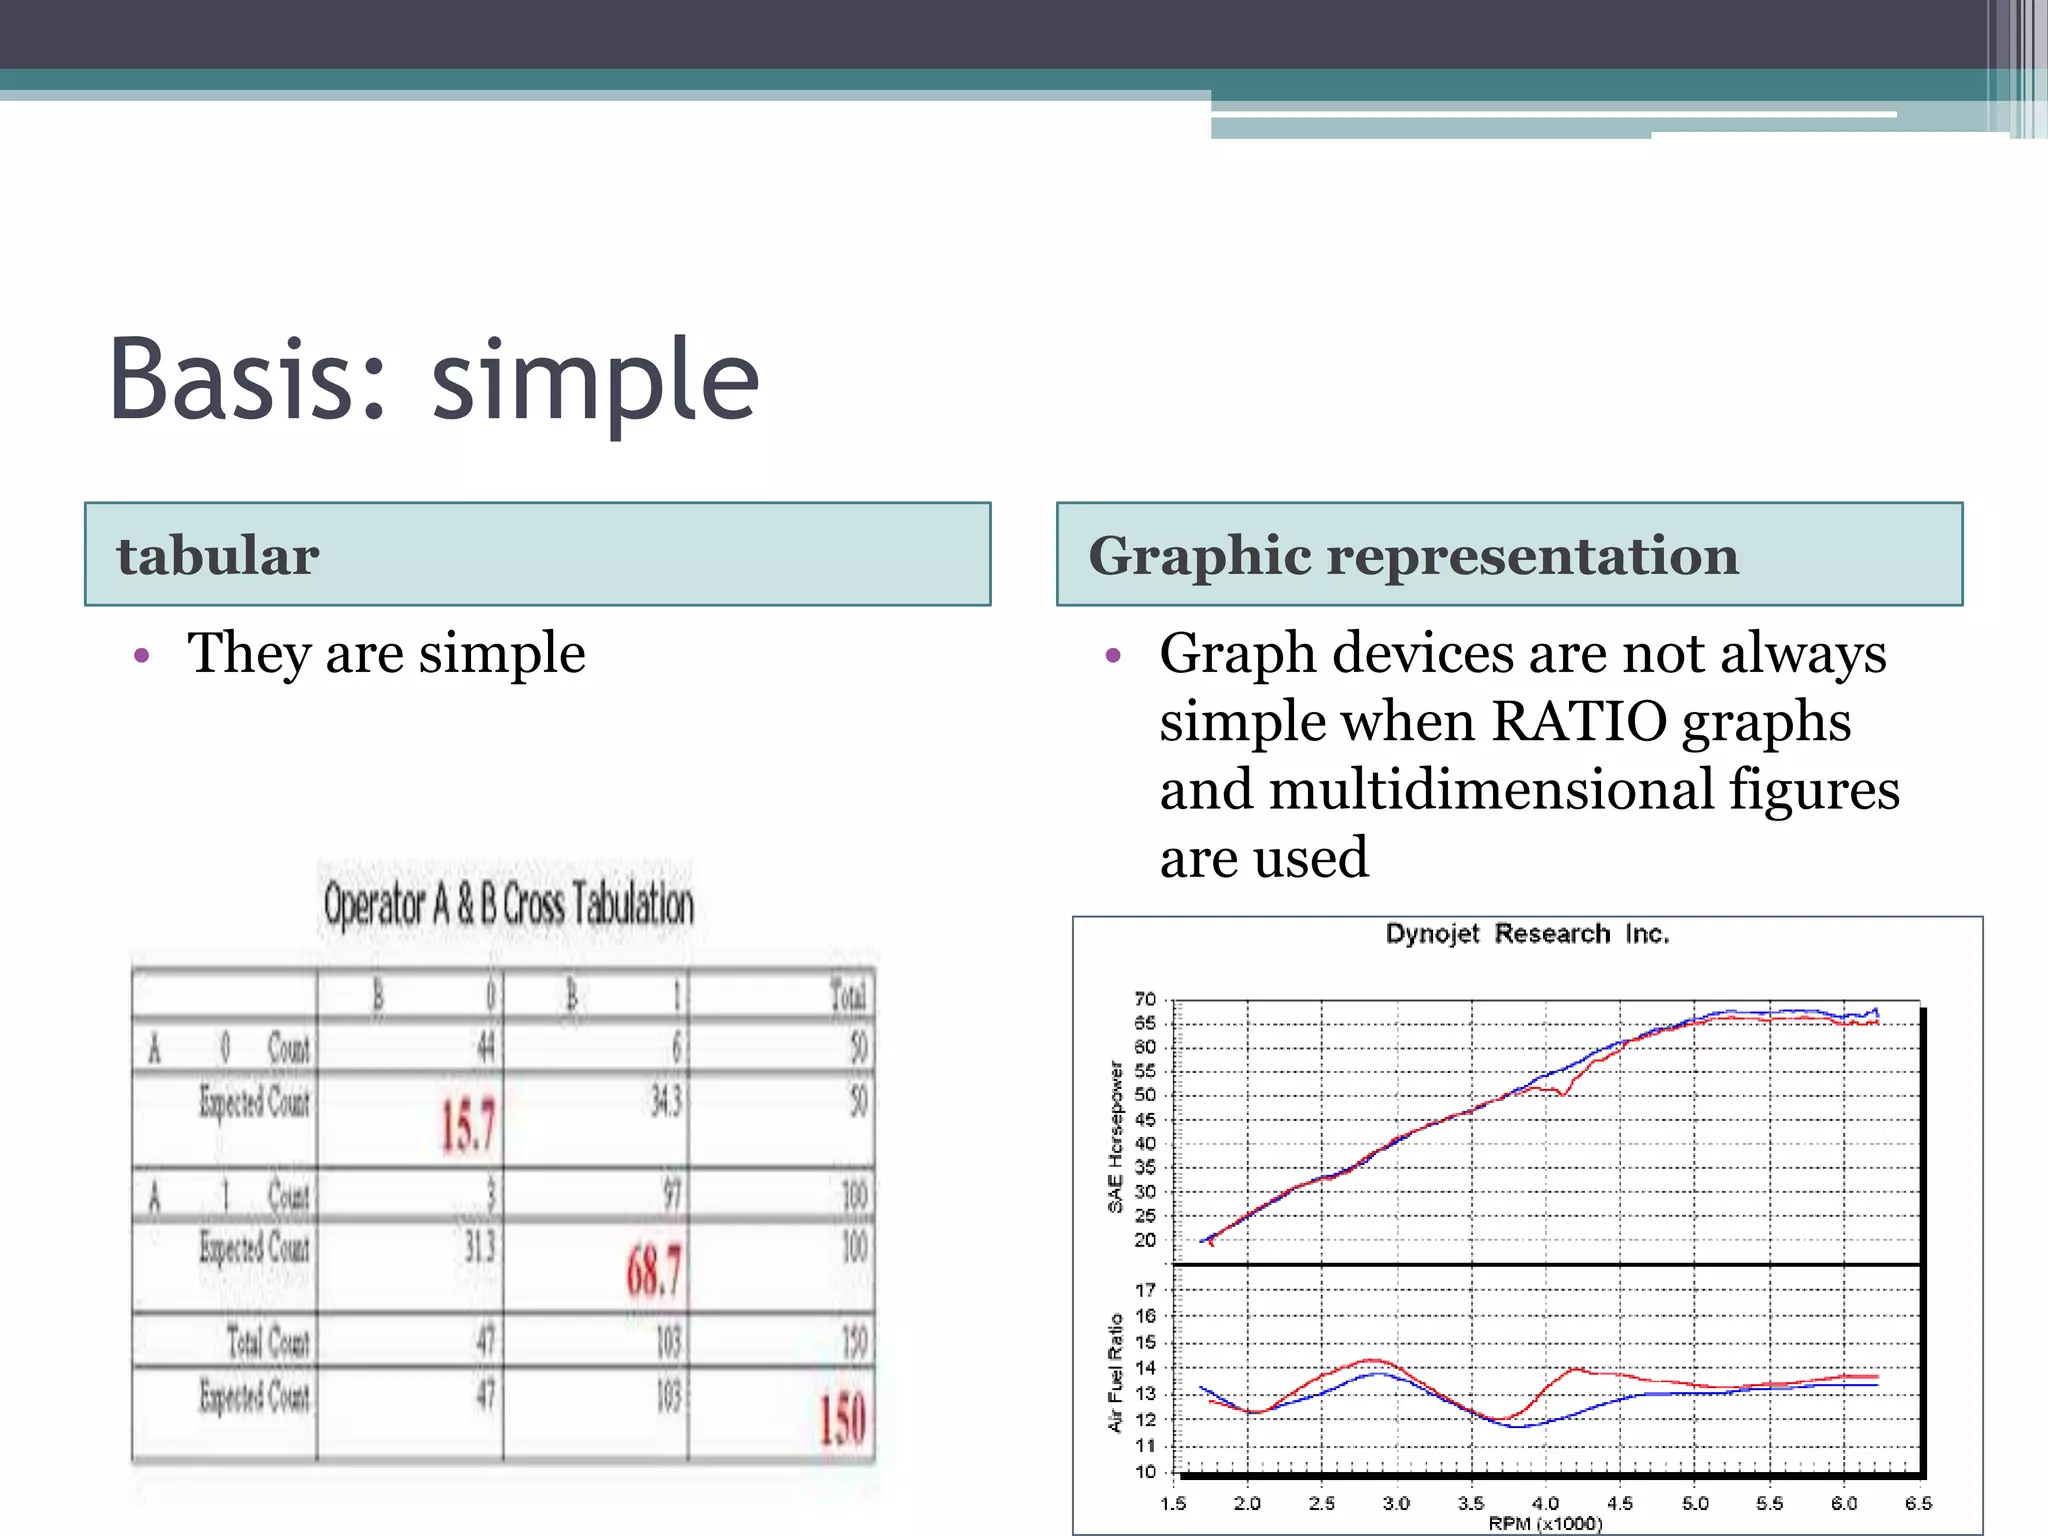


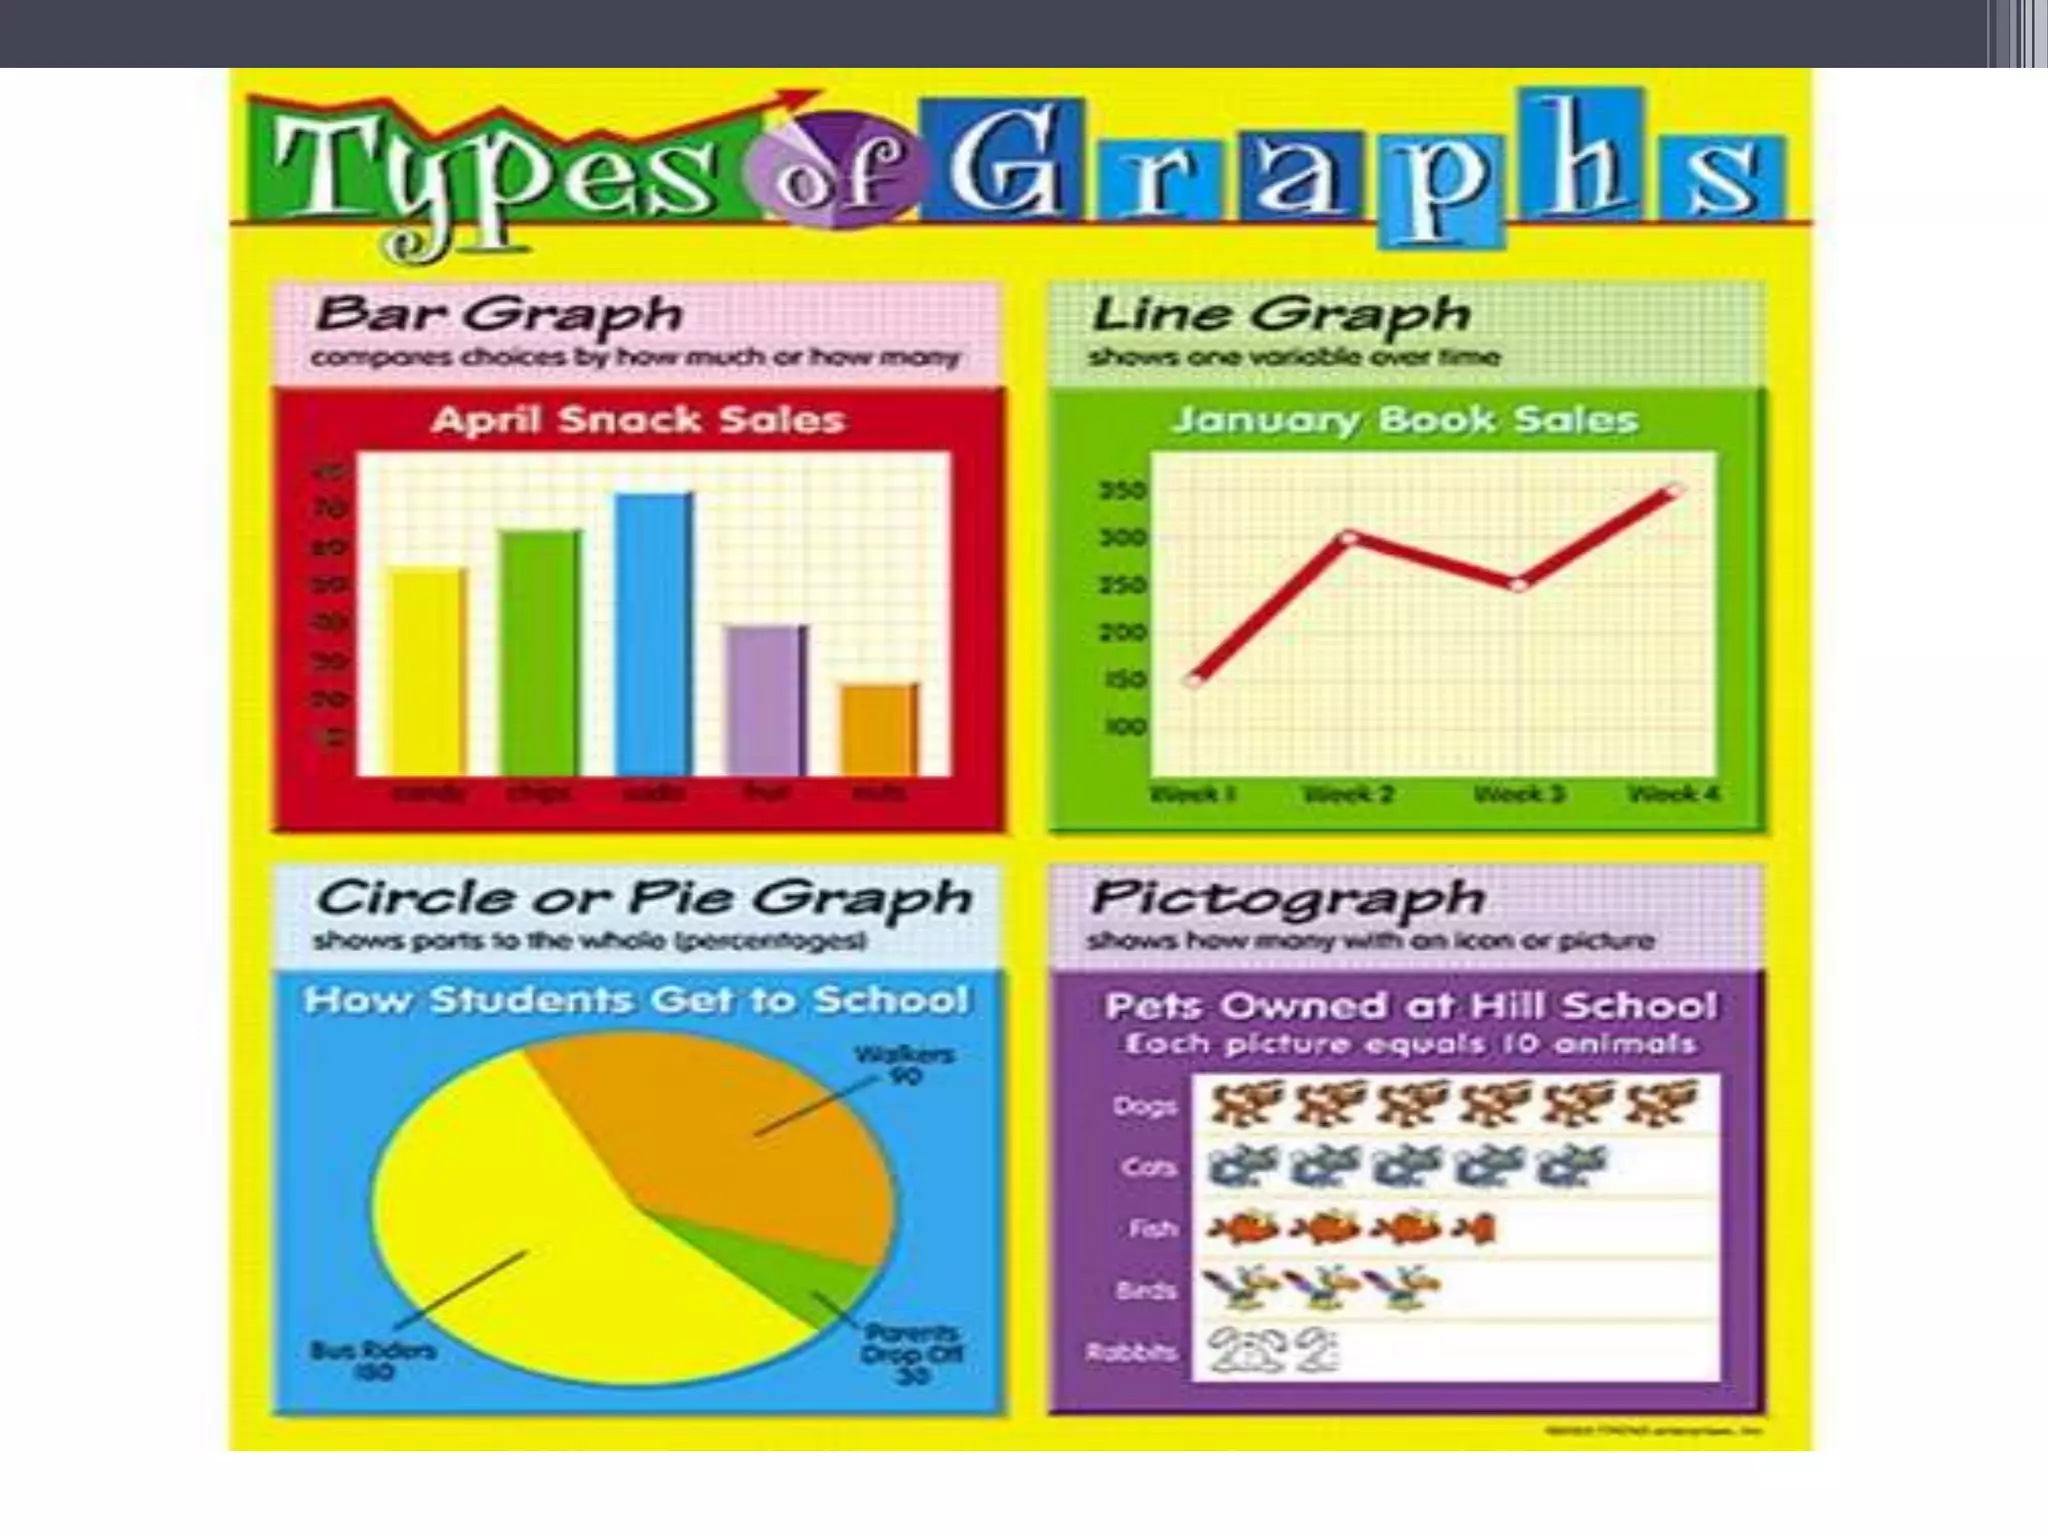


This document discusses various methods of graphically representing data, including: 1. It defines graphs and diagrams, and compares tabular and graphical representation. General rules for constructing graphs are also outlined. 2. One variable and two variable graphs are described. Specific types of graphs discussed include time series graphs, histograms, frequency polygons, cumulative frequency curves, range charts, and band diagrams. 3. Additional graph types analyzed are Pareto diagrams, fishbone diagrams, and box plots. Merits, limitations and uses of different graphs are mentioned.