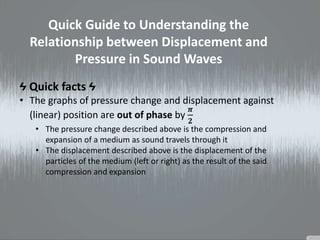
1. Quick Guide to Understanding the
Relationship between Displacement and
Pressure in Sound Waves
Ϟ Quick facts Ϟ
• The graphs of pressure change and displacement against
(linear) position are out of phase by
𝝅
𝟐
• The pressure change described above is the compression and
expansion of a medium as sound travels through it
• The displacement described above is the displacement of the
particles of the medium (left or right) as the result of the said
compression and expansion
2. … But wait, why?
Based on a quick guess, it would be superficially
logical that we would think the greatest change
in pressure would be the point with the greatest
displacement, because it would indicate the
greatest amount of movement—therefore
greatest change.
3. Not quite.
Consider the following series of annotated pictures:
High pressure : lots of particles
crammed into one spot
Low pressure: very few particles in the area
(relative to the high pressure area anyway)
Representation of the particles in a sound wave
Ϟ Recall Ϟ
Sound waves are longitudinal waves
Ϟ Molecules are displaced parallel to the
direction of the wave’s propagation
4. Particles here at HP
actually came from
A & B
… Which means that particle A’s displacement is +x and B’s displacement is -x at high
pressure (HP). And since HP is right in between the two directions of displacement, the
displacement at HP must equal ZERO. Let’s plot this specific position (the HP point) on
two separate graphs of arbitrary values. Let X1 be the HP point:
A B
5. … But what about low pressure? How
does displacement relate, then?
A B
The particles at A and B—which are right next to LP—are displacing in opposite
directions: -x for A (left) and +x (right) for B. Displacement at LP then, must be ZERO as
well. Let’s plot these on the previous graph and see what it looks like. Let X2 be LP:
Point of lowest pressure in the wave (LP)
6. Since both graphs are sinusoidal, it’s time to connect the
dots and really show how the graphs of displacement and
pressure change versus position are out of phase with each
other, like so:
Where displacement is 0, pressure change is at its maximum or minimum, much like two
cosine (or sine) graphs with a phase difference of
𝜋
2
.
7. … But perhaps you might be wondering, “How do you know which the
displacement graph is going? Why can’t it be the other way around?”
As in: Why instead of ?
This is because as you go from high pressure (x1) to low pressure (x2), the
particles in that section are displaced in the negative direction, not the positive
direction (recall that X1 is HP and X2 LP):
HP LP
This particle is (displaced) from this spot: since the particle moved left,
displacement is -x
8. Hope that clarifies the concept of how and why
the graphs of pressure change and displacement
are out of phase with each other!
Because I sure was confused at first.
HAPPY STUDYING!
Background courtesy of wallpaperswide.com
Sorry I’m not an artist and couldn’t have made this look
awesome, but I really tried. Here’s a really tiny potato: