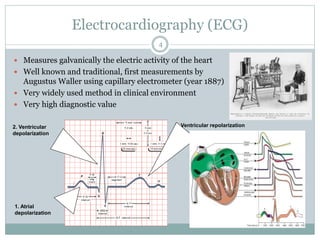
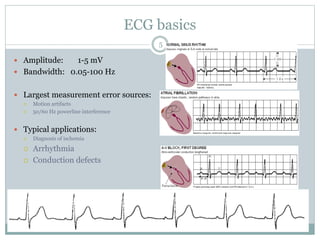
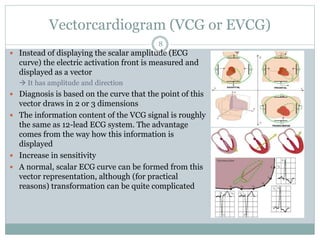
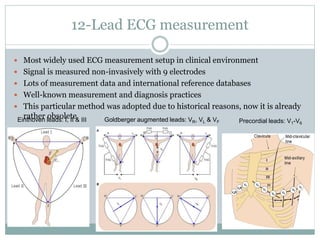
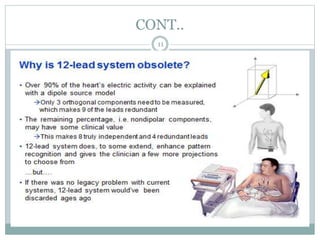
BIOMEDICAL RECORDERS
R.GOWRI
ASSISTANT PROFESSOR/ECE
KIT-KALAIGNAR KARUNANIDHI INSTITUTE OF TECHNOLOGY
1
What are biopotentials
Biopotential:
 An electric potential that is measured between points in living cells, tissues, and
organisms, and which accompanies all biochemical processes.
 Also describes the transfer of information between and within cells
 This book focuses strictly on the measurement of potentials
2
3
Electrocardiography (ECG)
 Measures galvanically the electric activity of the heart
 Well known and traditional, first measurements by
Augustus Waller using capillary electrometer (year 1887)
 Very widely used method in clinical environment
 Very high diagnostic value
1. Atrial
depolarization
2. Ventricular
depolarization
3. Ventricular repolarization
4
ECG basics
 Amplitude: 1-5 mV
 Bandwidth: 0.05-100 Hz
 Largest measurement error sources:
 Motion artifacts
 50/60 Hz powerline interference
 Typical applications:
 Diagnosis of ischemia
 Arrhythmia
 Conduction defects
5
ECG
6
 Electrical activity of heart.
 Used in catheterization laboratories, coronary care
units and routine diagnostic applications in
cardiology.
 LEAD – Two electrodes are placed over different
areas of the heart, the resulting tracing of voltage
difference at any sites due to electrical activity of
heart.
EFFECTS OF ARTIFACTS
7
 Interference from the power line
 Shifting of the baseline
 Muscle tremor
Vectorcardiogram (VCG or EVCG)
8
 Instead of displaying the scalar amplitude (ECG
curve) the electric activation front is measured and
displayed as a vector
 It has amplitude and direction
 Diagnosis is based on the curve that the point of this
vector draws in 2 or 3 dimensions
 The information content of the VCG signal is roughly
the same as 12-lead ECG system. The advantage
comes from the way how this information is
displayed
 Increase in sensitivity
 A normal, scalar ECG curve can be formed from this
vector representation, although (for practical
reasons) transformation can be quite complicated
9
 Display in 2 perpendicular axis
 Loop type pattern
 Provides direction of depolarization and
repolarization of atria and ventricle
 3 loops – P wave,QRS axis(high amp – predominate
and T wave.
 3 images – frontal,sagittal and transverse planes.
 Recognition of undetected atrial and ventricular
hypertrophy, myocardial infraction.
CONT…
12-Lead ECG measurement
 Most widely used ECG measurement setup in clinical environment
 Signal is measured non-invasively with 9 electrodes
 Lots of measurement data and international reference databases
 Well-known measurement and diagnosis practices
 This particular method was adopted due to historical reasons, now it is already
rather obsoleteEinthoven leads: I, II & III Goldberger augmented leads: VR, VL & VF Precordial leads: V1-V6
CONT..
11
PCG
12
 Graphic record heart sound - Phonogram.
 Recording the sounds connected with the pumping
action of heart.
 Sound from heart – phonocardiogram
 Instrument to measure this – phonocardiograph
 Basic function – to pick up the different heart
sound,filter the required and display.
 Two categories –
 heart sound – transient characteristics with short
duration.(closing and opening of valves)
 murmurs – noisy characteristics with long
duration.(turbulent blood flow in heart)
Origin of sound
13
 Valve closure
 Movement of heart wall
 Valve opening
 Extra cardiac sounds
1. Frequency – 10 to 1000 Hz.
LOW RANGE – 10 – 60 Hz(3rd and 4th)
MEDIUM RANGE – 60 – 150 Hz(1st and 2nd)
HIGH RANGE – 150 – 1000 Hz
2.Amplitude
3.Quality
Origin of sound
14
 1st sound:
Closure of mitral and tricuspid valves.
Freq – 30 to 100 Hz and duration 50 to 100 ms
 2nd sound:
Closure of aortic and pulmonary valves(slight back
flow of blood).
Freq – 30 to 100 Hz and duration 25 to 50 ms .
 3rd and 4th low intensity and inaudible.(heard among
children).
Origin of sound
15
 3rd sound:
Blood rapid movement into relaxed ventricular
chambers
Freq – 10 to 100 Hz and duration 0.04 to 0.08 s.
 4th sound:
atrial contraction.
Freq – 10 to 50 Hz and duration 0.03 to 0.06 s.
CONT..
16
 Microphones for PCG:
Crystal microphone – contains wafer of piezo-
electric material, which generates potentials when
subjected to mechanical stresses due to heart sound.
Smaller in size, high sensitivity.
Dynamic microphone – consists of a moving coil
having a fixed magnetic core inside it. The coil moves
with the heart sound and produce a voltage because
of interaction with the magnetic flux.
New acoustic sensors – polymer based adherent
differential-output sensors.
Writing methods
17
 Light beam galvanometer – expensive and require
more power from amplifiers when used for high freq.
 Direct writing recorders – upper freq 150 Hz.(used
for only low freq).
 Technique – envelope detection.
Fans, Air conditioners and other noise producing
gadgets will result in artefacts on the recordings.
Heart Sounds
 S1 – onset of the ventricular contraction
 S2 – closure of the semilunar valves
 S3 – ventricular gallop
 S4 – atrial gallop
 Other – opening snap, ejection sound
 Murmurs
18
RECORDING SET - UP
19
CONDENSE
R
MICROPHO
NE
ECG AMP
ECG
ELECTRODE
FILTER
PHONO
AMPLIFIER
FM TAPE
RECORDER
MONITOR
SCOPE
MEDICAL APPLICATION
20
 Rheumatic valvular lesions
Allergic disease in which the heart valves are likely to be damaged. This creates
abnormal heart sound.
 The murmurs of aortic steonosis
The blood is ejected from the left ventricles through a small opening of aortic
valve. High pressure 350 mm of Hg and causes turbulent flow of blood.
 The murmurs of aortic regurgitation
During diastole, blood flow backward from aorta to left ventricles,causing a
blowing murmur.
 The murmurs of mitral regurgitation
During systole, blood flow backward through mitral valve.
 The murmurs of mitral steonosis
It produce murmurs when,Blood passes with difficulty from LA into the LV
due to pressure difference.
SPECIAL APPLICATION OF PCG
21
 Fetal PCG
 Esophageal PCG
 Tracheal PCG - Cannula
22
THANK YOU

BIO MEDICAL RECORDERS

  • 1.
  • 2.
    What are biopotentials Biopotential: An electric potential that is measured between points in living cells, tissues, and organisms, and which accompanies all biochemical processes.  Also describes the transfer of information between and within cells  This book focuses strictly on the measurement of potentials 2
  • 3.
  • 4.
    Electrocardiography (ECG)  Measuresgalvanically the electric activity of the heart  Well known and traditional, first measurements by Augustus Waller using capillary electrometer (year 1887)  Very widely used method in clinical environment  Very high diagnostic value 1. Atrial depolarization 2. Ventricular depolarization 3. Ventricular repolarization 4
  • 5.
    ECG basics  Amplitude:1-5 mV  Bandwidth: 0.05-100 Hz  Largest measurement error sources:  Motion artifacts  50/60 Hz powerline interference  Typical applications:  Diagnosis of ischemia  Arrhythmia  Conduction defects 5
  • 6.
    ECG 6  Electrical activityof heart.  Used in catheterization laboratories, coronary care units and routine diagnostic applications in cardiology.  LEAD – Two electrodes are placed over different areas of the heart, the resulting tracing of voltage difference at any sites due to electrical activity of heart.
  • 7.
    EFFECTS OF ARTIFACTS 7 Interference from the power line  Shifting of the baseline  Muscle tremor
  • 8.
    Vectorcardiogram (VCG orEVCG) 8  Instead of displaying the scalar amplitude (ECG curve) the electric activation front is measured and displayed as a vector  It has amplitude and direction  Diagnosis is based on the curve that the point of this vector draws in 2 or 3 dimensions  The information content of the VCG signal is roughly the same as 12-lead ECG system. The advantage comes from the way how this information is displayed  Increase in sensitivity  A normal, scalar ECG curve can be formed from this vector representation, although (for practical reasons) transformation can be quite complicated
  • 9.
    9  Display in2 perpendicular axis  Loop type pattern  Provides direction of depolarization and repolarization of atria and ventricle  3 loops – P wave,QRS axis(high amp – predominate and T wave.  3 images – frontal,sagittal and transverse planes.  Recognition of undetected atrial and ventricular hypertrophy, myocardial infraction. CONT…
  • 10.
    12-Lead ECG measurement Most widely used ECG measurement setup in clinical environment  Signal is measured non-invasively with 9 electrodes  Lots of measurement data and international reference databases  Well-known measurement and diagnosis practices  This particular method was adopted due to historical reasons, now it is already rather obsoleteEinthoven leads: I, II & III Goldberger augmented leads: VR, VL & VF Precordial leads: V1-V6
  • 11.
  • 12.
    PCG 12  Graphic recordheart sound - Phonogram.  Recording the sounds connected with the pumping action of heart.  Sound from heart – phonocardiogram  Instrument to measure this – phonocardiograph  Basic function – to pick up the different heart sound,filter the required and display.  Two categories –  heart sound – transient characteristics with short duration.(closing and opening of valves)  murmurs – noisy characteristics with long duration.(turbulent blood flow in heart)
  • 13.
    Origin of sound 13 Valve closure  Movement of heart wall  Valve opening  Extra cardiac sounds 1. Frequency – 10 to 1000 Hz. LOW RANGE – 10 – 60 Hz(3rd and 4th) MEDIUM RANGE – 60 – 150 Hz(1st and 2nd) HIGH RANGE – 150 – 1000 Hz 2.Amplitude 3.Quality
  • 14.
    Origin of sound 14 1st sound: Closure of mitral and tricuspid valves. Freq – 30 to 100 Hz and duration 50 to 100 ms  2nd sound: Closure of aortic and pulmonary valves(slight back flow of blood). Freq – 30 to 100 Hz and duration 25 to 50 ms .  3rd and 4th low intensity and inaudible.(heard among children).
  • 15.
    Origin of sound 15 3rd sound: Blood rapid movement into relaxed ventricular chambers Freq – 10 to 100 Hz and duration 0.04 to 0.08 s.  4th sound: atrial contraction. Freq – 10 to 50 Hz and duration 0.03 to 0.06 s.
  • 16.
    CONT.. 16  Microphones forPCG: Crystal microphone – contains wafer of piezo- electric material, which generates potentials when subjected to mechanical stresses due to heart sound. Smaller in size, high sensitivity. Dynamic microphone – consists of a moving coil having a fixed magnetic core inside it. The coil moves with the heart sound and produce a voltage because of interaction with the magnetic flux. New acoustic sensors – polymer based adherent differential-output sensors.
  • 17.
    Writing methods 17  Lightbeam galvanometer – expensive and require more power from amplifiers when used for high freq.  Direct writing recorders – upper freq 150 Hz.(used for only low freq).  Technique – envelope detection. Fans, Air conditioners and other noise producing gadgets will result in artefacts on the recordings.
  • 18.
    Heart Sounds  S1– onset of the ventricular contraction  S2 – closure of the semilunar valves  S3 – ventricular gallop  S4 – atrial gallop  Other – opening snap, ejection sound  Murmurs 18
  • 19.
    RECORDING SET -UP 19 CONDENSE R MICROPHO NE ECG AMP ECG ELECTRODE FILTER PHONO AMPLIFIER FM TAPE RECORDER MONITOR SCOPE
  • 20.
    MEDICAL APPLICATION 20  Rheumaticvalvular lesions Allergic disease in which the heart valves are likely to be damaged. This creates abnormal heart sound.  The murmurs of aortic steonosis The blood is ejected from the left ventricles through a small opening of aortic valve. High pressure 350 mm of Hg and causes turbulent flow of blood.  The murmurs of aortic regurgitation During diastole, blood flow backward from aorta to left ventricles,causing a blowing murmur.  The murmurs of mitral regurgitation During systole, blood flow backward through mitral valve.  The murmurs of mitral steonosis It produce murmurs when,Blood passes with difficulty from LA into the LV due to pressure difference.
  • 21.
    SPECIAL APPLICATION OFPCG 21  Fetal PCG  Esophageal PCG  Tracheal PCG - Cannula
  • 22.