This document describes a system for remotely monitoring heart sounds and heart rate in real-time. The system uses a stethoscope connected to a computer to record phonocardiogram (PCG) data. The PCG signals are processed using wavelet decomposition to filter noise and extract the heart sounds. Peaks in the processed signal correspond to heartbeats, allowing the heart rate to be calculated directly. The processed data and patient information are saved on a remote server and can be accessed at any time for diagnosis or expert advice. The system provides a low-cost way to remotely monitor cardiovascular health parameters.
Automatic RR Interval Measurement from Noisy Heart Sound Signal Smart Stethos...Editor IJMTER
Heart sound is a physical property of heart which contains many information about the
cardiovascular system and also do have relation with pulses. In Ayurveda theory the diagnosis
depends on pulse duration and time difference between successive pulses. In the present work, heart
sound is measure and analyzed for abnormalities detection. Heart sound recorded by using Electronic
Stethoscope which contains capacitive transducer. The recorded Signal is then filtered firstly by
hardware active filter and then by Wavelet transform in LabVIEW software environment. Also an
algorithm is developed for finding optimum peaks present in recorded signal which in turn are the
RR interval of ECG waveform. It is found that the proposed method of determining RR interval is
parallel to existing methods using ECG signals.
Force sensitive resistance based heart beatijistjournal
Heart related problems are the major health issues for the human. Almost 1 in every 4 death is mainly due
to the heart problems. Most of the people death due to heart problems is due to poor monitoring.To address
this issue this project has been designed. The main aim of this project is to measure the heart rate of an
elderly people and to alert the care taker when the heart rate is abnormal. The innovation done in this
project is measuring the force of the heartbeat at the wrist and thereby measuring the heart rate. The
component used to measure this heart rate is FSR(Force Sensitive Resistor).This device can be
implemented by means of wrist watch or wrist band. It also monitors the heart rate of the people for 24
hours.
IJERA (International journal of Engineering Research and Applications) is International online, ... peer reviewed journal. For more detail or submit your article, please visit www.ijera.com
An Implementation of Embedded System in Patient Monitoring Systemijsrd.com
This paper deals with the measuring of multi-parameter to measure ECG, temperature, evoked potential, respiration rate which uses sensors to measure the patient condition continuously in ICU. For each parameter it uses separate sensors .this multi-channel parameter uses special type of sensors called infracted rays (IR) which are not harmful to human body. All this signals are collected from the patient's body then it is send to the computer and it is diagnosed by the doctor .It reduces the work for the doctors and it gives accurate values. If any abnormalities in the patient's body it produces alarm and it alerts the doctors. This paper also deals with online videography i.e the doctors can view the patient's condition anywhere from the hospital's. Results are stored in the secondary storage system in computer for future reference. the results are obtained in the form of graph, waveforms.
The ECG signals captured from the body of the patient using three electrode model is processed and
conditioned by the analog front end device is finally sent to the data acquisition unit. The data acquisition
unit used is the user pc/ laptop with MATLAB. Using very specific image processing techniques the critical
intelligence from the captured image is extracted. From this processed image any sort of abnormal
conditions is determined which is informed to the corresponding doctor via text message. Simultaneously
the processed image is sent to the doctor mail by using specific TCP/IP protocol.
NADI PARIKSHA: A NOVEL MACHINE LEARNING BASED WRIST PULSE ANALYSIS THROUGH PU...IAEME Publication
The Nadi pariksha technique, which dates to ancient Ayurveda, is a fabulous approach for detecting imbalances in the human body. The pulse, or Nadi (old term), is a vital movement of energy, or life, that moves through the delicate medium of the human body, allowing the physician to feel and understand the blood flow into and out of the heart. It is a traditional method for identifying physical, mental, and emotional imbalances in the body, as well as diseases. A technique for measuring the pressure in pulses like this is useful for disease detection. For any disease diagnosis, however, Nadi pariksha requires experts with vast experience and pulse reading skills. In this paper, an ultrasound microphone sensor is used to identify three Ayurveda doshas, namely, Vata, Pitta, and Kapha, from a collected Nadi signal at a single place. Different statistical features are retrieved for each signal and categorized using the K-NN classifier to identify these three doshas. The proposed work has been tested and validated in a clinical setting with several patients, and we observed that this method results in a higher identification rate for all three doshas.
An ECG Compressed Sensing Method of Low Power Body Area NetworkNooria Sukmaningtyas
Aimed at low power problem in body area network, an ECG compressed sensing method of low
power body area network based on the compressed sensing theory was proposed. Random binary
matrices were used as the sensing matrix to measure ECG signals on the sensor nodes. After measured
value is transmitted to remote monitoring center, ECG signal sparse representation under the discrete
cosine transform and block sparse Bayesian learning reconstruction algorithm is used to reconstruct the
ECG signals. The simulation results show that the 30% of overall signal can get reconstruction signal
which’s SNR is more than 60dB, each numbers in each rank of sensing matrix can be controlled below 5,
which reduces the power of sensor node sampling, calculation and transmission. The method has the
advantages of low power, high accuracy of signal reconstruction and easy to hardware implementation.
The heart is a vital organ that serves to pump blood to the whole body. A heart rate can be used as a healthy body parameter conditions. Growing evidence suggests that IT-based health records play essential role to drive medical revolution especially on data storage and processing. The heart rate measurement (HRM) process usually involves wearable sensor devices to record patient’s data. This data is recorded to help the doctors to analyze and provide a better diagnose in order to determine the best treatment for the patients. Connecting the sensor system through a wireless network to a cloud server will enable the doctor to monitor remotely. This paper presents fit-NES wearable bracelet, an alternative method for integrating a HR measurement device using optical based pulse sensor and Bluetooth-based communication module. This paper is also present the benchmarking of proposed system with several various commercial HR measurement devices.
Day by day the scope & use of the electronics concepts in bio-medical field is going to increase step by step. Electrocardiogram (ECG) is basically a non-invasive way of measuring the electrical activity of the heart by registering the extracellular potentials generated by it. The ECG signal consists of low amplitude voltage in the presence of high amplitude offset. A power-efficient ECG acquisition system uses a fully digital architecture helps to reduce the power consumption and delay time. Instead of analog block, they convert the input voltage into a digital code by delay lines and are mainly built on digital blocks This digital architecture is capable of operating with a low supply voltage of 0.5 V. The circuit implemented in 90nm CMOS technology. The simulation results show that the DCC circuit of digital architecture consumes 0.42nW of power.
Health Care Monitoring for the CVD Detection using Soft Computing Techniquesijfcstjournal
Now-a-days, many diseases are reducing the life time of the human. One of the major diseases is cardiovascular disease (CVD). It has become very common perhaps because of increasingly busy lifestyles.The rapid development of mobile communication technologies offers innumerable opportunities for the development of software and hardware applications for remote monitoring of cardiac disease. Compressed ECG is used for fast and efficient. Before performing the diagnosis, the compressed ECG must be decompressed for conventional ECG diagnosis algorithm. This decompression introduces unnecessary delay. In this paper, we introduce advanced data mining technique to detect cardiac abnormalities from the
compressed ECG using real time classification of CVD.When the patient affect cardiac disease, at the time hospital server can automatically inform to patient via email/SMS based on the real time CVD classification. Our proposed system initially uses the data mining technique, such as Genetic algorithm for attribute selection and Expectation Maximization based clustering. In this technique are used to identify the
disease from compressed ECG with the help of telecardiology diagnosis system
The epidemic growth of wireless technology and mobile services in this epoch is creating a great impact on our life style. Some early efforts have been taken to utilize these technologies in medical industry. In this field, ECG sensor based advanced wireless patient monitoring system concept is a new innovative idea. This system aims to provide health care to the patient. We have sensed the patient’s ECG through 3 lead electrode system via AD8232 which amplifies minor and small bio-signals to the arduino which processes them, along with saline level. Saline level is detected through IR sensors. The output of the electrical pulse is shown with the serial monitor. The saline level is indicated by LCD. The major output ECG analog signal is displayed on serial plotter. The outputs are displayed through mobile application.
Portable ECG Monitoring System using Lilypad And Mobile Platform-PandaBoardIJSRD
New wireless system for biomedical purposes gives new possibilities for monitoring of essential function in human being. Wearable biomedical sensors will give the patient the freedom to be capable of moving readily and still be under continuously monitoring regularity of heartbeats identify any damage to the heart and devices used to regulate the heart and thereby to better quality of patient care. This paper describes a new concept for wireless and portable electrocardiogram (ECG) sensor transmitting signals to a monitoring station at the remote location within specific range, and this concept is intended for monitoring people with impairments in their cardiac activity. The proposed work helps to overcome this problem. With the advancement in Arduino and mobile technology, it is possible to design a portable ECG device which capture ECG of patient and monitor it on mobile platform. This report goes over low power Arduino, mobile platform Panda board and Zigbee technology to couple ECG over mobile board.
A necessária harmonização entre abordagem policial e direitos humanosFranco Nassaro
O artigo analisa os aspectos legais e doutrinários que dirigem o procedimento de abordagem policial em face das garantias e direitos individuais de dimensão constitucional. Apresenta a tese de conciliação dirigida a um plano ideal
de equilíbrio das ações policiais restritivas e a incorporação de valores expressos
como direitos humanos nas intervenções consideradas imprescindíveis para a
segurança pública. Descreve a doutrina institucional dirigida a esse fim a partir da
década de 1990, tendo como referência a Polícia Militar do Estado de São Paulo,
diante das mudanças sócio-culturais e políticas que o país testemunhou em especial a partir de 1985, consolidando a fórmula de mínima restrição de direitos individuais.
A evolução do aparato normativo de proteção à fauna diante dos atos de caça n...Franco Nassaro
Este artigo analisa primeiramente aspectos gerais da prática de caça e do extrativismo animal no Brasil e, na sua segunda parte, apresenta a evolução da legislação de proteção à fauna no país tendo por referência inicial a década de 1930, com base no estudo das normas sistematizadas em cinco fases (até 1934, de 1934 a 1967, de 1967 a 1988, de 1988 a 1998, após 1998). No período ocorreram expressivas mudanças do ordenamento jurídico, sobrevindo legislação restritiva aos atos de caça. As circunstâncias em que surgiram normas específicas tendo por objeto a relação entre os homens e os animais silvestres revelam uma dinâmica própria e caracterizam momentos distintos, porém interligados em um mesmo processo. Essas normas guardam vínculo com a questão da caça associada ao aproveitamento dos recursos faunísticos e com a resposta do poder público objetivando o controle do extrativismo animal.
Publicado na revista Tempos Históricos, da Universidade do Oeste do Estado do Paraná (UNIOESTE), em 2011, conforme informações no rodapé. Publicação impressa e digital.
Acquiring Ecg Signals And Analysing For Different Heart AilmentsIJERA Editor
This paper describes and focuses on acquiring and identification of cardiac diseases using ECG waveform in LabVIEW software, which would bridge the gap between engineers and medical physicians. This model work collects the waveform of an affected person. The waveform is analyzed for diseases and then a report is sent to the doctor through mail. Initially the waveforms are collected from the person using EKG sensor with the help of surface electrodes and the hardware controlled by MCU C8051, acquires ECG and also Phonocardiogram (PCG) synchronously and the waveform is sent to the PC installed with LabVIEW software through DAQ-6211. The waveform in digital format is saved and sent to the loops containing conditions for different diseases. If the waveform parameters coincide with any of the looping statements, particular disease is indicated. Simultaneously the patient PCG report is also collected in a separate database containing all information, which will be sent to the doctor through mail.
Phonocardiogram based diagnostic systemijbesjournal
A Phonocardiogram or PCG is a plot of high fidelity recording of the sounds and murmurs made by the
heart with the help of the machine called phonocardiograph. It has developed continuously to perform an
important role in the proper and accurate diagnosis of the defects of the heart. As usually with the
stethoscope, it requires highly and experienced physicians to read the phonocardiogram. A diagnostic
system based on Artificial Neural Networks (ANN) is implemented as a detector and classifier of heart
diseases. The output of the system is the classification of the sound as either normal or abnormal, if it is
abnormal what type of abnormality is present. In this paper, Based on the extracted time domain and
frequency domain features such as energy, mean, variance and Mel Frequency Cepstral Coefficients
(MFCC) various heart sound samples are classified using Support Vector Machine (SVM), K Nearest
Neighbour (KNN), Bayesian and Gaussian Mixture Model (GMM) Classifiers. The data used in this paper
was obtained from Michigan university website.
Photoplethysmography (PPG) and Phonocardiography (PCG) are two important non-invasive techniques for monitoring physiological parameters of cardiovascular diagnostics. The PCG signal discloses information about cardiac function through vibrations caused by the working heart. PPG measures relative blood volume changes in the blood vessels close to the skin. This paper emphasizes on simultaneous acquisition of PCG and PPG signals from the same subject with the aid of NIELVIS II+ DAQ and the signals are imported to MATLAB for further processing. Heart rate is extracted from both the signals which are found to be distinctive. This analytical approach of processing these signals can abet for analysis of Heart rate variability (HRV) which is widely used for quantifying neural cardiac control and low variability is particularly predictive of death in patients after myocardial infarction.
APPLICATION OF DSP IN BIOMEDICAL ENGINEERING
ECG SIGNAL ACQUISITION, FEATURE EXTRACTION AND HRV ANALYSIS USING BIOMEDICAL ...IAEME Publication
This Paper contains the complete process of ECG/EKG signal Acquisition from
hardware to its analysis using LabVIEW and Biomedical Workbench. Hardware of ECG
has the amplification, filtering and conversion of analog ECG data to digital by using
Arduino Uno. The acquisition part deal with acquiring the hardware data to analyzable
file format into pc. Here 6-channel ADC in Arduino Uno with LabVIEW interface is used
for conversion. Now the acquired ECG data is processed and analyzed with biomedical
workbench that provides the various features of ECG signal processing. This system is
very easy to implement and cost effective
GENDER RECOGNITION SYSTEM USING SPEECH SIGNALIJCSEIT Journal
In this paper, a system, developed for speech encoding, analysis, synthesis and gender identification is
presented. A typical gender recognition system can be divided into front-end system and back-end system.
The task of the front-end system is to extract the gender related information from a speech signal and
represents it by a set of vectors called feature. Features like power spectrum density, frequency at
maximum power carry speaker information. The feature is extracted using First Fourier Transform (FFT)
algorithm. The task of the back-end system (also called classifier) is to create a gender model to recognize
the gender from his/her speech signal in recognition phase. This paper also presents the digital processing
of a speech signals (pronounced “A” and “B”) which are taken from 10 persons, 5 of them are Male and
the rest of them are Female. Power Spectrum Estimation of the signal is examined .The frequency at
maximum power of the English Phonemes is extracted from the estimated power spectrum. The system uses
threshold technique as identification tool. The recognition accuracy of this system is 80% on average.
Recognition of emotional states using EEG signals based on time-frequency ana...IJECEIAES
The recognition of emotions is a vast significance and a high developing field of research in the recent years. The applications of emotion recognition have left an exceptional mark in various fields including education and research. Traditional approaches used facial expressions or voice intonation to detect emotions, however, facial gestures and spoken language can lead to biased and ambiguous results. This is why, researchers have started to use electroencephalogram (EEG) technique which is well defined method for emotion recognition. Some approaches used standard and pre-defined methods of the signal processing area and some worked with either fewer channels or fewer subjects to record EEG signals for their research. This paper proposed an emotion detection method based on time-frequency domain statistical features. Box-and-whisker plot is used to select the optimal features, which are later feed to SVM classifier for training and testing the DEAP dataset, where 32 participants with different gender and age groups are considered. The experimental results show that the proposed method exhibits 92.36% accuracy for our tested dataset. In addition, the proposed method outperforms than the state-of-art methods by exhibiting higher accuracy.
The abnormal condition of electrical activity of
the heart given by ECG (Electrocardiogram) shows the cardiac
diseases affecting the human being. The P, QRS, T wave shape,
amplitude and time intervals between its various peaks contains
useful information about the nature of disease.
This paper presents wavelet technique to analyze ECG signal.
Discrete Wavelet Transform (DWT) is employed as noise
removal and feature extraction tool to achieve efficient design.
Daubechies wavelet of order 10 has been designed using Verilog
Hardware Description Language (HDL) and ModelSim Altera
6.4a is used as simulator. MIT-BIH database has been used for
the analysis
APPLICATION OF DSP IN BIOMEDICAL ENGINEERINGpirh khan
DSP IS NOW A MAJOR BRANCH OF ENGINEERING AND OFTEN USED IN MANY FIELDS. THE PRESENTATION DEALS WITH APPLICATION OF DSP IN BIOMEDICAL ENGINEERING FIELD.
PHONOCARDIOGRAM-BASED DIAGNOSIS USING MACHINE LEARNING: PARAMETRIC ESTIMATION...bioejjournal
The heart sound signal, Phonocardiogram (PCG) is difficult to interpret even for experienced
cardiologists. Interpretation are very subjective depending on the hearing ability of the physician. mHealth
has been the adopted approach towards quick diagnosis using mobile devices. However, it has been
challenging due to the required high quality of data, high computation load, and high-power consumption.
The aim of this paper is to diagnose the heart condition based on Phonocardiogram analysis using
Machine Learning techniques assuming limited processing power to be encapsulated later in a mobile
device. The cardiovascular system is modelled in a transfer function to provide PCG signal recording as it
would be recorded at the wrist. The signal is, then, decomposed using filter bank and the analysed using
discriminant function. The results showed that PCG with a 19 dB Signal-to-Noise-Ratio can lead to 97.33%
successful diagnosis.
Phonocardiogram Based Diagnosis Using Machine Learning : Parametric Estimatio...bioejjournal
The heart sound signal, Phonocardiogram (PCG) is difficult to interpret even for experienced cardiologists. Interpretation are very subjective depending on the hearing ability of the physician. mHealth has been the adopted approach towards quick diagnosis using mobile devices. However, it has been challenging due to the required high quality of data, high computation load, and high-power consumption. The aim of this paper is to diagnose the heart condition based on Phonocardiogram analysis using Machine Learning techniques assuming limited processing power to be encapsulated later in a mobile device. The cardiovascular system is modelled in a transfer function to provide PCG signal recording as it would be recorded at the wrist. The signal is, then, decomposed using filter bank and the analysed using discriminant function. The results showed that PCG with a 19 dB Signal-to-Noise-Ratio can lead to 97.33% successful diagnosis.
Phonocardiogram Based Diagnosis Using Machine Learning : Parametric Estimatio...
Au32311316
1. Priya Rani, A N Cheeran, Vaibhav D Awandekar, Rameshwari S Mane / International Journal
of Engineering Research and Applications (IJERA) ISSN: 2248-9622 www.ijera.com
Vol. 3, Issue 2, March -April 2013, pp.311-316
Remote Monitoring of Heart Sounds in Real-Time
Priya Rani1, A N Cheeran2, Vaibhav D Awandekar3 and Rameshwari S
Mane4
1,4
M. Tech. Student (Electronics), VJTI, Mumbai, Maharashtra
2
Associate Professor, VJTI, Mumbai, Maharashtra
3
A3 RMT Pvt. Ltd. SINE, IIT Mumbai, Maharashtra
ABSTRACT
As health care centres have becomes components. The first and second heart sounds (S1,
popular, daily monitoring of health-status related S2) are the most significant ones [2]. There are still
parameters is becoming important. An easy, other events, nevertheless, that may be recorded,
comfortable and patient friendly solution for including the third and fourth heart sounds (S3, S4)
acquisition, processing and remotely transmitting [3], heart murmur and noise. Most of the
the information from patient to the centre is stethoscopes were acoustic in nature with very less
therefore an important issue. Phonocardiogram sound amplification. With advent of technology the
(PCG) is a physiological signal reflecting the transition took place into electronic and the more
cardiovascular status. This paper deals with a powerful digital-electronic stethoscopes. The
Signal Processing Module for the computer-aided Acoustic and the Electronic stethoscopes are widely
analysis of the condition of heart. The module has prevalent in the current market. A fewer number of
three main blocks: Data Acquisition, Signal companies produce stethoscopes each with their
Processing & Remote Monitoring of heart unique features.
sounds. Data acquired includes the heart sounds. The PCG-based Heart Rate (HR)
The system integrates embedded internet measurement is carried out using the detection of
technology and wireless technology. As the data is cardiac pulse peaks [5]. These algorithms assume a
being send by internet, it realizes real-time general heart sound model. With a basic
recording and monitoring of physiological normalization, Shannon energy and thresholding on
parameter of patients at low cost and both at PCG, S1 and S2 are detected, extracted and counted
home and in hospital. The analysis can be carried to derive the HR [6]. PCG segmentation techniques
out using computer initially and further by that analyze heart sound features are also introduced
doctor. The tele-monitoring system may provide to make the detection more robust [4]. But by
a low-cost, reliable and convenient solution for calculating the Shannon energy [6], and also by the
data acquisition and real time analysis of the segmentation of S1 and S2 [4], it becomes
PCG. The heart sounds are acquired using an complicated to find HR.
acoustic stethoscope and then processed using This paper presents an algorithm not only
software developed using the simulation tool for the direct measurement of heart rate based on
(Python 2.7) & the recorded PCG transmitted PCG but also for the remote monitoring of these
and saved on the server. From where, any time it signals. Wavelet transform is adopted for PCG time-
can be remotely accessed for expert advice and/or series processing. Mother wavelet, Daubechies
for further diagnosis. family is used to filter out the added noise from the
heart sound signal. Then by taking the square of the
Keywords - Cardiac Auscultation, Heart Rate filtered heart sound signal peaks are directly
(HR), Heart sounds, Phonocardiogram (PCG), detected and then the heart rate. Hence the
Python, Stethoscope, Wavelet decomposition processing makes easy. However, since heart sounds
vary in a great extent, this method effectively deal
I. INTRODUCTION with unexpected PCG patterns that differ from the
Heart sounds result from the interplay of presumed model. More importantly the saved data
the dynamic events associated with the contraction on the server can be accessed anytime from
and relaxation of the atria and ventricles, valve anywhere for the reference or for the expert advice.
movements and blood flow. Heart sound can be This paper is organized as follows. The hardware is
heard from the chest through a stethoscope [1], a revealed in Section II. In Section III, the design
device commonly used for screening and diagnosis algorithm is discussed. The verification of the
in primary health care. The art of evaluating the performance of the proposed method through several
acoustic properties of heart sounds and murmurs, experiments is discussed in section VI. Finally, we
including the intensity, frequency, duration, number, draw the conclusion in Section VII.
and quality of the sounds, are known as cardiac
auscultation. Phonocardiography (PCG) is the study
of heart sounds, consists of several different
311 | P a g e
2. Priya Rani, A N Cheeran, Vaibhav D Awandekar, Rameshwari S Mane / International Journal
of Engineering Research and Applications (IJERA) ISSN: 2248-9622 www.ijera.com
Vol. 3, Issue 2, March -April 2013, pp.311-316
II. HARDWARE ARRANGEMENT These sensors have a high-frequency response that is
The block diagram for the implementation quite adequate for body sounds. The microphone is
of the proposed idea is shown in figure 1. In this a an air coupled sensor that measure pressure waves
microphone is placed inside the hollow tube of induced by chest-wall movements (by stethoscope).
stethoscope to convert the mechanical vibrations into The recordings are done in *.wav format using the
the electrical signal and at the other end of the software language (Python) provided with the
stethoscope an audio jack is placed which can easily stethoscope. The software also saves the patient’s
be connected to laptop to record the heart sounds. A information in text file. The sounds were then
server is placed to save the information and data of digitized with a sampling rate of 22050 Hz, 32
the patient. On which this information can be send bits/sample. The digitized signal was then processed
through the wireless link. This recorded sound file is for finding the heart rate.
saved in *.wav format through python 2.7 and the 3.2. Processing
sound quality is mono. Once the sounds are recorded The whole algorithm was implemented in Python
the further processing is done by the software. At the [11]. The steps involved in the heart rate calculation
other end the data can be picked up remotely algorithm are shown in figure 2 and its
through internet. implementation on a real heart sound is shown in
figure 3 (of a child) and figure 4 (of an adult).
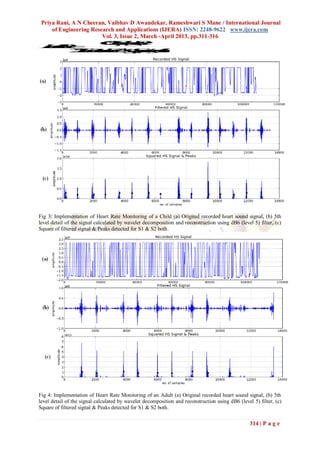
III. DESIGN METHODOLOGY Before wavelet decomposition and reconstruction
The detailed steps of the proposed the original signal was downsampled by a factor of
algorithm are illustrated in Fig. 2. It could be eight so that the details and approximations can
generally divided into three parts: PCG Data result in frequency bands, which contain the
Acquisition, Processing, and Calculation of heart maximum power of S1 (first heart sound) and S2
rate which can be done by finding the peaks of the (second heart sound). The Daubechines 6 and 20 is
squared heart sound signal. used for wavelet decomposition with 5 levels of
decomposition which in this case is d4, d5 [8]. It is
3.1. Data Acquisition proved adequate for heart sound [7]. Then the
The heart sounds are collected from human reconstructed signal is again filtered out with a band
being. The recordings are made using Microtone pass filter having an order of 11 and the lower and
Acoustic Stethoscope for about 5 seconds each. The higher cut-off frequencies of 20Hz to 100Hz
recording is performed in an open space with people respectively. Now the 4th and 5th level signals are
walking and talking around. Microphones are the used for further calculation of heart rate.
natural choice of sensor when recording sound.
Fig 1: Remote Heart Rate Monitoring
312 | P a g e
3. Priya Rani, A N Cheeran, Vaibhav D Awandekar, Rameshwari S Mane / International Journal
of Engineering Research and Applications (IJERA) ISSN: 2248-9622 www.ijera.com
Vol. 3, Issue 2, March -April 2013, pp.311-316
PCG Signal from heart by stethoscope
Microphone Using Hardware
Electrical signal to PC
Recording
Digitized Heart Sound 22050 Hz 32 bits/sample
Downsampling by a Factor 8
Wavelet Decomposition & Reconstruction (db6 level 5)
4th level detail 5th level detail Using Python
Square of Filtered Heart Sound Signal
Peak Detection
Peak Calculation
Calculate Heart Rate
Send audio, graphic & text files to the server Using Wi-Fi / GPRS / Modem
Fig 2: Steps involved in Heart Rate Monitoring
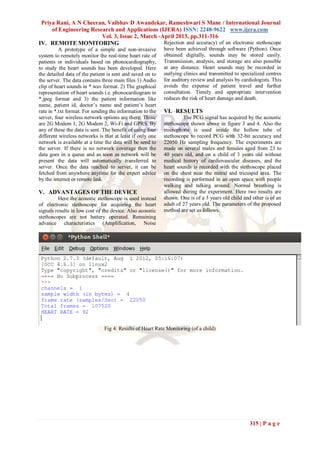
3.3. Peak Detection and Calculation for Heart complicated and the patterns of heart sounds and
Rate murmurs vary largely from recording to recording
Figures 3 & 4 show a filtered PCG signals, even for the normal ones. To solve these problems,
and its square signal and a threshold. Based on the several additions are made in the procedure [10].
envelogram calculated by the square heart sound The main problem is that many extra ‘peaks’ are
signal curve, a threshold is set to eliminate the effect picked up. In order to eliminate the extra peaks, the
of noise and the very low-intensity signal. The peaks intervals between each adjacent peaks are calculated.
of each part whose levels exceed the threshold are The low-level time limit is set, which is used for
picked up and assumed temporarily to be the first deleting extra peaks. When an interval between two
and the second heart sound. Here, only one peak for adjacent peaks is less than the low-level time limit,
each overshoot is chosen even though there are more there must be one extra peak which should be
than one peaks above the threshold. The choice of rejected. When two peaks appear within 50ms,
the peak for each overshoot is based on the which is the largest splitted normal sound interval
following criteria : (1) one peak is always picked up; [9], the peak having maximum strength is picked up.
(2) more than two peaks means the existence of Then by taking the average separation of the peaks,
splitted first or second heart sound, so the first peak heart rate is calculated by the formula,
is picked up in order to get the onset of each sounds.
The actual abnormal heart sound recordings are very
313 | P a g e
4. Priya Rani, A N Cheeran, Vaibhav D Awandekar, Rameshwari S Mane / International Journal
of Engineering Research and Applications (IJERA) ISSN: 2248-9622 www.ijera.com
Vol. 3, Issue 2, March -April 2013, pp.311-316
6 la
0i t
*g
SR
a e
m
pn
e
H
a
r
t
Ra
t
e
2 atAtf s
*t a g iP
Dc .r e
en v a a
c F Sn
io * e
mi oe o
r p ok
Fig 3: Implementation of Heart Rate Monitoring of a Child (a) Original recorded heart sound signal, (b) 5th
level detail of the signal calculated by wavelet decomposition and reconstruction using dB6 (level 5) filter, (c)
Square of filtered signal & Peaks detected for S1 & S2 both.
Fig 4: Implementation of Heart Rate Monitoring of an Adult (a) Original recorded heart sound signal, (b) 5th
level detail of the signal calculated by wavelet decomposition and reconstruction using dB6 (level 5) filter, (c)
Square of filtered signal & Peaks detected for S1 & S2 both.
314 | P a g e
5. Priya Rani, A N Cheeran, Vaibhav D Awandekar, Rameshwari S Mane / International Journal
of Engineering Research and Applications (IJERA) ISSN: 2248-9622 www.ijera.com
Vol. 3, Issue 2, March -April 2013, pp.311-316
IV. REMOTE MONITORING Rejection and accuracy) of an electronic stethoscope
A prototype of a simple and non-invasive have been achieved through software (Python). Once
system to remotely monitor the real-time heart rate of obtained digitally, sounds may be stored easily.
patients or individuals based on phonocardiography, Transmission, analysis, and storage are also possible
to study the heart sounds has been developed. Here at any distance. Heart sounds may be recorded in
the detailed data of the patient is sent and saved on to outlying clinics and transmitted to specialized centres
the server. The data contains three main files 1) Audio for auditory review and analysis by cardiologists. This
clip of heart sounds in *.wav format. 2) The graphical avoids the expense of patient travel and further
representation of heart sounds i.e. phonocardiogram in consultation. Timely and appropriate intervention
*.jpeg format and 3) the patient information like reduces the risk of heart damage and death.
name, patient id, doctor’s name and patient’s heart
rate in *.txt format. For sending the information to the VI. RESULTS
server, four wireless network options are there. Those The PCG signal has acquired by the acoustic
are 2G Modem 1, 2G Modem 2, Wi-Fi and GPRS. By stethoscope shown above in figure 3 and 4. Also the
any of these the data is sent. The benefit of using four microphone is used inside the hollow tube of
different wireless networks is that at least if only one stethoscope to record PCG with 32-bit accuracy and
network is available at a time the data will be send to 22050 Hz sampling frequency. The experiments are
the server. If there is no network coverage then the made on several males and females aged from 23 to
data goes in a queue and as soon as network will be 40 years old, and on a child of 3 years old without
present the data will automatically transferred to medical history of cardiovascular diseases, and the
server. Once the data reached to server, it can be heart sounds is recorded with the stethoscope placed
fetched from anywhere anytime for the expert advice on the chest near the mitral and tricuspid area. The
by the internet or remote link. recording is performed in an open space with people
walking and talking around. Normal breathing is
V. ADVANTAGES OF THE DEVICE allowed during the experiment. Here two results are
Here the acoustic stethoscope is used instead shown. One is of a 3 years old child and other is of an
of electronic stethoscope for acquiring the heart adult of 27 years old. The parameters of the proposed
signals results in low cost of the device. Also acoustic method are set as follows.
stethoscopes are not battery operated. Remaining
advance characteristics (Amplification, Noise
Fig 4: Results of Heart Rate Monitoring (of a child)
315 | P a g e
6. Priya Rani, A N Cheeran, Vaibhav D Awandekar, Rameshwari S Mane / International Journal
of Engineering Research and Applications (IJERA) ISSN: 2248-9622 www.ijera.com
Vol. 3, Issue 2, March -April 2013, pp.311-316
Fig 5: Results of Heart Rate Monitoring (of an adult)
Figures 4 and 5 show the following results for a child Auscultation, International Journal of
and an adult respectively. 1) The channel is mono. 2) Scientific & Engineering Research Volume 2,
Recorded heart sounds have 32-bit accuracy i.e. the Issue 10, Oct-2011.
sample width is 4. 3) Sampling frequency is 22050 [6]. H Liang, S Lukkarinen and I Hartimo, Heart
Hz, 4) total frames in 5 sec recorded data sound. 5) Sound Segmentation Algorithm Based on
The heart rate calculated by peaks detected. Heart Sound Envelolgram, Computers in
Cardiology, Vol24 , 1997, pp 105-108
VII. CONCLUSION [7]. Durand L G, Pibarot P, Digital Signal
A module which acquires the heart sounds Processing of Phonocardiogram: Review of
and processed them to get the phonocardiogram and the most recent advancements, Critical
heart rate has been developed and this can tele- ReviewTM in Biomedical Engineering, vol 23,
monitor PCG. A general physician can interact with 1995, pp 116-219
the module and get quick preliminary diagnosis of [8]. H Liang, S Lukkarinen, I Hartimo, Heart
heart problems of patients who cannot be easily Sound Segmentation Algorithm Based on
shifted to advanced hospitals which are at a distance Heart Sound Envelolgram, Computers in
and also who cannot afford high consultation fee and Cardiology, IEEE, Vol. 24, pp. 105-108,
traveling cost. The Module has a provision of 1997.
extracting information at the end of every step instead Books:
of working as a black box to the user. Such module [9]. Hurst JW. The heart arteries and veins, 7th
will be a step towards the development of efficient ed. McGraw-Hill Information Services
medical care. It will overcome the deficiency of Company, New York 1990: Ch. 14: 175-242.
expert cardiologist in both urban and rural areas. Proceedings Papers:
[10]. S. Omran and M. Tayel, A Heart Sound
REFERENCES Segmentation and Feature Extraction
Journal Papers: Algorithm using Wavelets, IEEE ISCCSP,
[1]. L. A. Geddes, Birth of the stethoscope, 2004, pp. 235-238.
Engineering in Medicine and Biology Websites:
Magazine, IEEE, vol. 24, pp. 84, 2005. [11].
[2]. J. Abrams, Current concepts of the genesis of http://docs.python.org/release/2.3.5/
heart sounds. I. First and second sounds, tut/tut.html; the Python Tutorial by Guido
Jama, vol. 239, pp. 2787-9, 1978. van Rossum.
[3]. N. J. Mehta and I. A. Khan, Third heart
sound: genesis and clinical importance, Int J
Cardiol, vol. 97, pp. 183-186, 2004.
[4]. Faizan Javed, P A Venkatachalam and
Ahmad Fadzil M H, A Signal Processing
Module for the Analysis of Heart Sounds and
Heart Murmurs, 2006, International Journal
of Physics International MEMS Conference
Series 34, pp 1098–1105.
[5]. M.Vishwanath Shervegar, Ganesh.V.Bhat
and Raghavendra M Shetty K,
Phonocardiography–the future of cardiac
316 | P a g e