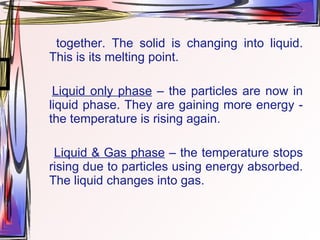
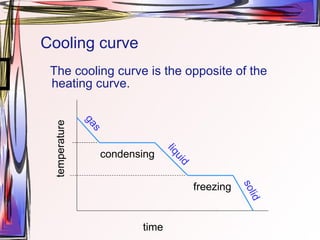
The document discusses heating and cooling curves, which are graphs of temperature over time that can be used to determine phase changes and melting/boiling points of substances. Heating curves show flat regions where temperature remains constant as a substance changes phase from solid to liquid to gas. Cooling curves are the opposite and show phase changes from gas to liquid to solid. The document provides examples of constructing heating and cooling curves by heating/cooling water and stearic acid and measuring temperature changes.