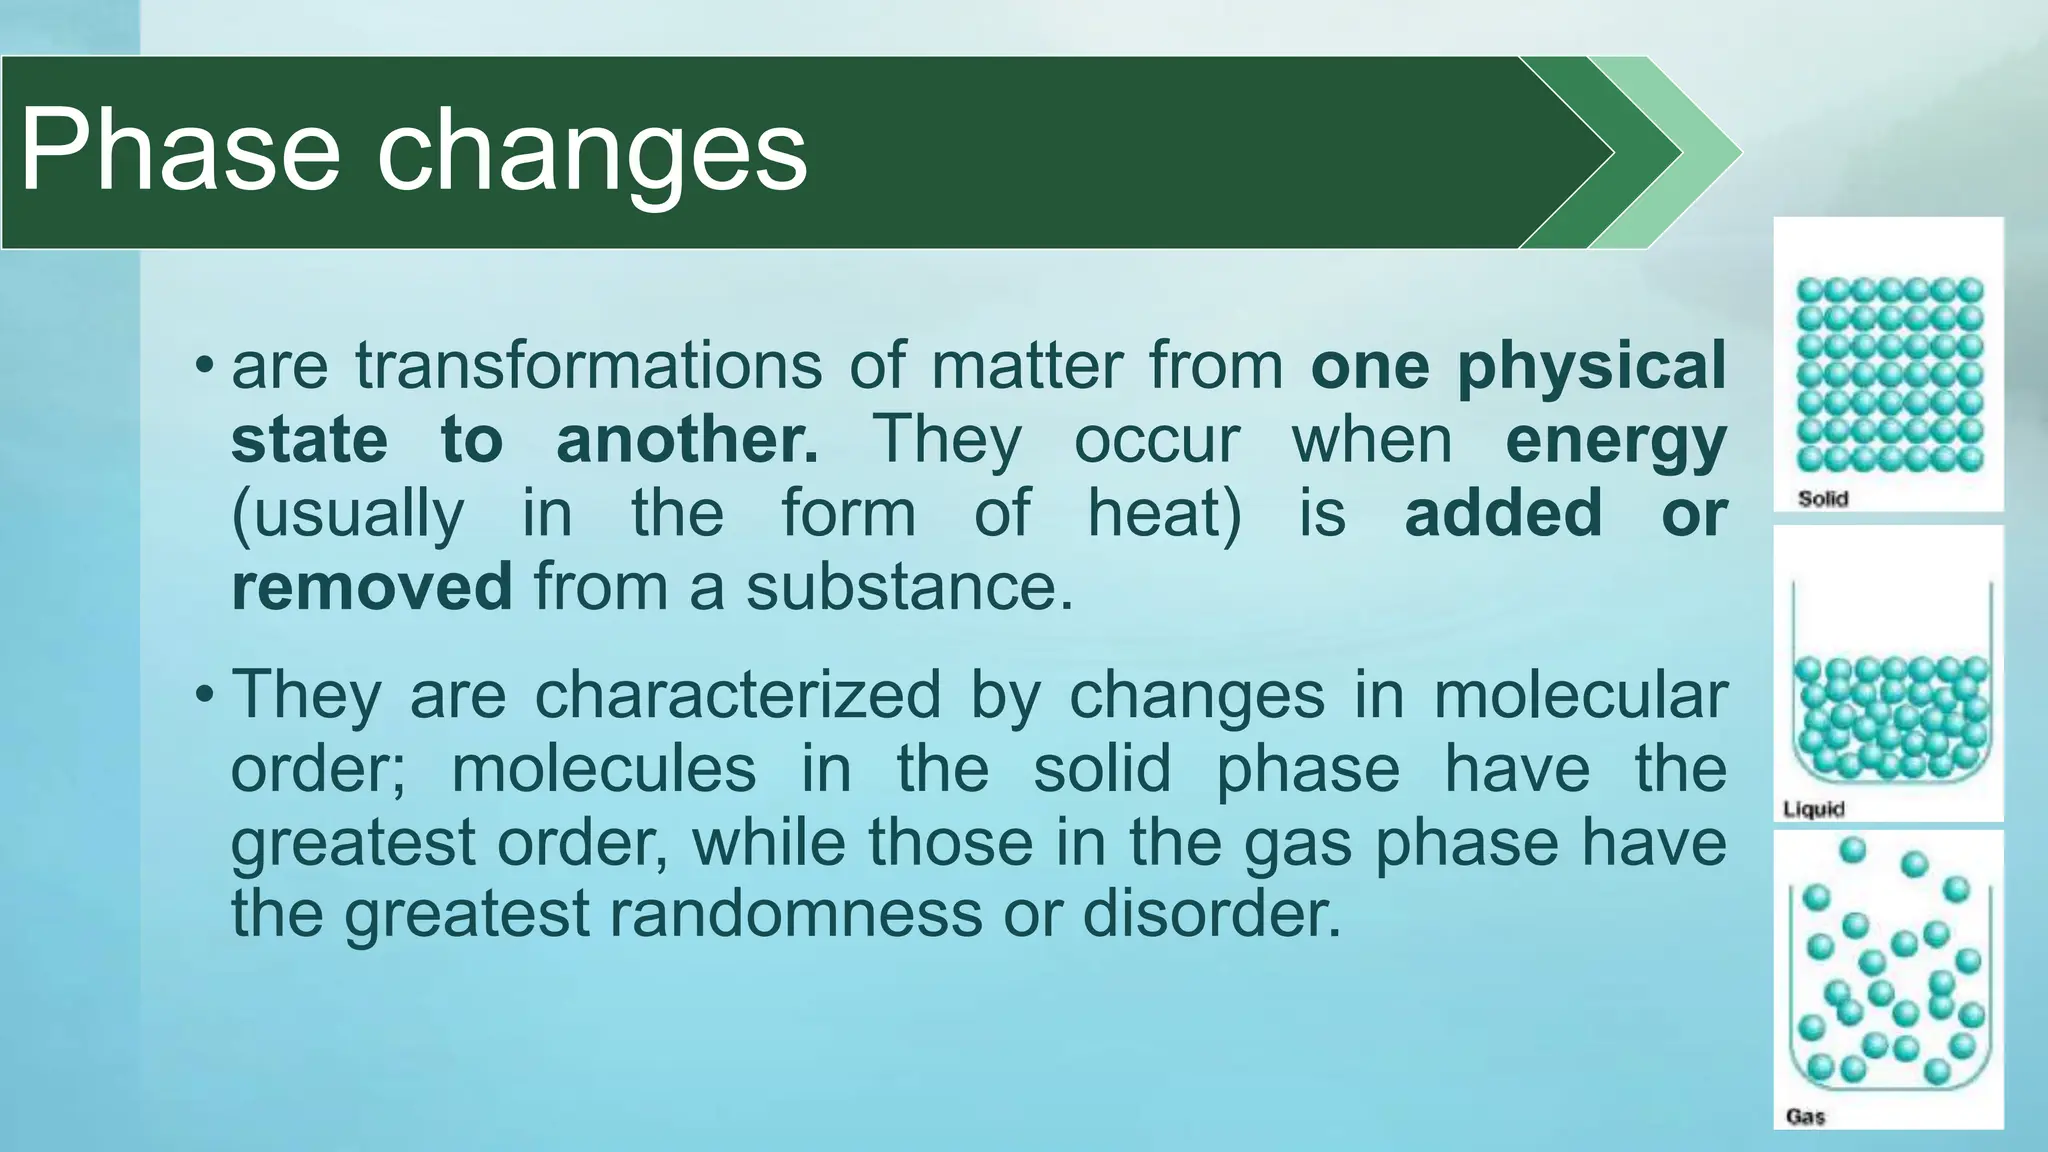
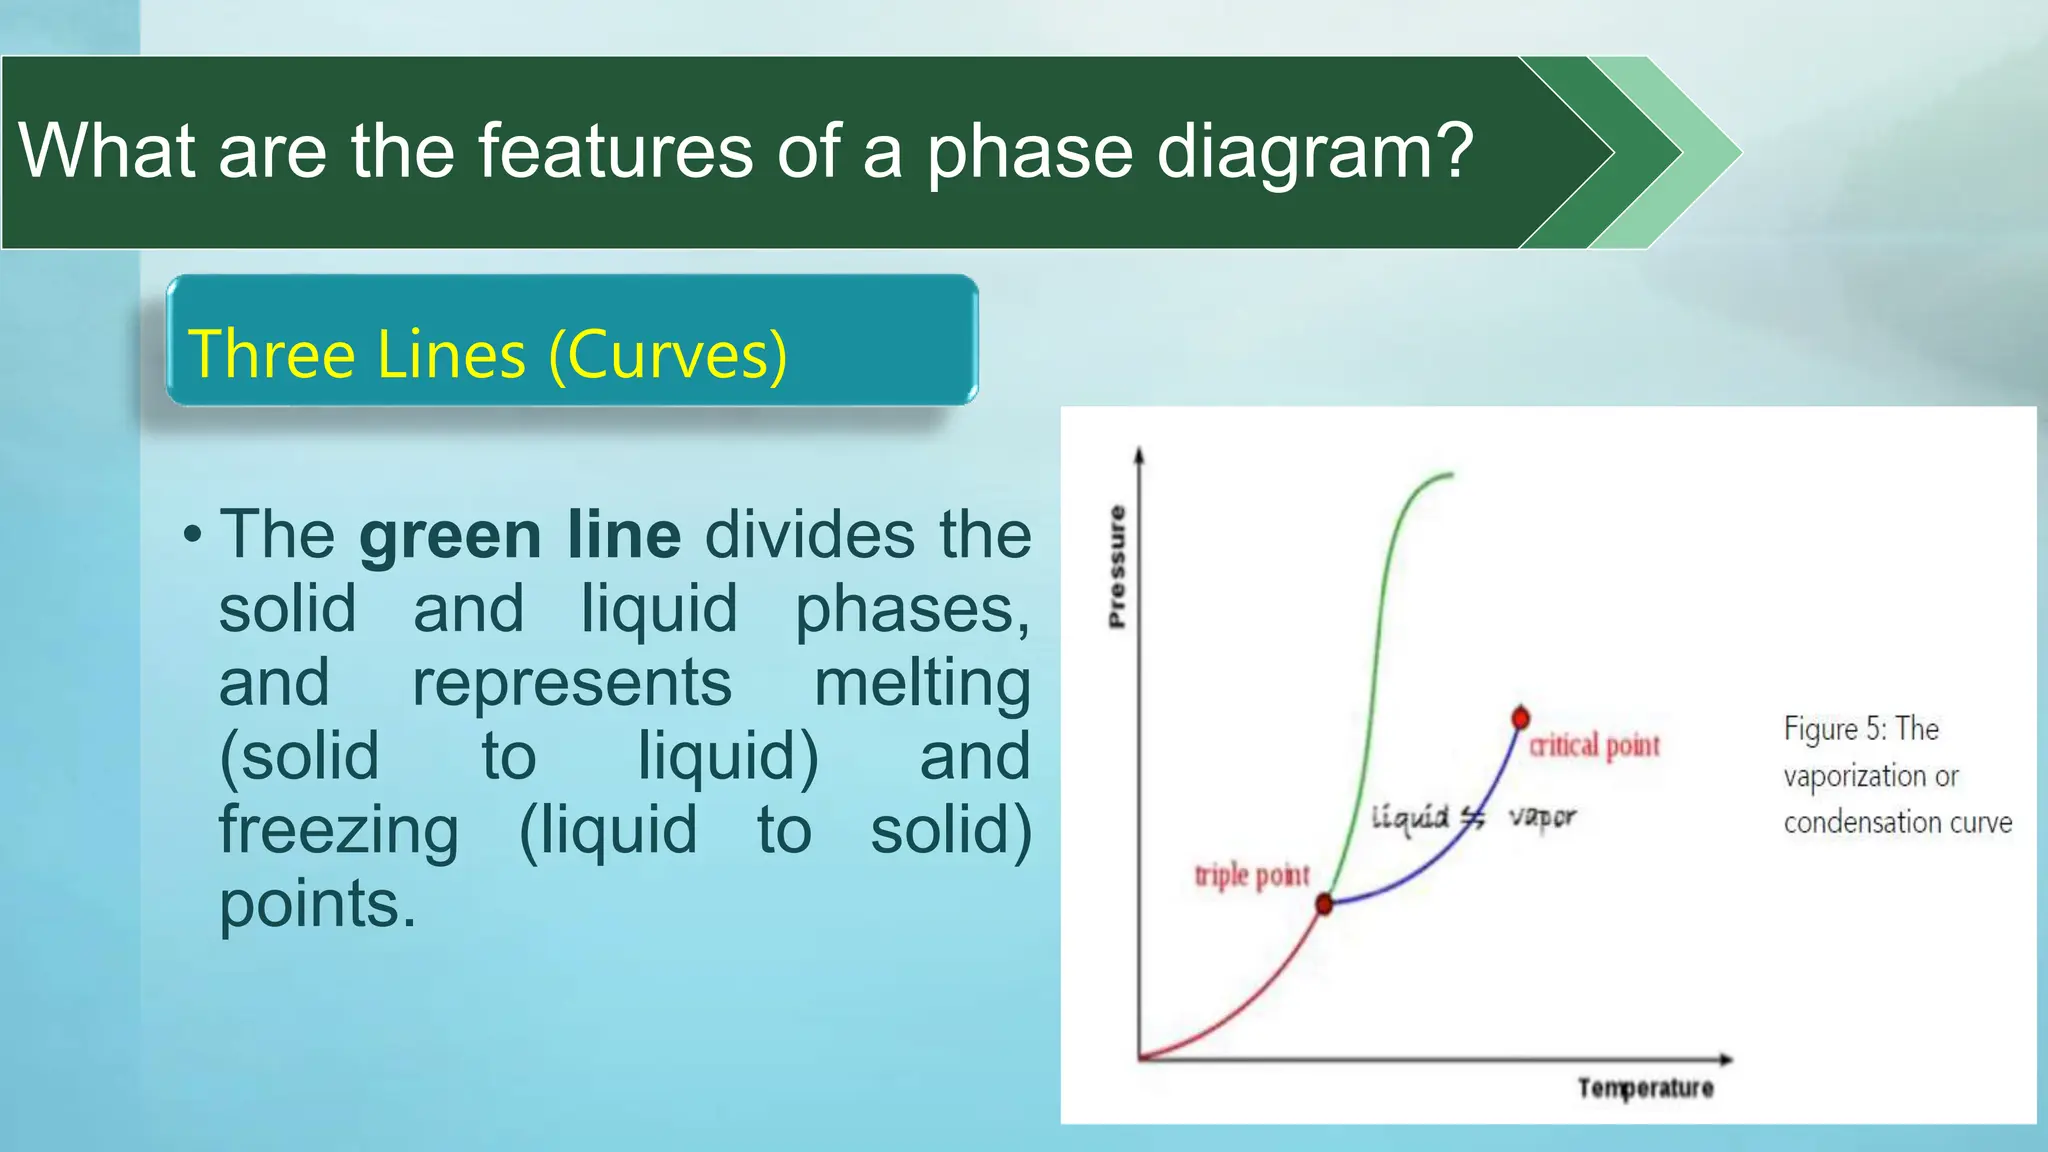
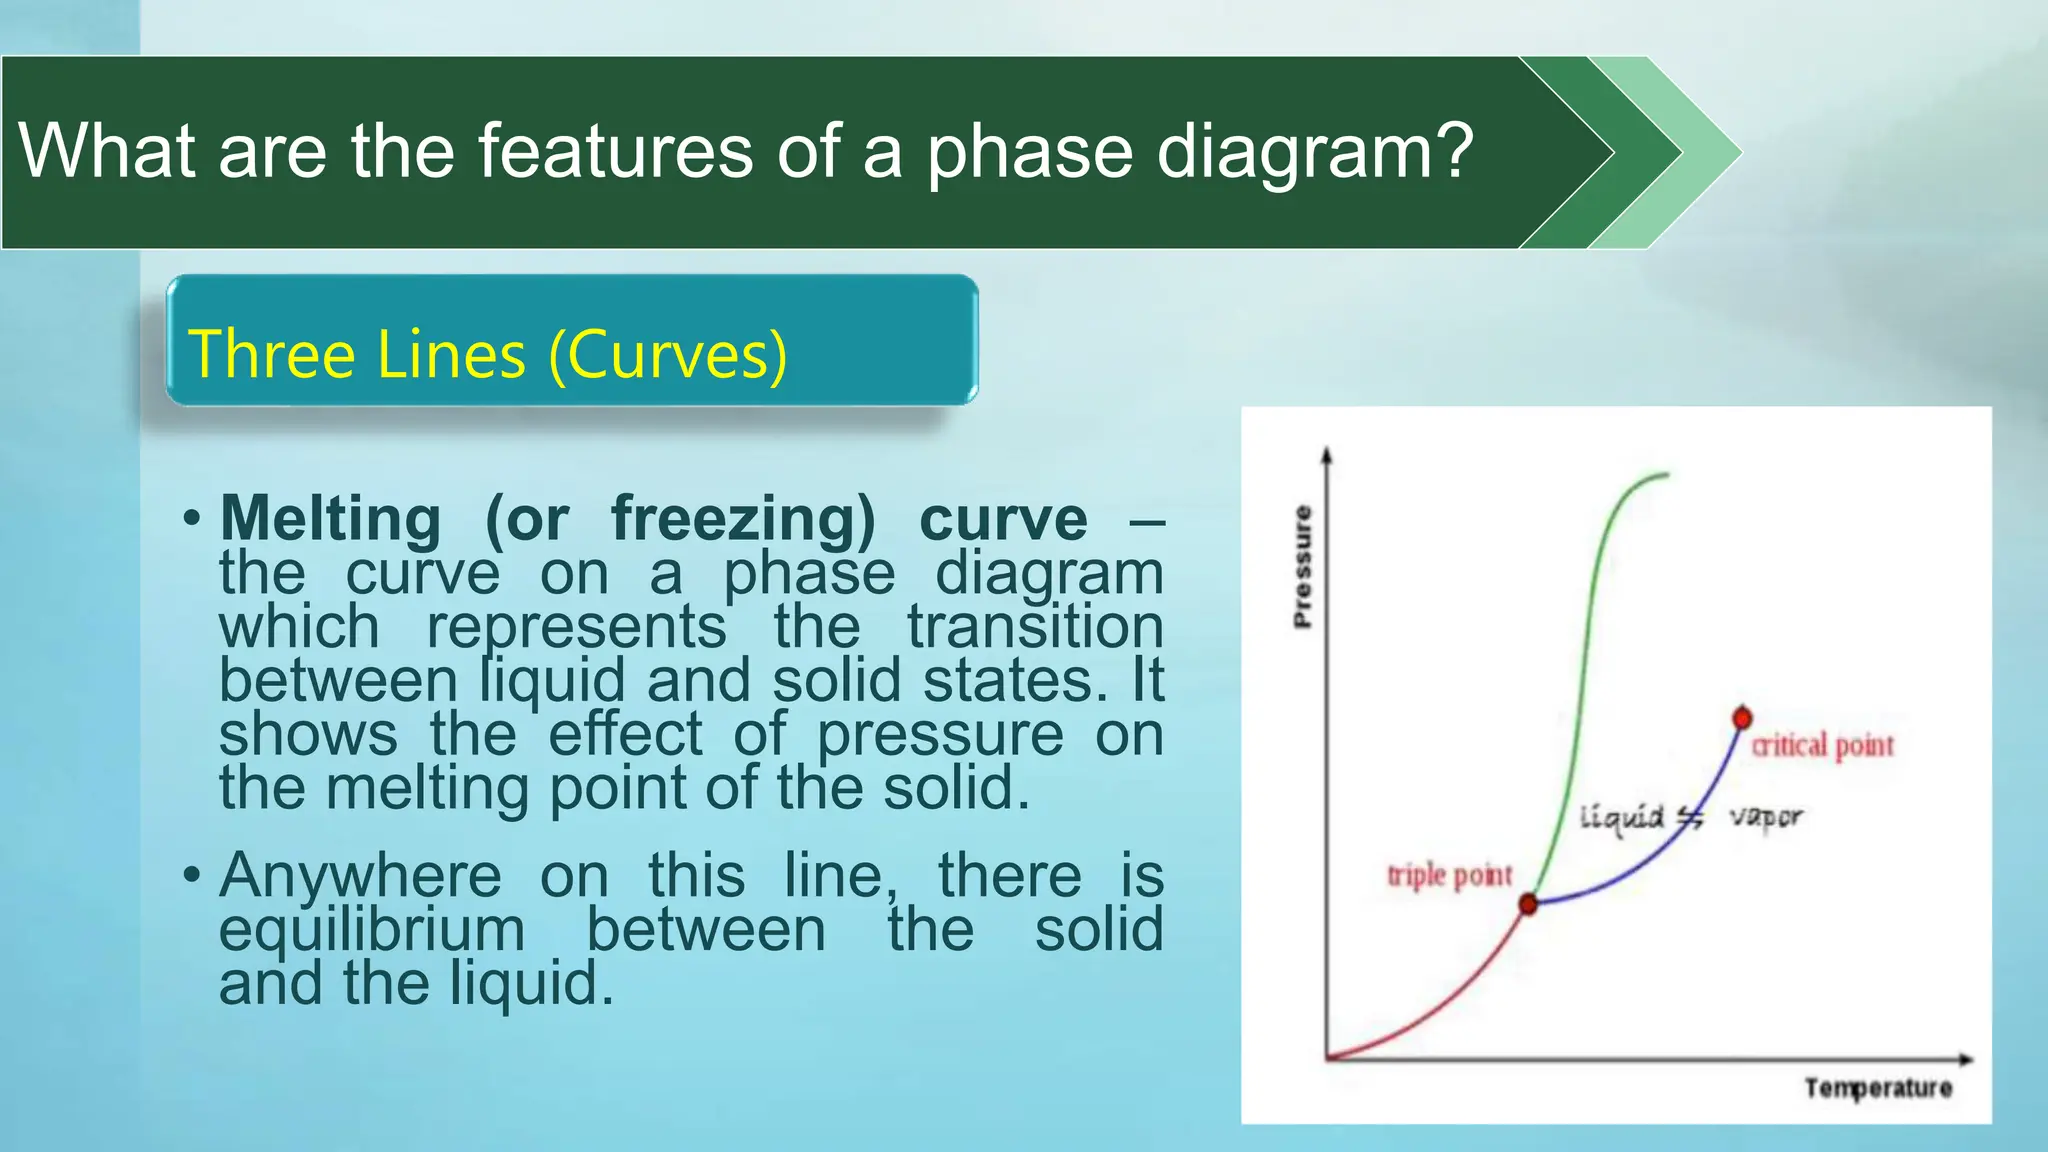
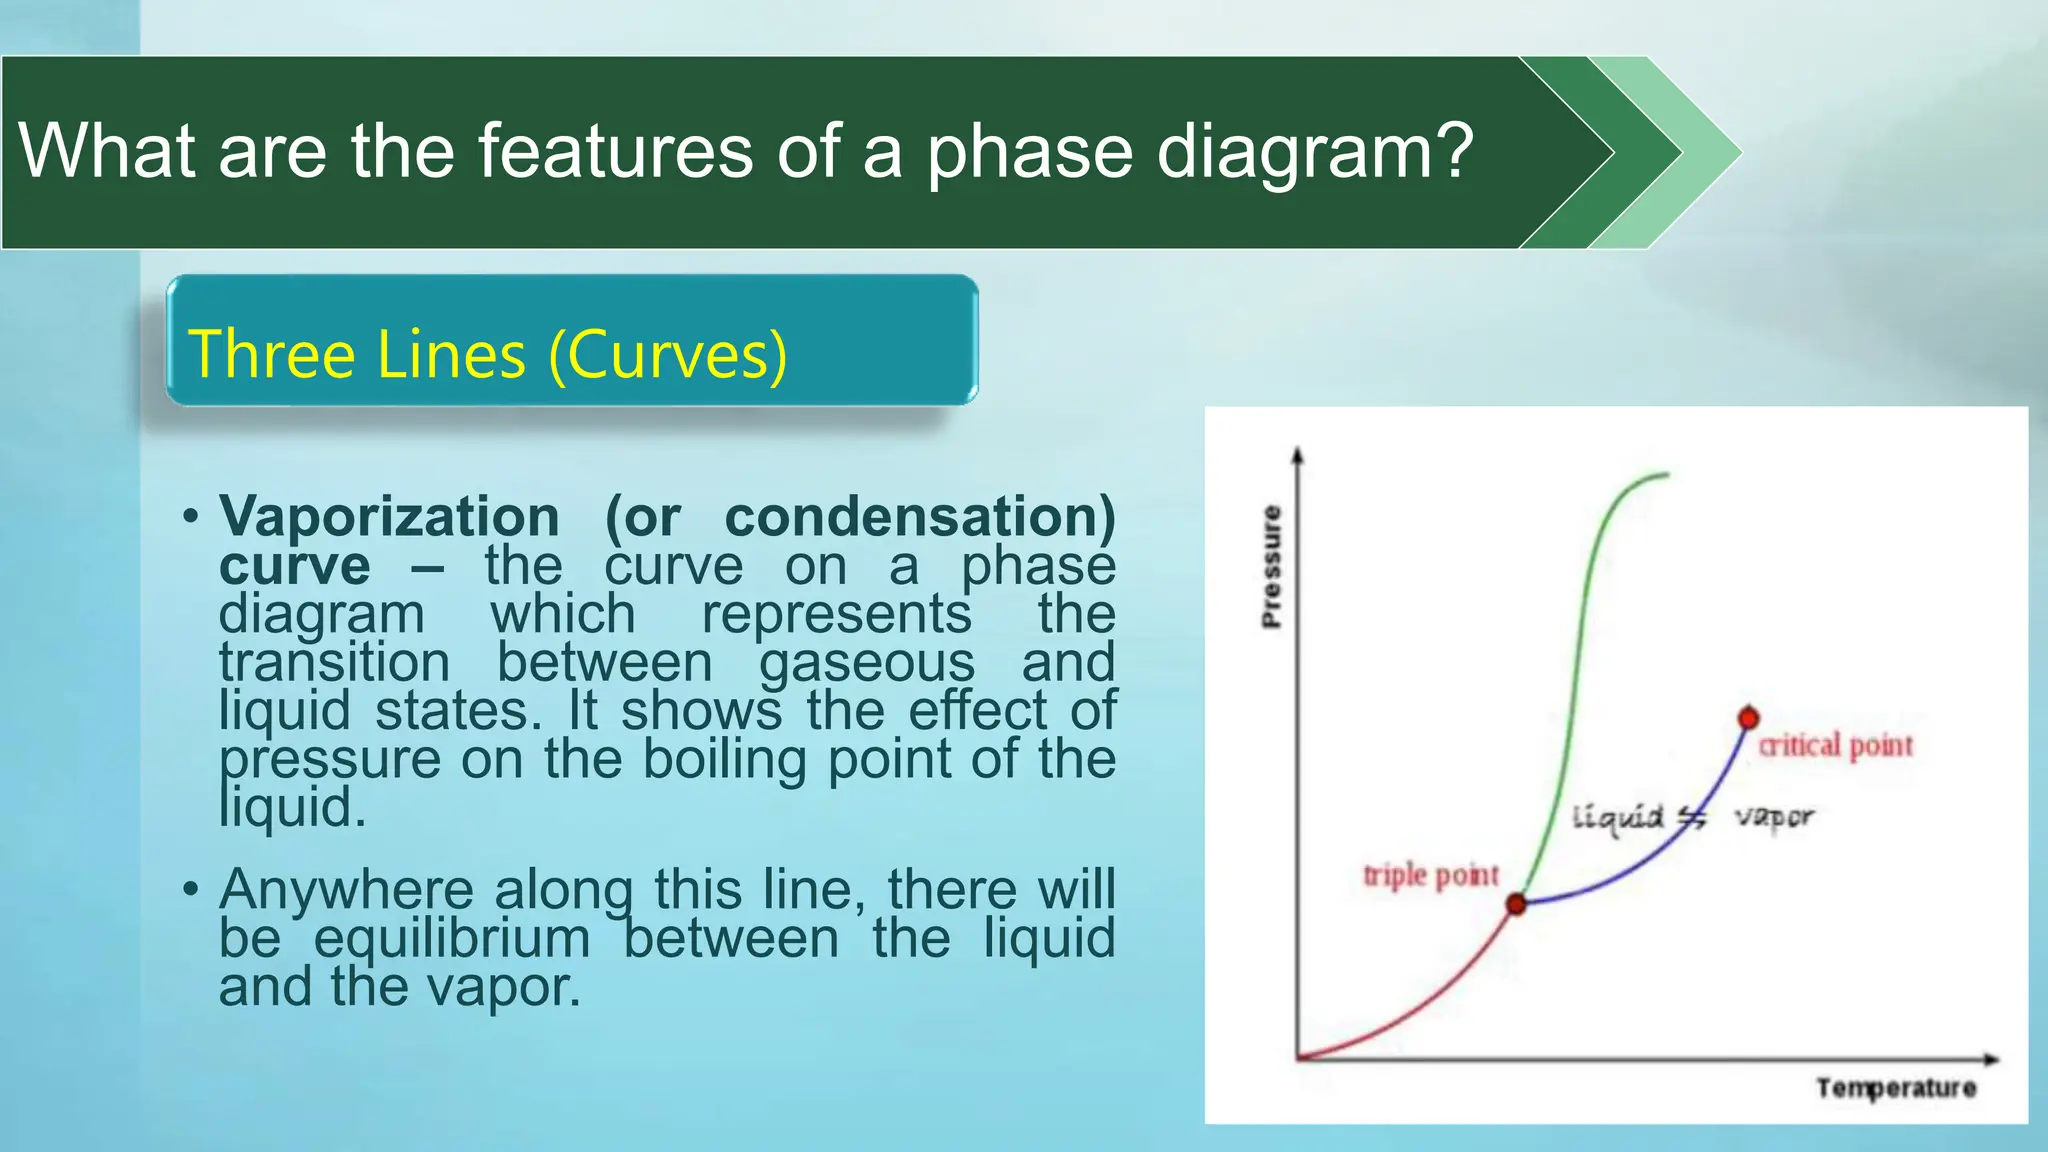
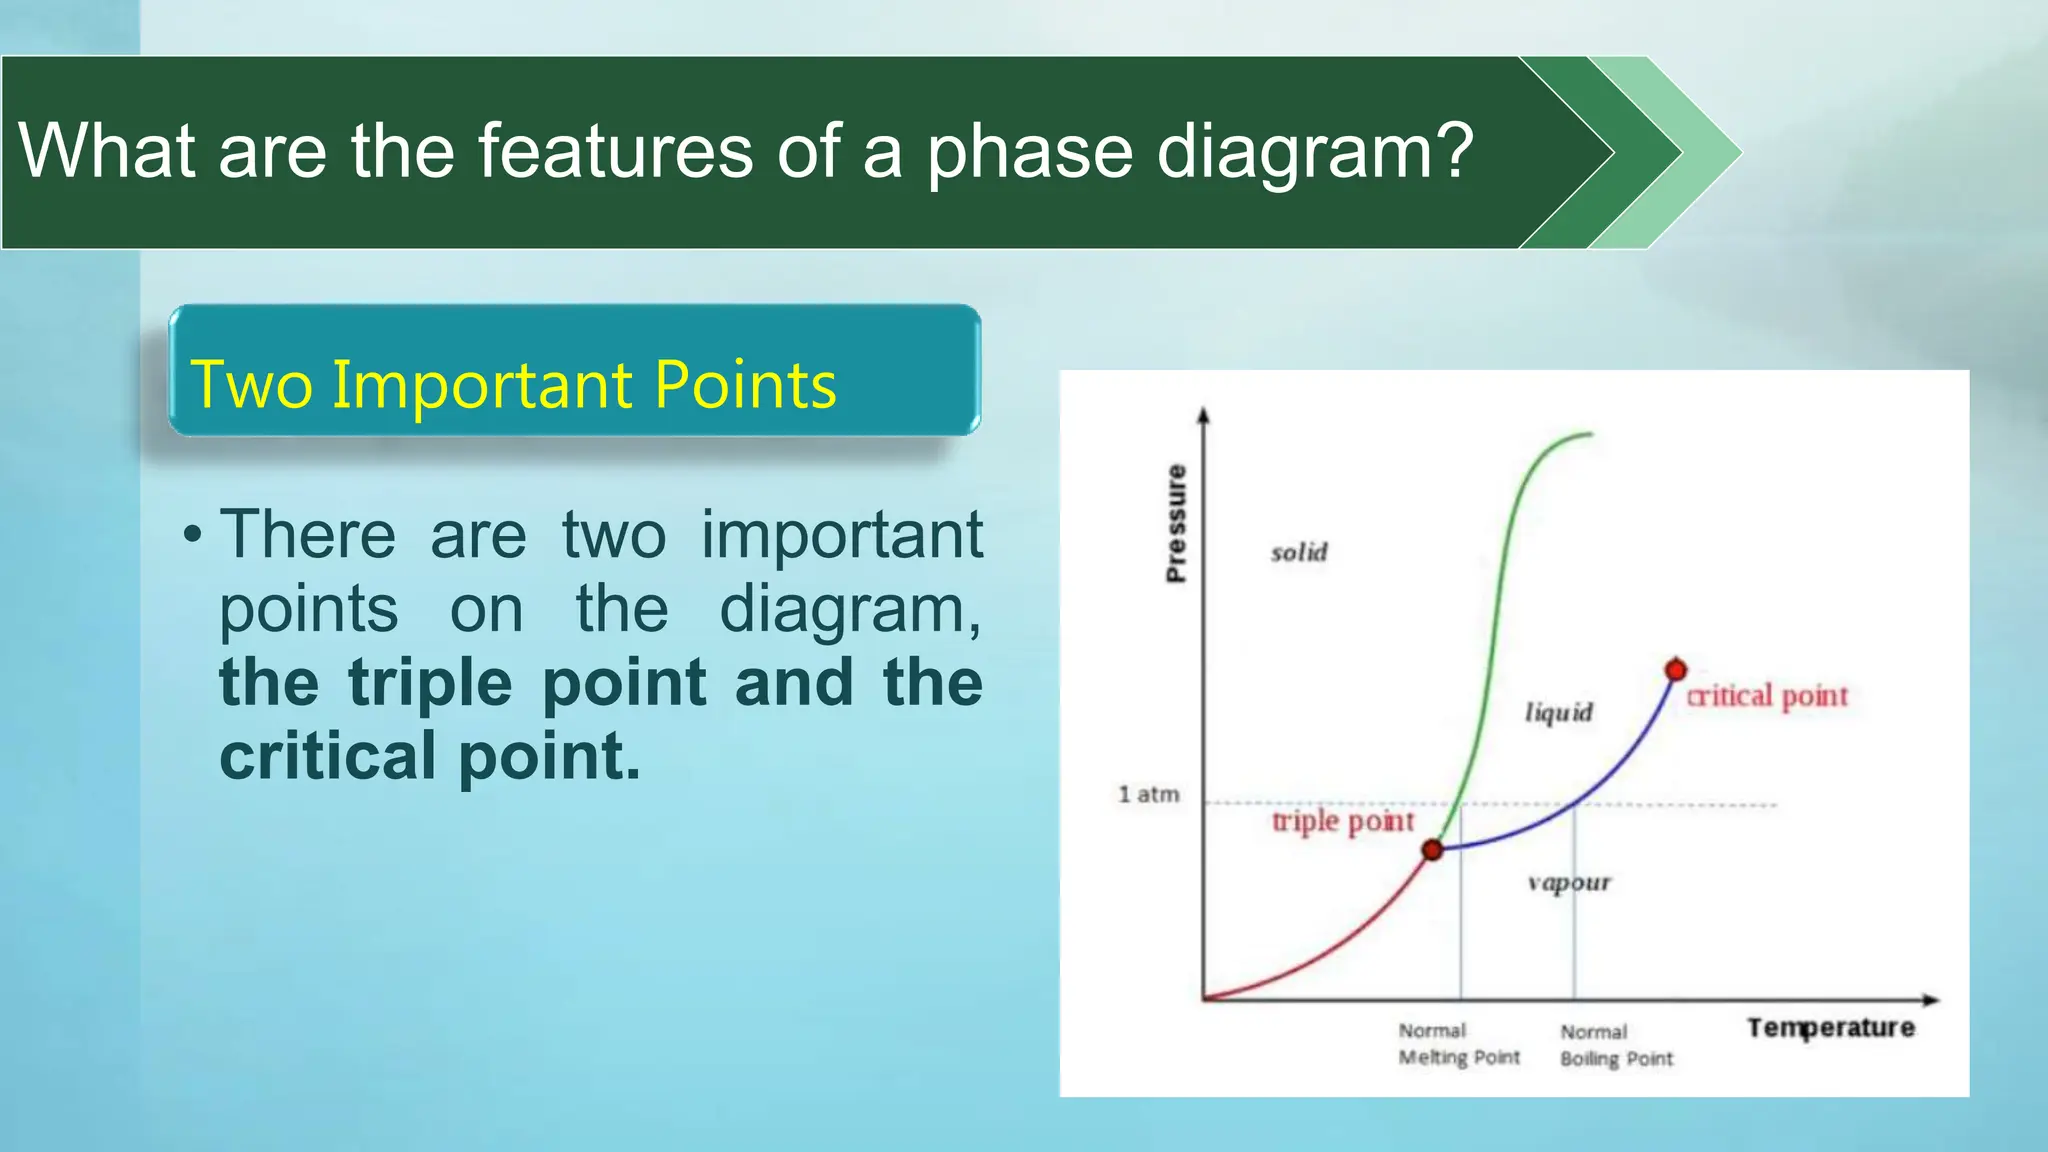
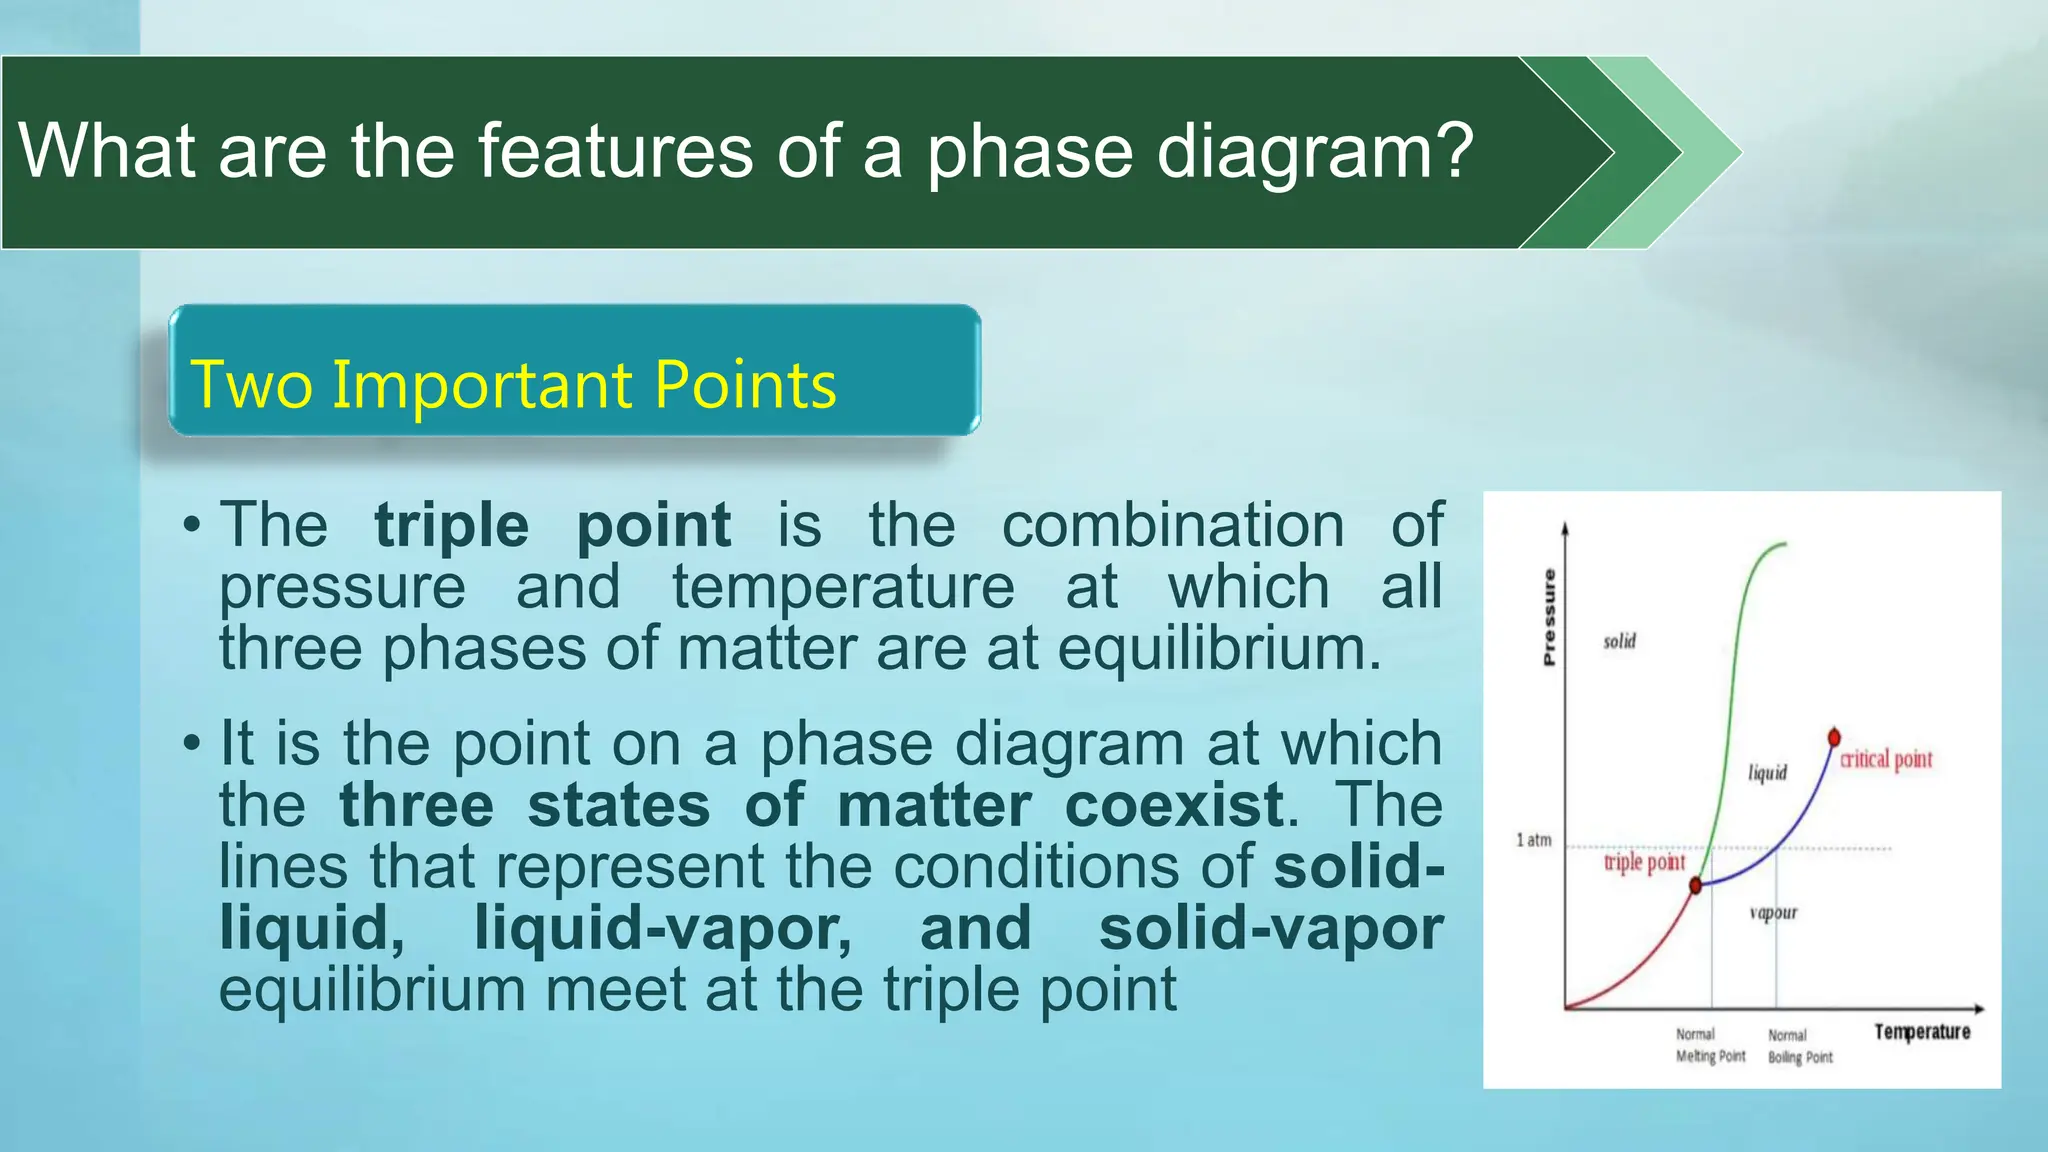
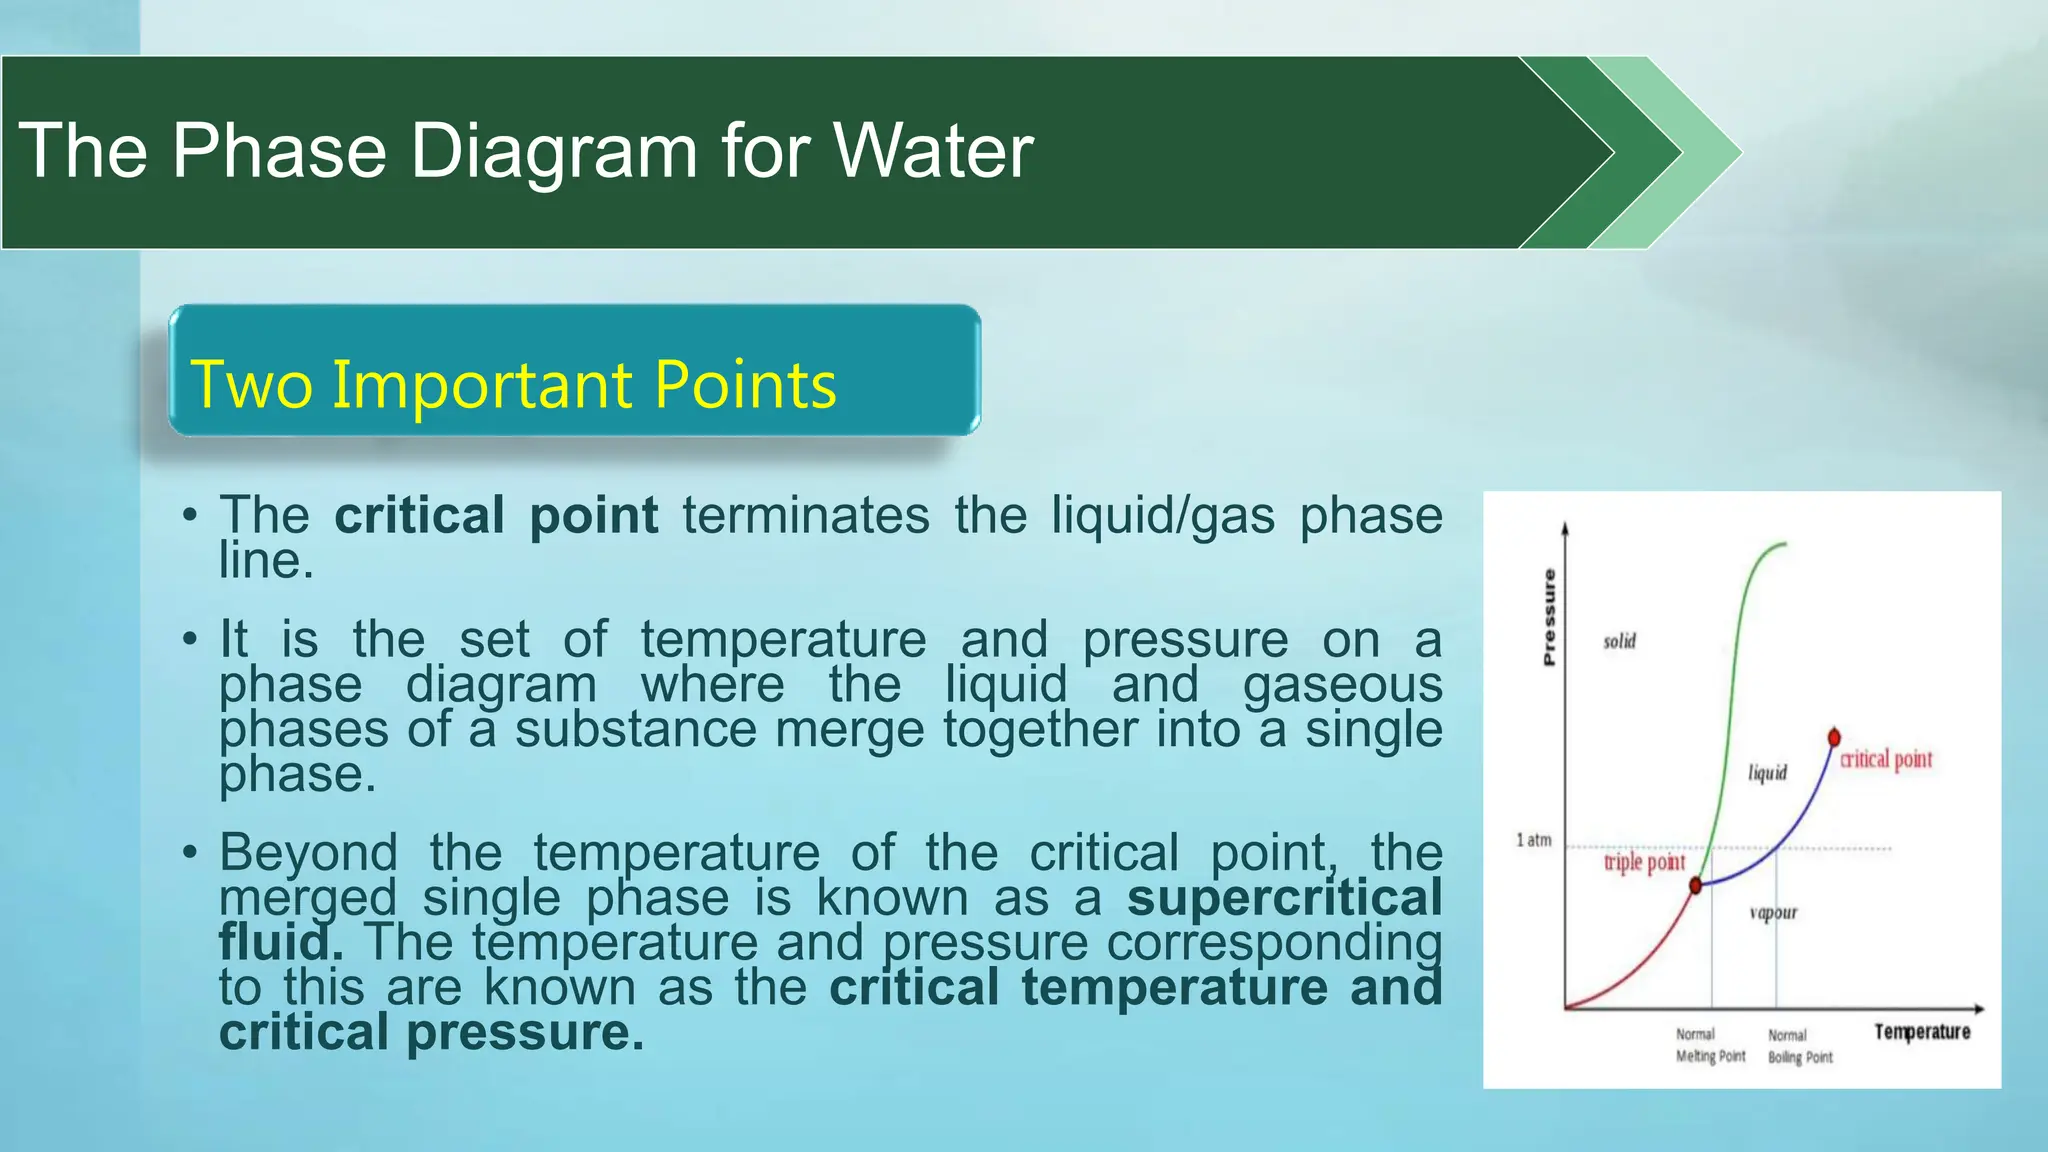
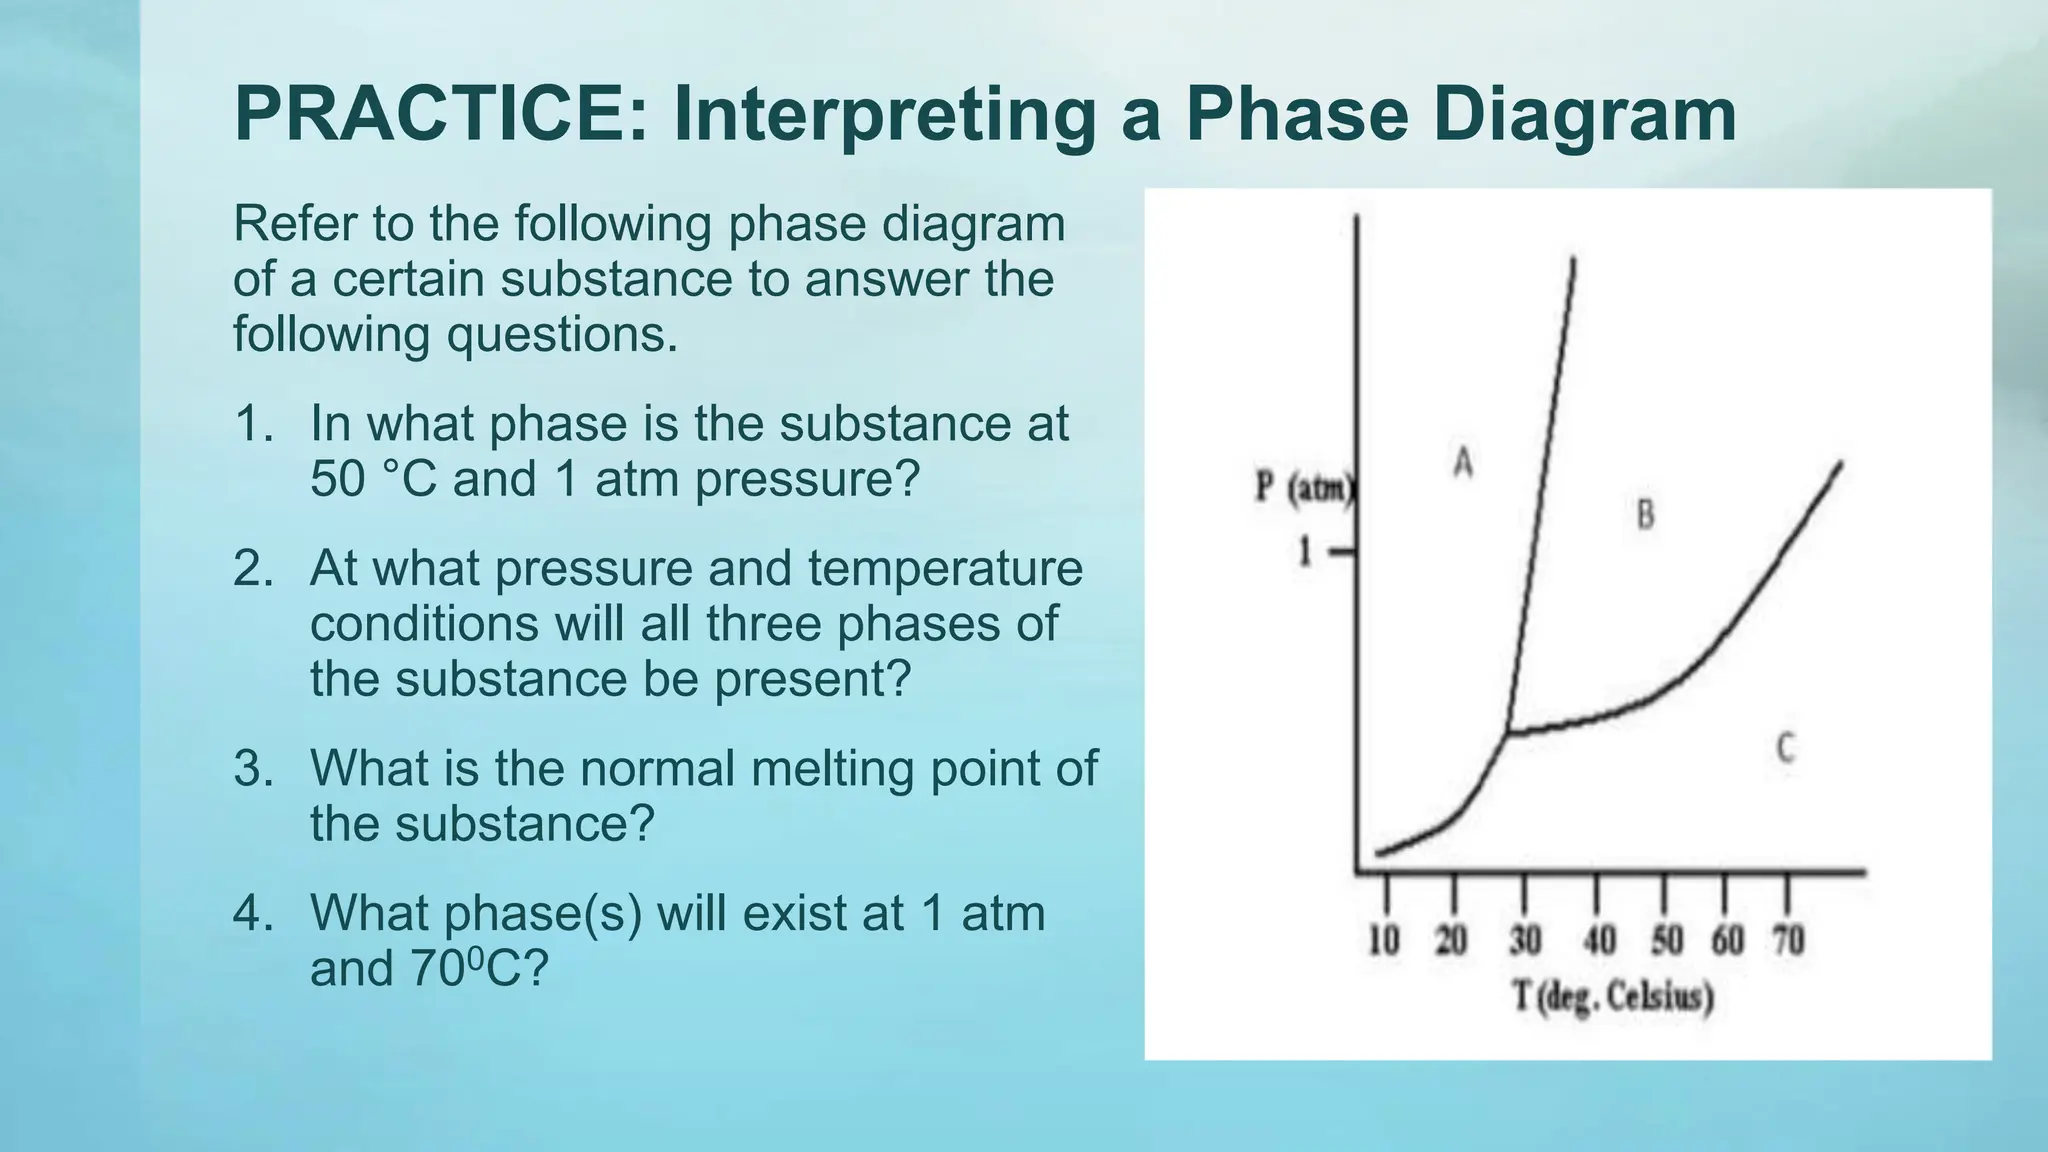
ACTIVITY 1 Phase Changes
Guide Questions:
1. Take a look at the graph closely, the graph
shows
A. chemical changes B. phase changes
C. energy changes D. temperature changes
For what reason do you say so? _____________
2. The temperature at which a substance changes
from a gas to a liquid is called the __________.
A. freezing point B. condensation point
C. melting point D. vaporization point
3. At a temperature of 00C, water begins to
_______________.
A. freezes B. melts C. turns to gas D. none of these
Intermolecular Forces of Liquids and Solids;
Phase Changes
Specific Learning Outcomes
Learning Competencies
1. Describe the nature of the following phase changes in terms of energy change and
the increase or decrease in molecular order: solid-liquid, liquid vapor, and solid-
vapor (STEM_GC11IMF-IIIa-c-106)
2. Interpret the phase diagram of water and carbon dioxide. (STEM_GC11IMF-IIIa-c-
107)
Specific Objectives:
1. explain phase changes
2. describe how changes in temperature and pressure can change the state of matter;
3. describe the components/ features of a phase diagram;
4. analyze and interpret the phase diagram of water and carbon dioxide;
Specific Learning Outcomes
Phase changes
• are transformations of matter from one physical
state to another. They occur when energy
(usually in the form of heat) is added or
removed from a substance.
• They are characterized by changes in molecular
order; molecules in the solid phase have the
greatest order, while those in the gas phase have
the greatest randomness or disorder.
Specific Learning Outcomes
Types of phase changes
•The change from solid to
liquid is melting, liquid to
gas is vaporization, and
solid to gas is sublimation.
•These changes take place
when heat is absorbed (heat
gained).
•They are endothermic
processes.
Specific Learning Outcomes
Types of phase changes
•The reverse change from
gas to liquid is
condensation, gas to
solid is deposition, and
liquid to solid is freezing.
•These changes give off
heat (heat lost) and are
exothermic processes
During phase changes, two physical states of the substance
exist at the same time. When addition or removal of heat is
stopped at this temperature, the two physical states will
interconvert from one state to the other, and will be at
equilibrium.
1. SOLID- LIQUID EQUILIBRIUM 
MELTING AND FREEZING
2. LIQUID-VAPOR EQUILIBRIUM 
BOILING AND CONDENSING
3. SOLID-VAPOR EQUILIBRIUM 
SUBLIMATION AND DEPOSITION:
Specific Learning Outcomes
How does a change in energy affect
phase changes?
• When a substance is heated, the added energy is used by the
substance in either of two ways:
a. The added heat increases the kinetic energy of the
particles and the particles move faster. The increase in
kinetic energy is accompanied by an increase in
temperature.
b. The added heat is used to break attractive forces between
particles. There is no observed increase in temperature
when this happens. Often a change in the physical
appearance of the substance is observed, such as a
phase change.
Specific Learning Outcomes
How does a change in energy affect
phase changes?
• Conversely, the removal or release of heat results
in two ways:
a. A decrease in kinetic energy of the particles.
The motion of the particles slow down. A
decrease in temperature is observed.
b. Forces of attraction are formed, and a phase
change may occur. No change in temperature
is observed.
Specific Learning Outcomes
HEAT CHANGE WITH CHANGE IN
TEMPERATURE
•When a system contains only one phase (solid,
liquid, or gas), the temperature will change
when it receives energy during heating or when
energy is removed during cooling.
•The amount of heat received or removed from
the sample to effect a given change in
temperature can be calculated using the
specific heat of the substance.
Specific Learning Outcomes
HEAT CHANGE WITH CHANGE IN
TEMPERATURE
•This is the amount of heat needed to raise the
temperature of 1 gram of a substance by 1OC.
•It is also equal to the amount of heat lost by 1
gram of substance when its temperature drops
by 1oC.
SPECIFIC HEAT CAPACITY
Specific Learning Outcomes
HEAT CHANGE WITH CHANGE IN
TEMPERATURE
•The specific heat of a substance differs for the
solid, liquid, and gaseous states. Water as an
example, has the following specific heat at
different phases:
Specific Learning Outcomes
HEAT CHANGE WITH CHANGE IN
TEMPERATURE
Phase Diagrams
Specific Learning Outcomes
Phase Diagram
• a graphical representation of the
physical states of a substance
under different conditions of
temperature and pressure.
• It gives the possible combinations
of pressure and temperature at
which certain physical state or
states a substance would be
observed. Each substance has its
own phase diagram.
Specific Learning Outcomes
What are the features of a phase diagram?
• The three areas are marked
solid, liquid, and vapor.
Under a set of conditions in
the diagram, a substance
can exist in a solid, liquid, or
vapor (gas) phase. The
labels on the graph
represent the stable states
of a system in equilibrium.
The Three Areas
Specific Learning Outcomes
What are the features of a phase diagram?
• The lines that serve as
boundaries between
physical states represent the
combinations of pressures
and temperatures at which
two phases can exist in
equilibrium. In other words,
these lines define phase
change points.
Three Lines (Curves)
Specific Learning Outcomes
What are the features of a phase diagram?
• The green line divides the
solid and liquid phases,
and represents melting
(solid to liquid) and
freezing (liquid to solid)
points.
Three Lines (Curves)
Specific Learning Outcomes
What are the features of a phase diagram?
• Melting (or freezing) curve –
the curve on a phase diagram
which represents the transition
between liquid and solid states. It
shows the effect of pressure on
the melting point of the solid.
• Anywhere on this line, there is
equilibrium between the solid
and the liquid.
Three Lines (Curves)
Specific Learning Outcomes
What are the features of a phase diagram?
• The blue line divides the
liquid and gas phases, and
represents vaporization
(liquid to gas) and
condensation (gas to
liquid) points.
Three Lines (Curves)
Specific Learning Outcomes
What are the features of a phase diagram?
• Vaporization (or condensation)
curve – the curve on a phase
diagram which represents the
transition between gaseous and
liquid states. It shows the effect of
pressure on the boiling point of the
liquid.
• Anywhere along this line, there will
be equilibrium between the liquid
and the vapor.
Three Lines (Curves)
Specific Learning Outcomes
What are the features of a phase diagram?
• The red line divides the solid
and gas phases, and
represents sublimation (solid
to gas) and deposition (gas to
solid) points.
Three Lines (Curves)
Specific Learning Outcomes
What are the features of a phase diagram?
• Sublimation (or deposition)
curve – the curve on a phase
diagram which represents the
transition between gaseous
and solid states.
• It represents the effect of
increased temperature on a
solid at a very low constant
pressure, lower than the triple
point.
Three Lines (Curves)
Specific Learning Outcomes
What are the features of a phase diagram?
• There are two important
points on the diagram,
the triple point and the
critical point.
Two Important Points
Specific Learning Outcomes
What are the features of a phase diagram?
• The triple point is the combination of
pressure and temperature at which all
three phases of matter are at equilibrium.
• It is the point on a phase diagram at which
the three states of matter coexist. The
lines that represent the conditions of solid-
liquid, liquid-vapor, and solid-vapor
equilibrium meet at the triple point
Two Important Points
Specific Learning Outcomes
The Phase Diagram for Water
• The critical point terminates the liquid/gas phase
line.
• It is the set of temperature and pressure on a
phase diagram where the liquid and gaseous
phases of a substance merge together into a single
phase.
• Beyond the temperature of the critical point, the
merged single phase is known as a supercritical
fluid. The temperature and pressure corresponding
to this are known as the critical temperature and
critical pressure.
Two Important Points
PRACTICE: Interpreting a Phase Diagram
Refer to the following phase diagram
of a certain substance to answer the
following questions.
1. In what phase is the substance at
50 °C and 1 atm pressure?
2. At what pressure and temperature
conditions will all three phases of
the substance be present?
3. What is the normal melting point of
the substance?
4. What phase(s) will exist at 1 atm
and 700C?
EVALUATION: Constructing a Phase
Diagram
Visualize a substance with the following points on the phase
diagram: a triple point at 0.05 atm and 150 K; a normal melting point at
175 K; a normal boiling point at 350 K; and a critical point at 2.0 atm and
450 K. The solid liquid line is “normal” (meaning positive sloping). For
this, complete the following:
1. Roughly sketch the phase diagram, using units of atmosphere and
Kelvin. Label the area 1, 2, and 3, and points T and C on the
diagram.
2. Describe what one would see at pressures and temperatures above
2.0 atm and 450 K.
3. Describe the phase changes from 50 K to 250 K at 1.5 atm.
4. What exists in a system that is at 1 atm and 350 K?
5. What exists in a system that is at 1 atm and 175 K?
Answer to activity 1
Guide Questions
1. B 2. B 3. a or b

Phase-Changes Gen. CHemistry Grade12 lesson

  • 3.
    ACTIVITY 1 PhaseChanges Guide Questions: 1. Take a look at the graph closely, the graph shows A. chemical changes B. phase changes C. energy changes D. temperature changes For what reason do you say so? _____________ 2. The temperature at which a substance changes from a gas to a liquid is called the __________. A. freezing point B. condensation point C. melting point D. vaporization point 3. At a temperature of 00C, water begins to _______________. A. freezes B. melts C. turns to gas D. none of these
  • 4.
    Intermolecular Forces ofLiquids and Solids; Phase Changes
  • 5.
    Specific Learning Outcomes SpecificLearning Outcomes Learning Competencies 1. Describe the nature of the following phase changes in terms of energy change and the increase or decrease in molecular order: solid-liquid, liquid vapor, and solid- vapor (STEM_GC11IMF-IIIa-c-106) 2. Interpret the phase diagram of water and carbon dioxide. (STEM_GC11IMF-IIIa-c- 107) Specific Objectives: 1. explain phase changes 2. describe how changes in temperature and pressure can change the state of matter; 3. describe the components/ features of a phase diagram; 4. analyze and interpret the phase diagram of water and carbon dioxide;
  • 6.
    Specific Learning Outcomes SpecificLearning Outcomes Phase changes • are transformations of matter from one physical state to another. They occur when energy (usually in the form of heat) is added or removed from a substance. • They are characterized by changes in molecular order; molecules in the solid phase have the greatest order, while those in the gas phase have the greatest randomness or disorder.
  • 7.
    Specific Learning Outcomes SpecificLearning Outcomes Types of phase changes •The change from solid to liquid is melting, liquid to gas is vaporization, and solid to gas is sublimation. •These changes take place when heat is absorbed (heat gained). •They are endothermic processes.
  • 8.
    Specific Learning Outcomes SpecificLearning Outcomes Types of phase changes •The reverse change from gas to liquid is condensation, gas to solid is deposition, and liquid to solid is freezing. •These changes give off heat (heat lost) and are exothermic processes
  • 9.
    During phase changes,two physical states of the substance exist at the same time. When addition or removal of heat is stopped at this temperature, the two physical states will interconvert from one state to the other, and will be at equilibrium. 1. SOLID- LIQUID EQUILIBRIUM  MELTING AND FREEZING 2. LIQUID-VAPOR EQUILIBRIUM  BOILING AND CONDENSING 3. SOLID-VAPOR EQUILIBRIUM  SUBLIMATION AND DEPOSITION:
  • 10.
    Specific Learning Outcomes SpecificLearning Outcomes How does a change in energy affect phase changes? • When a substance is heated, the added energy is used by the substance in either of two ways: a. The added heat increases the kinetic energy of the particles and the particles move faster. The increase in kinetic energy is accompanied by an increase in temperature. b. The added heat is used to break attractive forces between particles. There is no observed increase in temperature when this happens. Often a change in the physical appearance of the substance is observed, such as a phase change.
  • 12.
    Specific Learning Outcomes SpecificLearning Outcomes How does a change in energy affect phase changes? • Conversely, the removal or release of heat results in two ways: a. A decrease in kinetic energy of the particles. The motion of the particles slow down. A decrease in temperature is observed. b. Forces of attraction are formed, and a phase change may occur. No change in temperature is observed.
  • 14.
    Specific Learning Outcomes SpecificLearning Outcomes HEAT CHANGE WITH CHANGE IN TEMPERATURE •When a system contains only one phase (solid, liquid, or gas), the temperature will change when it receives energy during heating or when energy is removed during cooling. •The amount of heat received or removed from the sample to effect a given change in temperature can be calculated using the specific heat of the substance.
  • 15.
    Specific Learning Outcomes SpecificLearning Outcomes HEAT CHANGE WITH CHANGE IN TEMPERATURE •This is the amount of heat needed to raise the temperature of 1 gram of a substance by 1OC. •It is also equal to the amount of heat lost by 1 gram of substance when its temperature drops by 1oC. SPECIFIC HEAT CAPACITY
  • 16.
    Specific Learning Outcomes SpecificLearning Outcomes HEAT CHANGE WITH CHANGE IN TEMPERATURE •The specific heat of a substance differs for the solid, liquid, and gaseous states. Water as an example, has the following specific heat at different phases:
  • 17.
    Specific Learning Outcomes SpecificLearning Outcomes HEAT CHANGE WITH CHANGE IN TEMPERATURE
  • 18.
  • 19.
    Specific Learning Outcomes SpecificLearning Outcomes Phase Diagram • a graphical representation of the physical states of a substance under different conditions of temperature and pressure. • It gives the possible combinations of pressure and temperature at which certain physical state or states a substance would be observed. Each substance has its own phase diagram.
  • 20.
    Specific Learning Outcomes SpecificLearning Outcomes What are the features of a phase diagram? • The three areas are marked solid, liquid, and vapor. Under a set of conditions in the diagram, a substance can exist in a solid, liquid, or vapor (gas) phase. The labels on the graph represent the stable states of a system in equilibrium. The Three Areas
  • 21.
    Specific Learning Outcomes SpecificLearning Outcomes What are the features of a phase diagram? • The lines that serve as boundaries between physical states represent the combinations of pressures and temperatures at which two phases can exist in equilibrium. In other words, these lines define phase change points. Three Lines (Curves)
  • 22.
    Specific Learning Outcomes SpecificLearning Outcomes What are the features of a phase diagram? • The green line divides the solid and liquid phases, and represents melting (solid to liquid) and freezing (liquid to solid) points. Three Lines (Curves)
  • 23.
    Specific Learning Outcomes SpecificLearning Outcomes What are the features of a phase diagram? • Melting (or freezing) curve – the curve on a phase diagram which represents the transition between liquid and solid states. It shows the effect of pressure on the melting point of the solid. • Anywhere on this line, there is equilibrium between the solid and the liquid. Three Lines (Curves)
  • 24.
    Specific Learning Outcomes SpecificLearning Outcomes What are the features of a phase diagram? • The blue line divides the liquid and gas phases, and represents vaporization (liquid to gas) and condensation (gas to liquid) points. Three Lines (Curves)
  • 25.
    Specific Learning Outcomes SpecificLearning Outcomes What are the features of a phase diagram? • Vaporization (or condensation) curve – the curve on a phase diagram which represents the transition between gaseous and liquid states. It shows the effect of pressure on the boiling point of the liquid. • Anywhere along this line, there will be equilibrium between the liquid and the vapor. Three Lines (Curves)
  • 26.
    Specific Learning Outcomes SpecificLearning Outcomes What are the features of a phase diagram? • The red line divides the solid and gas phases, and represents sublimation (solid to gas) and deposition (gas to solid) points. Three Lines (Curves)
  • 27.
    Specific Learning Outcomes SpecificLearning Outcomes What are the features of a phase diagram? • Sublimation (or deposition) curve – the curve on a phase diagram which represents the transition between gaseous and solid states. • It represents the effect of increased temperature on a solid at a very low constant pressure, lower than the triple point. Three Lines (Curves)
  • 28.
    Specific Learning Outcomes SpecificLearning Outcomes What are the features of a phase diagram? • There are two important points on the diagram, the triple point and the critical point. Two Important Points
  • 29.
    Specific Learning Outcomes SpecificLearning Outcomes What are the features of a phase diagram? • The triple point is the combination of pressure and temperature at which all three phases of matter are at equilibrium. • It is the point on a phase diagram at which the three states of matter coexist. The lines that represent the conditions of solid- liquid, liquid-vapor, and solid-vapor equilibrium meet at the triple point Two Important Points
  • 30.
    Specific Learning Outcomes SpecificLearning Outcomes The Phase Diagram for Water • The critical point terminates the liquid/gas phase line. • It is the set of temperature and pressure on a phase diagram where the liquid and gaseous phases of a substance merge together into a single phase. • Beyond the temperature of the critical point, the merged single phase is known as a supercritical fluid. The temperature and pressure corresponding to this are known as the critical temperature and critical pressure. Two Important Points
  • 31.
    PRACTICE: Interpreting aPhase Diagram Refer to the following phase diagram of a certain substance to answer the following questions. 1. In what phase is the substance at 50 °C and 1 atm pressure? 2. At what pressure and temperature conditions will all three phases of the substance be present? 3. What is the normal melting point of the substance? 4. What phase(s) will exist at 1 atm and 700C?
  • 32.
    EVALUATION: Constructing aPhase Diagram Visualize a substance with the following points on the phase diagram: a triple point at 0.05 atm and 150 K; a normal melting point at 175 K; a normal boiling point at 350 K; and a critical point at 2.0 atm and 450 K. The solid liquid line is “normal” (meaning positive sloping). For this, complete the following: 1. Roughly sketch the phase diagram, using units of atmosphere and Kelvin. Label the area 1, 2, and 3, and points T and C on the diagram. 2. Describe what one would see at pressures and temperatures above 2.0 atm and 450 K. 3. Describe the phase changes from 50 K to 250 K at 1.5 atm. 4. What exists in a system that is at 1 atm and 350 K? 5. What exists in a system that is at 1 atm and 175 K?
  • 33.
    Answer to activity1 Guide Questions 1. B 2. B 3. a or b

Editor's Notes

  • #32 liquid ≈ 0.5 atm and ≈28 °C ≈ 32 °C liquid and vapor (gas
  • #33 liquid ≈ 0.5 atm and ≈28 °C ≈ 32 °C liquid and vapor (gas