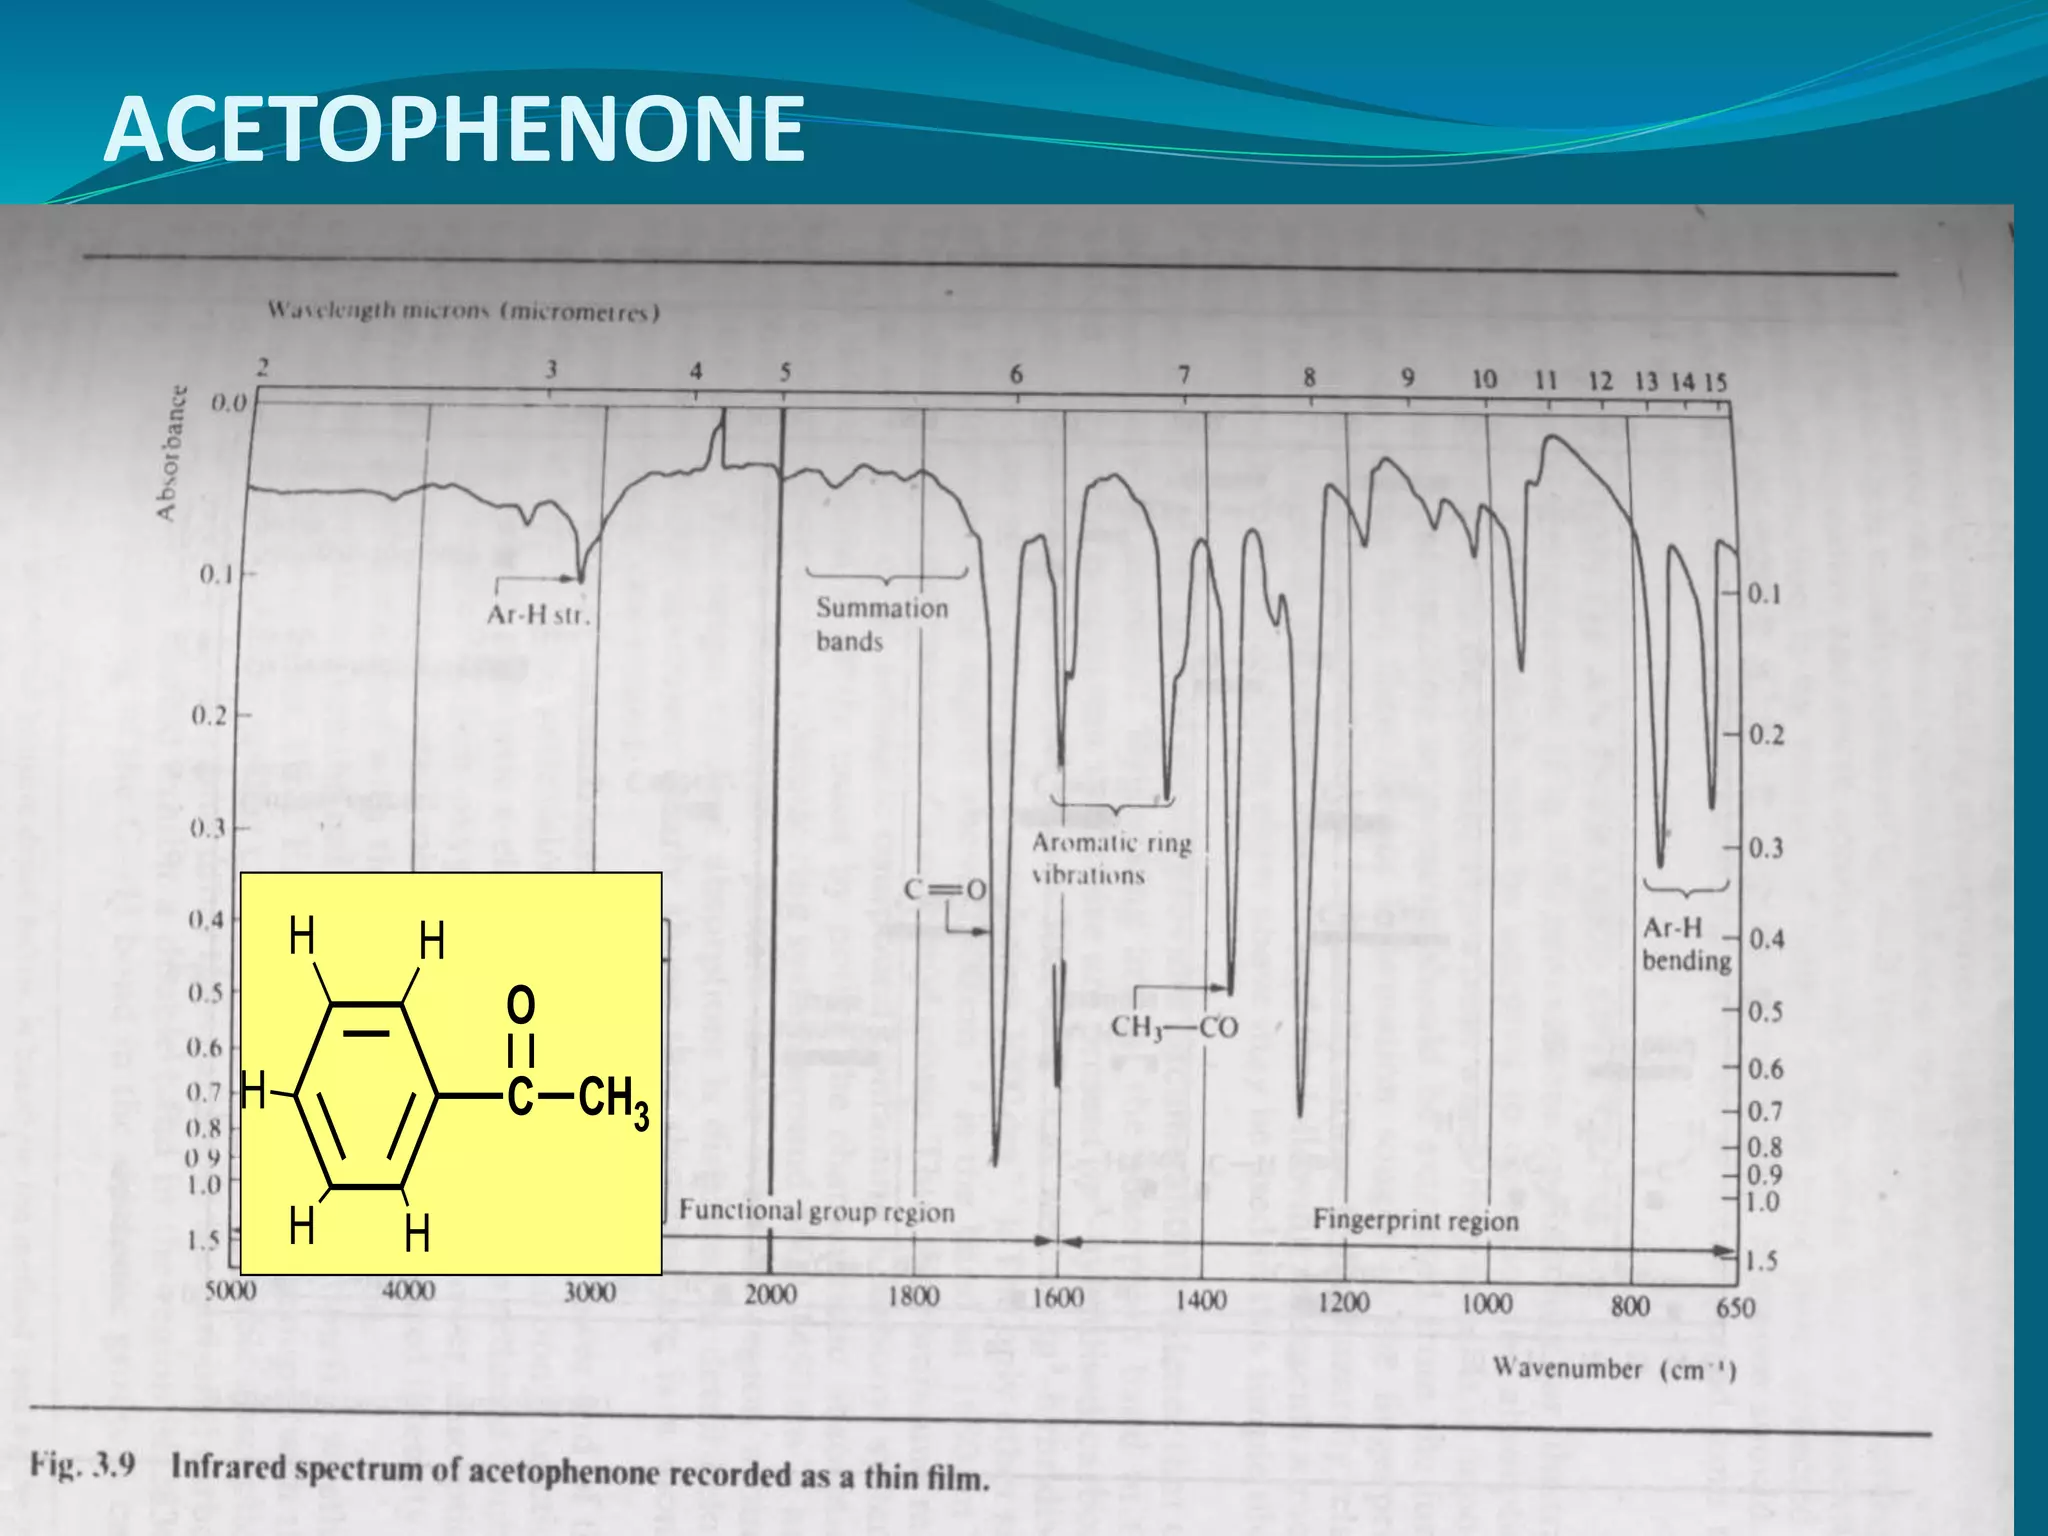
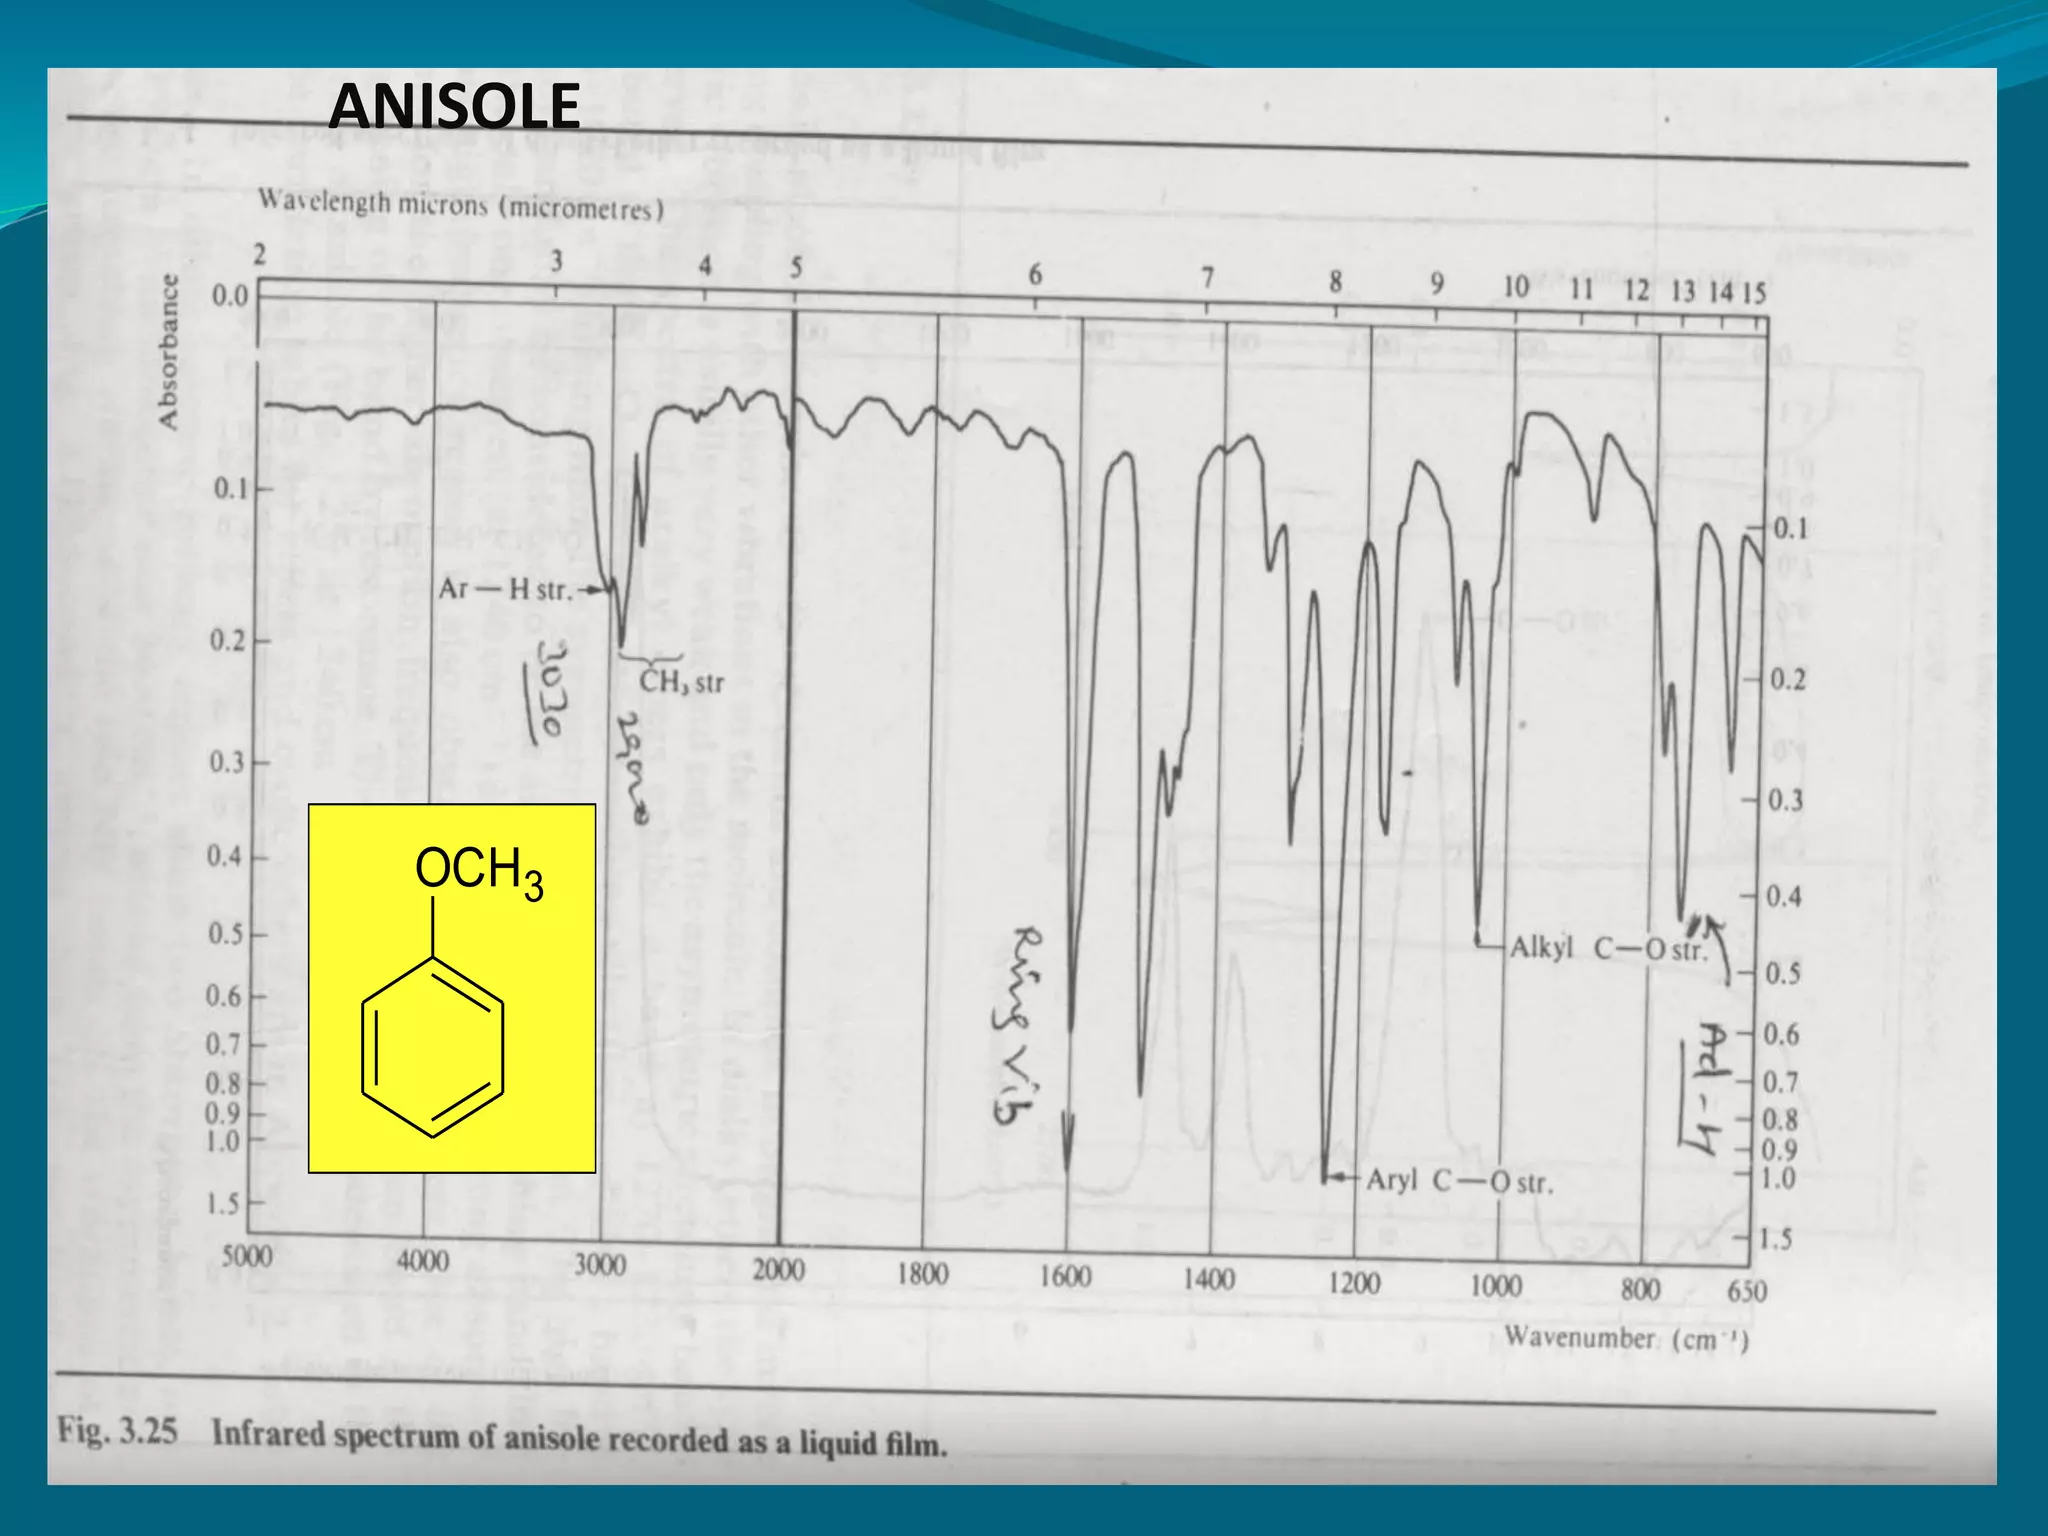
1
APPLICATION OF INFRA RED
SPECTOSCOPY IN RESEARCH
Vijay Kumar Bansal
Associate prof.
Dept. of Pharmaceutical Chemistry
LACHOO MEMORIAL COLLEGE OF SCIENCE AND TECHNOLOGY, PHARMACY
WING, JODHPUR
OBJECTIVES
 Introduction of electromagnetic spectrum and
Infra red spectrum
 The principles of infrared spectroscopy
 Factors that determine the positions and
intensities of bands in infrared spectra.
 Interpretation of infrared spectra.
 Practical aspect of IR spectroscopy
 Major areas of applications
Electromagnetic Waves
Molecules absorbs IR radiations and vibrate
The principles of infrared spectroscopy
What is spectroscopy:
 Infrared energy is absorbed as vibrations of polar
molecules when sample is placed in IR beam
 Only vibrations that cause a change in dipole
moment give rise to bands in IR spectra
 The patterns of absorption (wavelengths absorbed
and to what extent) are called ‘spectra’.
 The field of spectroscopy is concerned with the
interpretation of spectra in terms of atomic and
molecular structure (and environment).
Regions of spectrum
1. CGF region : 4000-1000 cm-1
(Characteristic Group Frequency)
2. Fingerprint region: ~1000-400 cm-1
Vibrations
Stretching
frequency
Bending
frequency
•Stretching frequencies are higher than bending frequencies
(it is easier to bend a bond than stretching or compresing them)
•Bond involving Hydrogen are higher in freq. than with heavier atoms
•Triple bond have higher freq than double bond which has higher freq than single bond
IR is used to tell:
1. what type of bonds are present
2. some structural information like functional groups
1. POSITION 2. STRENGTH 3. WIDTH
Three things are there related to bands in a IR graph
IR OF H2O
Principal that govern the vibrational
frequencies of bonds
Hooke’s law :
n
= 1
2pc
 K
m
n : Frequency in cm-1
c : Velocity of light => 3 * 1010 cm/s
K : Force constant => dynes /cm (Bond Srength)
m : Reduced mass of atoms in grams
m =
m1 m2
m1 + m2
m1 = mass of the atom 1
m2 = mass of the atom 2
Band Property
POSITION REDUCED MASS
BOND STRENGTH
(STIFFNESS)
LIGHT ATOMS
HIGH FREQUENCY
STRONG BONDS
HIGH FREQUENCY
STRENGTH
(INTENSITY)
CHANGE IN
‘POLARITY’
STRONGLY POLAR
BONDS GIVE
INTENSE BANDS
WIDTH HYDROGEN
BONDING
STRONG
HYDROGEN
BONDING GIVES
BROAD BANDS
Factor affecting Effect
Other factors that determine the
positions, intensities and shape of
bands in infrared spectra
 Coupled vibrations
 Inductive effect = +I and–I effect
 Mesomeric effect
 Field effect or Steric effect
 Hydrogen bonding
INTERPRETATION OF INFRARED SPECTRA.
Width of bands gives information
H-
bonded
OH
n(NH3
+)
C
H3
CH3
OH
COOH
Cl
Cl
Cl
H
3
C
H3
CH2
CH2
NH
Weak IR intensity of CC
ClCH2CCH
Intensity of bands gives information
-CC-
C-H
Strong intensity
1. Most organic compounds are composed of C, H, O and N.
2. Most chemical groups have specific absorption with 4000
– 670 cm-1 . This region can be divided into 7 regions as:
No. Wavenumber Bond and vibration
1 3750 ~ 3300 νO-H, νN-H
2 3300 ~ 3000 νC-H (-C≡C-H, >C=C-H, Ar-H)
3000 ~ 2700 νC-H(CH3, CH2, CH, CHO)
3 2400 ~ 2100 νC ≡C, νC ≡N
4 1900 ~ 1650 νC=O
5 1675 ~ 1500 νC=C, νC=N
6 1475 ~ 1000 δCH, ν C-O, ν C-C
7 1000 ~ 650 γC=C-H, Ar-H, γ CH2
The 7 important region of IR spectra
INTERPRETATION OF AROMATIC COMPOUNDS
S.N. Frequencies cm-1 Interpretation
1. 3050-3000 =C-H Str.
2. 1600-1400 C=C Str.
Ring vibrations
3. 900-700 C-H bending
4. 2000-1600 (very weak) summation bands Due to coupling vibratoins
and overtone of C-H wagginng
Identification of ortho, para and meta substitution
4. 770-730 & 710-690 Two bands due to 5H
5. 770-735 Single band due to 4H
6. 900-860 & 810-750 Two Bands due to 1H & 3 H
7. 860-800 Single band due to 4 H
Monosubstitution
meta substitution
ortho substitution
para substitution
ACETOPHENONE
C
O
CH3
H
H
H
H H
OCH3
ANISOLE
Aomatic aldehyde: 4-Methoxy Benzaldehyde
C
OCH3
O
H
Benzamide
C
O
N
H2
m Cresol
OH
CH3
Phenyl aceteylene
C
CH
Spurious bands in IR spectra
Freq. (cm-1) Comment
3710 Sharp H2O peak from trace solvent.
3450-3330 Occluded H2O in sample or from KBr (also at 1640).
2920 Nujol C-H band (also 1375, 1460)
2350 Atmospheric CO2 (also at 667)
2000-1450 Atmospheric H2O vapour.
1750-1690 C=O from dissolved coating or liner.
1355 NO3 impurity in KBr (also at 823).
980 SO4 from K2SO4, maybe SO4 exchange with KBr.
795/780 CCl4 vapour/liquid from solvent.
770 CHCl3 solvent.
PRACTICAL ASPECT OF IR SPECTRA
1.Only 1-2 mg of sample is required with 50-
100 mg of dry KBr powder.
2. KBr and sample must be anhydrous and
dried before taking IR spectrum.
3.Compound must be pure and single entity
for interpretation of IR spectrum.
.
So Taking IR spectrum of crude plant extract
and mixture of componds is quite useless
Warning: Don’t try to over interpret your IR spectrum. Often, it is not possible to arrive at a unique structure based
on IR analysis only. One should use other physical data such as mp, bp, solubility and other spectroscopy such as NMR
and Mass.
APPLICATION OF IR SPECTROSCOPY
1. For structural elucidation of NCEs (new
chemical entities)
2. Screening for Counterfeit Drugs
3. Organic compounds identification
4. Identification and quantification of organic
solid, liquid or gas samples.
5. Analysis of powders, solids, gels, emulsions,
pastes, pure liquids and solutions, polymers,
pure and mixed gases.
6. Samples range in size from single fibers only
20 microns in length to atmospheric pollution
studies involving large areas.
So IR is a usefull tool For research, methods development,
quality control and quality assurance applications.
Pharmaceutical research
Forensic investigations
Polymer analysis
Lubricant formulation and fuel additives
Foods research
Quality assurance and control
Environmental and water quality analysis
methods
Biochemical and biomedical research
Coatings and surfactants
FIELDS OF IR APPLICATION
THANKS

ir spectroscopy.ppt

  • 1.
    1 APPLICATION OF INFRARED SPECTOSCOPY IN RESEARCH Vijay Kumar Bansal Associate prof. Dept. of Pharmaceutical Chemistry LACHOO MEMORIAL COLLEGE OF SCIENCE AND TECHNOLOGY, PHARMACY WING, JODHPUR
  • 2.
    OBJECTIVES  Introduction ofelectromagnetic spectrum and Infra red spectrum  The principles of infrared spectroscopy  Factors that determine the positions and intensities of bands in infrared spectra.  Interpretation of infrared spectra.  Practical aspect of IR spectroscopy  Major areas of applications
  • 3.
    Electromagnetic Waves Molecules absorbsIR radiations and vibrate
  • 4.
    The principles ofinfrared spectroscopy What is spectroscopy:  Infrared energy is absorbed as vibrations of polar molecules when sample is placed in IR beam  Only vibrations that cause a change in dipole moment give rise to bands in IR spectra  The patterns of absorption (wavelengths absorbed and to what extent) are called ‘spectra’.  The field of spectroscopy is concerned with the interpretation of spectra in terms of atomic and molecular structure (and environment).
  • 5.
    Regions of spectrum 1.CGF region : 4000-1000 cm-1 (Characteristic Group Frequency) 2. Fingerprint region: ~1000-400 cm-1
  • 6.
    Vibrations Stretching frequency Bending frequency •Stretching frequencies arehigher than bending frequencies (it is easier to bend a bond than stretching or compresing them) •Bond involving Hydrogen are higher in freq. than with heavier atoms •Triple bond have higher freq than double bond which has higher freq than single bond
  • 7.
    IR is usedto tell: 1. what type of bonds are present 2. some structural information like functional groups 1. POSITION 2. STRENGTH 3. WIDTH Three things are there related to bands in a IR graph
  • 8.
  • 9.
    Principal that governthe vibrational frequencies of bonds Hooke’s law : n = 1 2pc  K m n : Frequency in cm-1 c : Velocity of light => 3 * 1010 cm/s K : Force constant => dynes /cm (Bond Srength) m : Reduced mass of atoms in grams m = m1 m2 m1 + m2 m1 = mass of the atom 1 m2 = mass of the atom 2
  • 10.
    Band Property POSITION REDUCEDMASS BOND STRENGTH (STIFFNESS) LIGHT ATOMS HIGH FREQUENCY STRONG BONDS HIGH FREQUENCY STRENGTH (INTENSITY) CHANGE IN ‘POLARITY’ STRONGLY POLAR BONDS GIVE INTENSE BANDS WIDTH HYDROGEN BONDING STRONG HYDROGEN BONDING GIVES BROAD BANDS Factor affecting Effect
  • 11.
    Other factors thatdetermine the positions, intensities and shape of bands in infrared spectra  Coupled vibrations  Inductive effect = +I and–I effect  Mesomeric effect  Field effect or Steric effect  Hydrogen bonding
  • 12.
  • 13.
    Width of bandsgives information H- bonded OH n(NH3 +) C H3 CH3 OH COOH Cl Cl Cl H 3 C H3 CH2 CH2 NH
  • 14.
    Weak IR intensityof CC ClCH2CCH Intensity of bands gives information -CC- C-H Strong intensity
  • 15.
    1. Most organiccompounds are composed of C, H, O and N. 2. Most chemical groups have specific absorption with 4000 – 670 cm-1 . This region can be divided into 7 regions as: No. Wavenumber Bond and vibration 1 3750 ~ 3300 νO-H, νN-H 2 3300 ~ 3000 νC-H (-C≡C-H, >C=C-H, Ar-H) 3000 ~ 2700 νC-H(CH3, CH2, CH, CHO) 3 2400 ~ 2100 νC ≡C, νC ≡N 4 1900 ~ 1650 νC=O 5 1675 ~ 1500 νC=C, νC=N 6 1475 ~ 1000 δCH, ν C-O, ν C-C 7 1000 ~ 650 γC=C-H, Ar-H, γ CH2 The 7 important region of IR spectra
  • 16.
    INTERPRETATION OF AROMATICCOMPOUNDS S.N. Frequencies cm-1 Interpretation 1. 3050-3000 =C-H Str. 2. 1600-1400 C=C Str. Ring vibrations 3. 900-700 C-H bending 4. 2000-1600 (very weak) summation bands Due to coupling vibratoins and overtone of C-H wagginng Identification of ortho, para and meta substitution 4. 770-730 & 710-690 Two bands due to 5H 5. 770-735 Single band due to 4H 6. 900-860 & 810-750 Two Bands due to 1H & 3 H 7. 860-800 Single band due to 4 H Monosubstitution meta substitution ortho substitution para substitution
  • 17.
  • 18.
  • 19.
    Aomatic aldehyde: 4-MethoxyBenzaldehyde C OCH3 O H
  • 20.
  • 21.
  • 22.
  • 23.
    Spurious bands inIR spectra Freq. (cm-1) Comment 3710 Sharp H2O peak from trace solvent. 3450-3330 Occluded H2O in sample or from KBr (also at 1640). 2920 Nujol C-H band (also 1375, 1460) 2350 Atmospheric CO2 (also at 667) 2000-1450 Atmospheric H2O vapour. 1750-1690 C=O from dissolved coating or liner. 1355 NO3 impurity in KBr (also at 823). 980 SO4 from K2SO4, maybe SO4 exchange with KBr. 795/780 CCl4 vapour/liquid from solvent. 770 CHCl3 solvent.
  • 24.
    PRACTICAL ASPECT OFIR SPECTRA 1.Only 1-2 mg of sample is required with 50- 100 mg of dry KBr powder. 2. KBr and sample must be anhydrous and dried before taking IR spectrum. 3.Compound must be pure and single entity for interpretation of IR spectrum. . So Taking IR spectrum of crude plant extract and mixture of componds is quite useless Warning: Don’t try to over interpret your IR spectrum. Often, it is not possible to arrive at a unique structure based on IR analysis only. One should use other physical data such as mp, bp, solubility and other spectroscopy such as NMR and Mass.
  • 25.
    APPLICATION OF IRSPECTROSCOPY 1. For structural elucidation of NCEs (new chemical entities) 2. Screening for Counterfeit Drugs 3. Organic compounds identification 4. Identification and quantification of organic solid, liquid or gas samples. 5. Analysis of powders, solids, gels, emulsions, pastes, pure liquids and solutions, polymers, pure and mixed gases. 6. Samples range in size from single fibers only 20 microns in length to atmospheric pollution studies involving large areas. So IR is a usefull tool For research, methods development, quality control and quality assurance applications.
  • 26.
    Pharmaceutical research Forensic investigations Polymeranalysis Lubricant formulation and fuel additives Foods research Quality assurance and control Environmental and water quality analysis methods Biochemical and biomedical research Coatings and surfactants FIELDS OF IR APPLICATION
  • 27.