SlideShare a Scribd company logo
1 of 2
Download to read offline
© 2022 Jones Lang LaSalle IP, Inc. All rights reserved.
Pittsburgh
Last year, new leasing activity reached 1.1 million s.f. signaling a strong
return of leasing activity, but with absorption ending at -907,856 s.f., tenant
givebacks and sublease additions significantly outpaced leasing demand.
However, in Q4 2021, total net absorption was only -229,285 s.f., followed by
another -107,038 s.f. in the Q1 2022. The improving absorption figures
indicate vacancies may be slowing.
A growing number of local companies have announced return-to-office
initiatives. Reed Smith announced in February 2022 that they would return
in March, along with BNY Mellon and Buchanan Ingersoll & Rooney. The
common theme with most return-to-office announcements is that flexibility
will be given to employees to continue working remotely part-time. The
continuation of hybrid work solutions has been the primary cause for the
short-term spike in vacancy, but it has also led to higher demand in Class A
urban buildings as companies trade up for higher quality space. Over the
previous five quarters, new leasing in the suburbs totaled 483,523 s.f. while
the urban submarkets experienced 926,536 s.f. with 72.7% occurring in Class
A or Trophy buildings.
Outlook
As the region pushes forward through the pandemic and towards the next
normal, the separation of demand between Class A and Class B inventory in
Pittsburgh widens. The cost of construction has pushed new construction
asking rental rates higher, while existing older inventory competes to
capture new leasing, resulting in downward pressure on asking rates and
higher concessions. However, tenants focused on new construction have
been willing to pay higher rents and will continue to pay higher rents in the
pursuit of future-proofing their human capital. The dichotomy between the
classes has created combative rent growth and that dynamic is anticipated
to broaden. Class B leases in the CBD contain starting rents in the low $20’s
full-service gross while new construction in the urban core has asking rates
in the mid-$40’s net of electric. With three-quarters of the leasing volume
occurring in Class A and Trophy buildings, price is evidently not the main
motivating factor among Pittsburgh tenants.
Turning a corner? Negative absorption slows
while leasing activity strengthens
• Average direct asking rent regains positive momentum as newer
developments put upward pressure on pricing.
• Return-to-work announcements increase in the first quarter, with
several law firms and financial institutions returning employees to the
office in March.
• As companies began returning to the office more broadly, urban
office properties have commanded the lion’s share of demand with
65.7% of new leasing occurring within the urban core since the start of
2021.
Fundamentals Forecast
YTD net absorption -107,038 s.f. ▼
Under construction 1,149,649 s.f. ▼
Total vacancy 23.1% ▶
Sublease vacancy 1,782,063 s.f. ▶
Direct asking rent $26.45 p.s.f. ▲
Sublease asking rent $18.81 p.s.f. ▶
Concessions Rising ▲
-1
0
1
2018 2019 2020 2021 2022
Millions
Supply and demand (s.f.) Net absorption
Deliveries
0%
10%
20%
30%
2008 2010 2012 2014 2016 2018 2020 2022
Total vacancy (%)
$10
$20
$30
2008 2010 2012 2014 2016 2018 2020 2022
Average asking rent ($ p.s.f.)
Direct Sublease
For more information, contact: Tobiah Bilski | tobiah.bilski@am.jll.com
Office Insight | Q1 2022
© 2022 Jones Lang LaSalle IP, Inc. All rights reserved.
Pittsburgh
For more information, contact: Tobiah Bilski | Tobiah.Bilski@am.jll.com
Office Statistics | Q1 2022
Class
Inventory
(s.f.)
Total net
absorption
(s.f.)
YTD total net
absorption
(s.f.)
YTD total net
absorption (%
of stock)
Direct
vacancy (%)
Total
vacancy (%)
Average
direct asking
rent ($ p.s.f.)
YTD
Completions
(s.f.)
Under
Development
(s.f.)
Northern I-79 / Cranberry Totals 4,449,807 -56,193 -56,193 -1.3% 17.1% 24.4% $24.73 0 0
East Totals 3,256,850 3,230 3,230 0.1% 30.1% 30.5% $20.18 0 0
North Totals 2,884,813 16,004 16,004 0.6% 16.1% 16.7% $19.98 0 100,000
South Totals 2,451,420 -9,525 -9,525 -0.4% 13.3% 13.3% $20.58 0 0
Southpointe Totals 3,532,244 23,292 23,292 0.7% 17.2% 27.1% $21.95 0 0
West Totals 7,549,182 -21,746 -21,746 -0.3% 24.7% 26.1% $21.76 0 0
Suburban Totals 24,124,316 -44,938 -44,938 -0.2% 20.7% 24.1% $21.69 0 100,000
CBD Totals 19,117,727 -28,220 -28,220 -0.1% 18.4% 21.2% $27.86 0 458,000
Fringe Totals 8,824,279 -47,416 -47,416 -0.5% 18.2% 22.7% $29.21 0 232,000
Oakland / East End Totals 3,477,188 13,536 13,536 1.0% 26.0% 26.6% $37.50 0 359,649
Urban Totals 31,419,194 -62,100 -62,100 -0.1% 19.2% 22.3% $29.94 0 1,049,649
Pittsburgh Totals 55,543,510 -107,038 -107,038 -0.2% 19.8% 23.1% $26.45 0 1,149,649
Northern I-79 / Cranberry A 3,726,249 -32,087 -32,087 -0.9% 16.3% 24.9% $25.24 0 0
East A 1,539,784 -7,216 -7,216 -0.5% 40.7% 41.0% $21.19 0 0
North A 855,815 7,755 7,755 0.9% 16.9% 16.9% $23.85 0 100,000
South A 220,000 0 0 0.0% 11.3% 11.3% $20.00 0 0
Southpointe A 2,449,891 -11,339 -11,339 -0.5% 13.7% 27.3% $22.74 0 0
West A 4,162,490 -13,666 -13,666 -0.3% 19.6% 21.3% $23.59 0 0
Suburban A 12,954,229 -56,553 -56,553 -0.4% 19.7% 25.4% $23.28 0 100,000
CBD A 13,512,018 -34,808 -34,808 -0.3% 14.5% 17.9% $31.73 0 458,000
Fringe A 2,944,083 -40,413 -40,413 -1.4% 14.2% 20.3% $37.41 0 232,000
Oakland / East End A 2,015,559 0 0 0.0% 35.2% 35.9% $39.62 0 359,649
Urban A 18,471,660 -75,221 -75,221 -0.4% 16.7% 20.3% $34.73 0 1,049,649
Pittsburgh A 31,425,889 -131,774 -131,774 -0.4% 17.9% 22.4% $30.20 0 1,149,649
Northern I-79 / Cranberry B 723,558 -24,106 -24,106 -3.3% 21.4% 21.9% $22.58 0 0
East B 1,717,066 10,446 10,446 0.6% 20.6% 21.1% $18.36 0 0
North B 2,028,998 8,249 8,249 0.4% 15.7% 16.6% $18.24 0 0
South B 2,231,420 -9,525 -9,525 -0.4% 13.5% 13.5% $20.63 0 0
Southpointe B 1,082,353 34,631 34,631 3.2% 25.3% 26.8% $21.01 0 0
West B 3,386,692 -8,080 -8,080 -0.2% 31.0% 32.0% $20.32 0 0
Suburban B 11,170,087 11,615 11,615 0.1% 21.9% 22.7% $20.01 0 0
CBD B 5,605,709 6,588 6,588 0.1% 27.7% 29.3% $22.18 0 0
Fringe B 5,880,196 -7,003 -7,003 -0.1% 20.3% 24.0% $24.83 0 0
Oakland / East End B 1,461,629 13,536 13,536 2.4% 13.2% 13.8% $25.78 0 0
Urban B 12,947,534 13,121 13,121 0.3% 22.7% 25.1% $23.50 0 0
Pittsburgh B 24,117,621 24,736 24,736 0.2% 22.3% 24.0% $21.91 0 0

More Related Content

What's hot

JLL Cleveland Office Outlook: Q3 2017
JLL Cleveland Office Outlook: Q3 2017JLL Cleveland Office Outlook: Q3 2017
JLL Cleveland Office Outlook: Q3 2017Andrew Batson
 
JLL Detroit Office Insight & Statistics - Q1 2017
JLL Detroit Office Insight & Statistics - Q1 2017JLL Detroit Office Insight & Statistics - Q1 2017
JLL Detroit Office Insight & Statistics - Q1 2017Harrison West
 
JLL Cleveland Office Outlook: Q4 2017
JLL Cleveland Office Outlook: Q4 2017JLL Cleveland Office Outlook: Q4 2017
JLL Cleveland Office Outlook: Q4 2017Andrew Batson
 
JLL Detroit Office Insight & Statistics - Q4 2018
JLL Detroit Office Insight & Statistics - Q4 2018JLL Detroit Office Insight & Statistics - Q4 2018
JLL Detroit Office Insight & Statistics - Q4 2018Harrison West
 
JLL Pittsburgh Office Insight & Statistics - Q4 2018
JLL Pittsburgh Office Insight & Statistics - Q4 2018JLL Pittsburgh Office Insight & Statistics - Q4 2018
JLL Pittsburgh Office Insight & Statistics - Q4 2018Tobiah Bilski
 
JLL Pittsburgh Office Insight & Statistics - Q1 2020
JLL Pittsburgh Office Insight & Statistics - Q1 2020JLL Pittsburgh Office Insight & Statistics - Q1 2020
JLL Pittsburgh Office Insight & Statistics - Q1 2020Tobiah Bilski
 
JLL Detroit Office Insight & Statistics - Q3 2019
JLL Detroit Office Insight & Statistics - Q3 2019JLL Detroit Office Insight & Statistics - Q3 2019
JLL Detroit Office Insight & Statistics - Q3 2019Harrison West
 
JLL Cincinnati Office Insight & Statistics - Q2 2016
JLL Cincinnati Office Insight & Statistics - Q2 2016JLL Cincinnati Office Insight & Statistics - Q2 2016
JLL Cincinnati Office Insight & Statistics - Q2 2016Ross Bratcher
 
JLL Detroit Office Insight & Statistics - Q2 2017
JLL Detroit Office Insight & Statistics - Q2 2017JLL Detroit Office Insight & Statistics - Q2 2017
JLL Detroit Office Insight & Statistics - Q2 2017Harrison West
 
St. Louis Office Outlook Q3 2016
St. Louis Office Outlook Q3 2016St. Louis Office Outlook Q3 2016
St. Louis Office Outlook Q3 2016Blaise Tomazic
 
JLL Grand Rapids Office Insight & Statistics - Q2 2018
JLL Grand Rapids Office Insight & Statistics - Q2 2018JLL Grand Rapids Office Insight & Statistics - Q2 2018
JLL Grand Rapids Office Insight & Statistics - Q2 2018Harrison West
 
Jll cincinnati office outlook q2 2017
Jll cincinnati office outlook   q2 2017Jll cincinnati office outlook   q2 2017
Jll cincinnati office outlook q2 2017Abby Armbruster
 
JLL Grand Rapids Office Insight & Statistics - Q4 2019
JLL Grand Rapids Office Insight & Statistics - Q4 2019JLL Grand Rapids Office Insight & Statistics - Q4 2019
JLL Grand Rapids Office Insight & Statistics - Q4 2019Harrison West
 
Q4 2014 San Francisco Office Report
Q4 2014 San Francisco Office ReportQ4 2014 San Francisco Office Report
Q4 2014 San Francisco Office ReportCoy Davidson
 
JLL Grand Rapids Office Insight & Statistics - Q1 2019
JLL Grand Rapids Office Insight & Statistics - Q1 2019JLL Grand Rapids Office Insight & Statistics - Q1 2019
JLL Grand Rapids Office Insight & Statistics - Q1 2019Harrison West
 
JLL Cleveland Office Outlook: Q2 2018
JLL Cleveland Office Outlook: Q2 2018JLL Cleveland Office Outlook: Q2 2018
JLL Cleveland Office Outlook: Q2 2018Andrew Batson
 
JLL Pittsburgh Office Insight & Statistics - Q2 2020
JLL Pittsburgh Office Insight & Statistics - Q2 2020JLL Pittsburgh Office Insight & Statistics - Q2 2020
JLL Pittsburgh Office Insight & Statistics - Q2 2020Tobiah Bilski
 
JLL Cleveland Office Outlook: Q3 2018
JLL Cleveland Office Outlook: Q3 2018JLL Cleveland Office Outlook: Q3 2018
JLL Cleveland Office Outlook: Q3 2018Andrew Batson
 

What's hot (20)

JLL Cleveland Office Outlook: Q3 2017
JLL Cleveland Office Outlook: Q3 2017JLL Cleveland Office Outlook: Q3 2017
JLL Cleveland Office Outlook: Q3 2017
 
2021 Q3 Office Austin Report
2021 Q3 Office Austin Report2021 Q3 Office Austin Report
2021 Q3 Office Austin Report
 
JLL Detroit Office Insight & Statistics - Q1 2017
JLL Detroit Office Insight & Statistics - Q1 2017JLL Detroit Office Insight & Statistics - Q1 2017
JLL Detroit Office Insight & Statistics - Q1 2017
 
JLL Cleveland Office Outlook: Q4 2017
JLL Cleveland Office Outlook: Q4 2017JLL Cleveland Office Outlook: Q4 2017
JLL Cleveland Office Outlook: Q4 2017
 
JLL Detroit Office Insight & Statistics - Q4 2018
JLL Detroit Office Insight & Statistics - Q4 2018JLL Detroit Office Insight & Statistics - Q4 2018
JLL Detroit Office Insight & Statistics - Q4 2018
 
JLL Pittsburgh Office Insight & Statistics - Q4 2018
JLL Pittsburgh Office Insight & Statistics - Q4 2018JLL Pittsburgh Office Insight & Statistics - Q4 2018
JLL Pittsburgh Office Insight & Statistics - Q4 2018
 
JLL Pittsburgh Office Insight & Statistics - Q1 2020
JLL Pittsburgh Office Insight & Statistics - Q1 2020JLL Pittsburgh Office Insight & Statistics - Q1 2020
JLL Pittsburgh Office Insight & Statistics - Q1 2020
 
JLL Detroit Office Insight & Statistics - Q3 2019
JLL Detroit Office Insight & Statistics - Q3 2019JLL Detroit Office Insight & Statistics - Q3 2019
JLL Detroit Office Insight & Statistics - Q3 2019
 
JLL Cincinnati Office Insight & Statistics - Q2 2016
JLL Cincinnati Office Insight & Statistics - Q2 2016JLL Cincinnati Office Insight & Statistics - Q2 2016
JLL Cincinnati Office Insight & Statistics - Q2 2016
 
JLL Detroit Office Insight & Statistics - Q2 2017
JLL Detroit Office Insight & Statistics - Q2 2017JLL Detroit Office Insight & Statistics - Q2 2017
JLL Detroit Office Insight & Statistics - Q2 2017
 
St. Louis Office Outlook Q3 2016
St. Louis Office Outlook Q3 2016St. Louis Office Outlook Q3 2016
St. Louis Office Outlook Q3 2016
 
JLL Grand Rapids Office Insight & Statistics - Q2 2018
JLL Grand Rapids Office Insight & Statistics - Q2 2018JLL Grand Rapids Office Insight & Statistics - Q2 2018
JLL Grand Rapids Office Insight & Statistics - Q2 2018
 
Jll cincinnati office outlook q2 2017
Jll cincinnati office outlook   q2 2017Jll cincinnati office outlook   q2 2017
Jll cincinnati office outlook q2 2017
 
JLL Grand Rapids Office Insight & Statistics - Q4 2019
JLL Grand Rapids Office Insight & Statistics - Q4 2019JLL Grand Rapids Office Insight & Statistics - Q4 2019
JLL Grand Rapids Office Insight & Statistics - Q4 2019
 
Q4 2014 San Francisco Office Report
Q4 2014 San Francisco Office ReportQ4 2014 San Francisco Office Report
Q4 2014 San Francisco Office Report
 
JLL Grand Rapids Office Insight & Statistics - Q1 2019
JLL Grand Rapids Office Insight & Statistics - Q1 2019JLL Grand Rapids Office Insight & Statistics - Q1 2019
JLL Grand Rapids Office Insight & Statistics - Q1 2019
 
JLL Cleveland Office Outlook: Q2 2018
JLL Cleveland Office Outlook: Q2 2018JLL Cleveland Office Outlook: Q2 2018
JLL Cleveland Office Outlook: Q2 2018
 
JLL Pittsburgh Office Insight & Statistics - Q2 2020
JLL Pittsburgh Office Insight & Statistics - Q2 2020JLL Pittsburgh Office Insight & Statistics - Q2 2020
JLL Pittsburgh Office Insight & Statistics - Q2 2020
 
JLL Cleveland Office Outlook: Q3 2018
JLL Cleveland Office Outlook: Q3 2018JLL Cleveland Office Outlook: Q3 2018
JLL Cleveland Office Outlook: Q3 2018
 
JLL Detroit Office Insight - Q2 2015
JLL Detroit Office Insight - Q2 2015JLL Detroit Office Insight - Q2 2015
JLL Detroit Office Insight - Q2 2015
 

Similar to Pittsburgh Office Insight & Stats Q1 2022

Pittsburgh Office Insight & Stats Q4 2021
Pittsburgh Office Insight & Stats Q4 2021Pittsburgh Office Insight & Stats Q4 2021
Pittsburgh Office Insight & Stats Q4 2021Tobiah Bilski
 
JLL Cincinnati Office Outlook Q4 2020
JLL Cincinnati Office Outlook Q4 2020JLL Cincinnati Office Outlook Q4 2020
JLL Cincinnati Office Outlook Q4 2020Abby Armbruster
 
JLL Pittsburgh Office Insight & Statistics - Q3 2021
JLL Pittsburgh Office Insight & Statistics - Q3 2021JLL Pittsburgh Office Insight & Statistics - Q3 2021
JLL Pittsburgh Office Insight & Statistics - Q3 2021Tobiah Bilski
 
JLL Cincinnati Office Outlook Q2 2020
JLL Cincinnati Office Outlook Q2 2020JLL Cincinnati Office Outlook Q2 2020
JLL Cincinnati Office Outlook Q2 2020Abby Armbruster
 
Q2 2023 Pittsburgh Office Insight & Stats
Q2 2023 Pittsburgh Office Insight & StatsQ2 2023 Pittsburgh Office Insight & Stats
Q2 2023 Pittsburgh Office Insight & StatsCaitlin Fadgen
 
JLL Detroit Office Insight & Statistics - Q2 2019
JLL Detroit Office Insight & Statistics - Q2 2019JLL Detroit Office Insight & Statistics - Q2 2019
JLL Detroit Office Insight & Statistics - Q2 2019Harrison West
 
JLL Detroit Office Insight & Statistics - Q3 2018
JLL Detroit Office Insight & Statistics - Q3 2018JLL Detroit Office Insight & Statistics - Q3 2018
JLL Detroit Office Insight & Statistics - Q3 2018Harrison West
 
JLL Cleveland Office Outlook: Q1 2018
JLL Cleveland Office Outlook: Q1 2018JLL Cleveland Office Outlook: Q1 2018
JLL Cleveland Office Outlook: Q1 2018Andrew Batson
 
JLL Cleveland Office Outlook: Q1 2018
JLL Cleveland Office Outlook: Q1 2018JLL Cleveland Office Outlook: Q1 2018
JLL Cleveland Office Outlook: Q1 2018Andrew Batson
 
JLL Pittsburgh Office Insight & Statistics - Q1 2021
JLL Pittsburgh Office Insight & Statistics - Q1 2021JLL Pittsburgh Office Insight & Statistics - Q1 2021
JLL Pittsburgh Office Insight & Statistics - Q1 2021Tobiah Bilski
 
JLL Cleveland Office Outlook: Q1 2018
JLL Cleveland Office Outlook: Q1 2018JLL Cleveland Office Outlook: Q1 2018
JLL Cleveland Office Outlook: Q1 2018Andrew Batson
 
JLL Cleveland Office Outlook: Q2 2018
JLL Cleveland Office Outlook: Q2 2018JLL Cleveland Office Outlook: Q2 2018
JLL Cleveland Office Outlook: Q2 2018Andrew Batson
 
JLL Columbus Office Outlook: Q2 2016
JLL Columbus Office Outlook: Q2 2016JLL Columbus Office Outlook: Q2 2016
JLL Columbus Office Outlook: Q2 2016Peter McStravick
 
JLL Pittsburgh Office Insight & Statistics - Q4 2017
JLL Pittsburgh Office Insight & Statistics - Q4 2017JLL Pittsburgh Office Insight & Statistics - Q4 2017
JLL Pittsburgh Office Insight & Statistics - Q4 2017Tobiah Bilski
 
JLL Pittsburgh Office Insight & Statistics - Q1 2018
JLL Pittsburgh Office Insight & Statistics - Q1 2018JLL Pittsburgh Office Insight & Statistics - Q1 2018
JLL Pittsburgh Office Insight & Statistics - Q1 2018Tobiah Bilski
 
JLL Cincinnati Office Insight & Statistics - Q3 2016
JLL Cincinnati Office Insight & Statistics - Q3 2016JLL Cincinnati Office Insight & Statistics - Q3 2016
JLL Cincinnati Office Insight & Statistics - Q3 2016Ross Bratcher
 
JLL Pittsburgh Industrial Insight & Statistics - Q2 2020
JLL Pittsburgh Industrial Insight & Statistics - Q2 2020JLL Pittsburgh Industrial Insight & Statistics - Q2 2020
JLL Pittsburgh Industrial Insight & Statistics - Q2 2020Tobiah Bilski
 
St. Louis Office Outlook Q2 2016
St. Louis Office Outlook Q2 2016St. Louis Office Outlook Q2 2016
St. Louis Office Outlook Q2 2016Blaise Tomazic
 
JLL Pittsburgh Office Outlook - Q4 2015
JLL Pittsburgh Office Outlook - Q4 2015JLL Pittsburgh Office Outlook - Q4 2015
JLL Pittsburgh Office Outlook - Q4 2015Andrew Batson
 
JLL Pittsburgh Office Insight & Statistics - Q3 2018
JLL Pittsburgh Office Insight & Statistics - Q3 2018JLL Pittsburgh Office Insight & Statistics - Q3 2018
JLL Pittsburgh Office Insight & Statistics - Q3 2018Tobiah Bilski
 

Similar to Pittsburgh Office Insight & Stats Q1 2022 (20)

Pittsburgh Office Insight & Stats Q4 2021
Pittsburgh Office Insight & Stats Q4 2021Pittsburgh Office Insight & Stats Q4 2021
Pittsburgh Office Insight & Stats Q4 2021
 
JLL Cincinnati Office Outlook Q4 2020
JLL Cincinnati Office Outlook Q4 2020JLL Cincinnati Office Outlook Q4 2020
JLL Cincinnati Office Outlook Q4 2020
 
JLL Pittsburgh Office Insight & Statistics - Q3 2021
JLL Pittsburgh Office Insight & Statistics - Q3 2021JLL Pittsburgh Office Insight & Statistics - Q3 2021
JLL Pittsburgh Office Insight & Statistics - Q3 2021
 
JLL Cincinnati Office Outlook Q2 2020
JLL Cincinnati Office Outlook Q2 2020JLL Cincinnati Office Outlook Q2 2020
JLL Cincinnati Office Outlook Q2 2020
 
Q2 2023 Pittsburgh Office Insight & Stats
Q2 2023 Pittsburgh Office Insight & StatsQ2 2023 Pittsburgh Office Insight & Stats
Q2 2023 Pittsburgh Office Insight & Stats
 
JLL Detroit Office Insight & Statistics - Q2 2019
JLL Detroit Office Insight & Statistics - Q2 2019JLL Detroit Office Insight & Statistics - Q2 2019
JLL Detroit Office Insight & Statistics - Q2 2019
 
JLL Detroit Office Insight & Statistics - Q3 2018
JLL Detroit Office Insight & Statistics - Q3 2018JLL Detroit Office Insight & Statistics - Q3 2018
JLL Detroit Office Insight & Statistics - Q3 2018
 
JLL Cleveland Office Outlook: Q1 2018
JLL Cleveland Office Outlook: Q1 2018JLL Cleveland Office Outlook: Q1 2018
JLL Cleveland Office Outlook: Q1 2018
 
JLL Cleveland Office Outlook: Q1 2018
JLL Cleveland Office Outlook: Q1 2018JLL Cleveland Office Outlook: Q1 2018
JLL Cleveland Office Outlook: Q1 2018
 
JLL Pittsburgh Office Insight & Statistics - Q1 2021
JLL Pittsburgh Office Insight & Statistics - Q1 2021JLL Pittsburgh Office Insight & Statistics - Q1 2021
JLL Pittsburgh Office Insight & Statistics - Q1 2021
 
JLL Cleveland Office Outlook: Q1 2018
JLL Cleveland Office Outlook: Q1 2018JLL Cleveland Office Outlook: Q1 2018
JLL Cleveland Office Outlook: Q1 2018
 
JLL Cleveland Office Outlook: Q2 2018
JLL Cleveland Office Outlook: Q2 2018JLL Cleveland Office Outlook: Q2 2018
JLL Cleveland Office Outlook: Q2 2018
 
JLL Columbus Office Outlook: Q2 2016
JLL Columbus Office Outlook: Q2 2016JLL Columbus Office Outlook: Q2 2016
JLL Columbus Office Outlook: Q2 2016
 
JLL Pittsburgh Office Insight & Statistics - Q4 2017
JLL Pittsburgh Office Insight & Statistics - Q4 2017JLL Pittsburgh Office Insight & Statistics - Q4 2017
JLL Pittsburgh Office Insight & Statistics - Q4 2017
 
JLL Pittsburgh Office Insight & Statistics - Q1 2018
JLL Pittsburgh Office Insight & Statistics - Q1 2018JLL Pittsburgh Office Insight & Statistics - Q1 2018
JLL Pittsburgh Office Insight & Statistics - Q1 2018
 
JLL Cincinnati Office Insight & Statistics - Q3 2016
JLL Cincinnati Office Insight & Statistics - Q3 2016JLL Cincinnati Office Insight & Statistics - Q3 2016
JLL Cincinnati Office Insight & Statistics - Q3 2016
 
JLL Pittsburgh Industrial Insight & Statistics - Q2 2020
JLL Pittsburgh Industrial Insight & Statistics - Q2 2020JLL Pittsburgh Industrial Insight & Statistics - Q2 2020
JLL Pittsburgh Industrial Insight & Statistics - Q2 2020
 
St. Louis Office Outlook Q2 2016
St. Louis Office Outlook Q2 2016St. Louis Office Outlook Q2 2016
St. Louis Office Outlook Q2 2016
 
JLL Pittsburgh Office Outlook - Q4 2015
JLL Pittsburgh Office Outlook - Q4 2015JLL Pittsburgh Office Outlook - Q4 2015
JLL Pittsburgh Office Outlook - Q4 2015
 
JLL Pittsburgh Office Insight & Statistics - Q3 2018
JLL Pittsburgh Office Insight & Statistics - Q3 2018JLL Pittsburgh Office Insight & Statistics - Q3 2018
JLL Pittsburgh Office Insight & Statistics - Q3 2018
 

More from Tobiah Bilski

JLL Pittsburgh Industrial Insight & Statistics - Q4 2021
JLL Pittsburgh Industrial Insight & Statistics - Q4 2021JLL Pittsburgh Industrial Insight & Statistics - Q4 2021
JLL Pittsburgh Industrial Insight & Statistics - Q4 2021Tobiah Bilski
 
JLL Pittsburgh Industrial Insight & Statistics - Q3 2021
JLL Pittsburgh Industrial Insight & Statistics - Q3 2021JLL Pittsburgh Industrial Insight & Statistics - Q3 2021
JLL Pittsburgh Industrial Insight & Statistics - Q3 2021Tobiah Bilski
 
JLL Pittsburgh Industrial Insight & Statistics - Q2 2021
JLL Pittsburgh Industrial Insight & Statistics - Q2 2021JLL Pittsburgh Industrial Insight & Statistics - Q2 2021
JLL Pittsburgh Industrial Insight & Statistics - Q2 2021Tobiah Bilski
 
JLL Pittsburgh Industrial Insight & Statistics - Q1 2021
JLL Pittsburgh Industrial Insight & Statistics - Q1 2021JLL Pittsburgh Industrial Insight & Statistics - Q1 2021
JLL Pittsburgh Industrial Insight & Statistics - Q1 2021Tobiah Bilski
 
JLL Pittsburgh Industrial Insight & Statistics - Q4 2020
JLL Pittsburgh Industrial Insight & Statistics - Q4 2020JLL Pittsburgh Industrial Insight & Statistics - Q4 2020
JLL Pittsburgh Industrial Insight & Statistics - Q4 2020Tobiah Bilski
 
JLL Pittsburgh Industrial Insight & Statistics - Q3 2020
JLL Pittsburgh Industrial Insight & Statistics - Q3 2020JLL Pittsburgh Industrial Insight & Statistics - Q3 2020
JLL Pittsburgh Industrial Insight & Statistics - Q3 2020Tobiah Bilski
 
JLL Pittsburgh Industrial Insight & Statistics - Q1 2020
JLL Pittsburgh Industrial Insight & Statistics - Q1 2020JLL Pittsburgh Industrial Insight & Statistics - Q1 2020
JLL Pittsburgh Industrial Insight & Statistics - Q1 2020Tobiah Bilski
 
JLL Pittsburgh Office Insight & Statistics - Q4 2019
JLL Pittsburgh Office Insight & Statistics - Q4 2019JLL Pittsburgh Office Insight & Statistics - Q4 2019
JLL Pittsburgh Office Insight & Statistics - Q4 2019Tobiah Bilski
 
JLL Pittsburgh Industrial Insight & Statistics - Q4 2019
JLL Pittsburgh Industrial Insight & Statistics - Q4 2019JLL Pittsburgh Industrial Insight & Statistics - Q4 2019
JLL Pittsburgh Industrial Insight & Statistics - Q4 2019Tobiah Bilski
 
JLL Pittsburgh Industrial Insight & Statistics - Q3 2019
JLL Pittsburgh Industrial Insight & Statistics - Q3 2019JLL Pittsburgh Industrial Insight & Statistics - Q3 2019
JLL Pittsburgh Industrial Insight & Statistics - Q3 2019Tobiah Bilski
 
JLL Pittsburgh Industrial Insight & Statistics - Q2 2019
JLL Pittsburgh Industrial Insight & Statistics - Q2 2019JLL Pittsburgh Industrial Insight & Statistics - Q2 2019
JLL Pittsburgh Industrial Insight & Statistics - Q2 2019Tobiah Bilski
 
JLL Pittsburgh Office Insight & Statistics - Q2 2019
JLL Pittsburgh Office Insight & Statistics - Q2 2019JLL Pittsburgh Office Insight & Statistics - Q2 2019
JLL Pittsburgh Office Insight & Statistics - Q2 2019Tobiah Bilski
 
JLL Pittsburgh Industrial Insight & Statistics - Q1 2019
JLL Pittsburgh Industrial Insight & Statistics - Q1 2019JLL Pittsburgh Industrial Insight & Statistics - Q1 2019
JLL Pittsburgh Industrial Insight & Statistics - Q1 2019Tobiah Bilski
 
JLL Pittsburgh Office Insight & Statistics - Q1 2019
JLL Pittsburgh Office Insight & Statistics - Q1 2019JLL Pittsburgh Office Insight & Statistics - Q1 2019
JLL Pittsburgh Office Insight & Statistics - Q1 2019Tobiah Bilski
 
JLL Pittsburgh Industrial Insight & Statistics - Q4 2018
JLL Pittsburgh Industrial Insight & Statistics - Q4 2018JLL Pittsburgh Industrial Insight & Statistics - Q4 2018
JLL Pittsburgh Industrial Insight & Statistics - Q4 2018Tobiah Bilski
 
JLL Pittsburgh Industrial Insight & Statistics - Q3 2018
JLL Pittsburgh Industrial Insight & Statistics - Q3 2018JLL Pittsburgh Industrial Insight & Statistics - Q3 2018
JLL Pittsburgh Industrial Insight & Statistics - Q3 2018Tobiah Bilski
 
JLL Pittsburgh Industrial Insight & Statistics - Q2 2018
JLL Pittsburgh Industrial Insight & Statistics - Q2 2018JLL Pittsburgh Industrial Insight & Statistics - Q2 2018
JLL Pittsburgh Industrial Insight & Statistics - Q2 2018Tobiah Bilski
 
JLL Pittsburgh Office Insight & Statistics - Q2 2018
JLL Pittsburgh Office Insight & Statistics - Q2 2018 JLL Pittsburgh Office Insight & Statistics - Q2 2018
JLL Pittsburgh Office Insight & Statistics - Q2 2018 Tobiah Bilski
 
JLL Pittsburgh Industrial Insight & Statistics - Q1 2018
JLL Pittsburgh Industrial Insight & Statistics - Q1 2018JLL Pittsburgh Industrial Insight & Statistics - Q1 2018
JLL Pittsburgh Industrial Insight & Statistics - Q1 2018Tobiah Bilski
 

More from Tobiah Bilski (19)

JLL Pittsburgh Industrial Insight & Statistics - Q4 2021
JLL Pittsburgh Industrial Insight & Statistics - Q4 2021JLL Pittsburgh Industrial Insight & Statistics - Q4 2021
JLL Pittsburgh Industrial Insight & Statistics - Q4 2021
 
JLL Pittsburgh Industrial Insight & Statistics - Q3 2021
JLL Pittsburgh Industrial Insight & Statistics - Q3 2021JLL Pittsburgh Industrial Insight & Statistics - Q3 2021
JLL Pittsburgh Industrial Insight & Statistics - Q3 2021
 
JLL Pittsburgh Industrial Insight & Statistics - Q2 2021
JLL Pittsburgh Industrial Insight & Statistics - Q2 2021JLL Pittsburgh Industrial Insight & Statistics - Q2 2021
JLL Pittsburgh Industrial Insight & Statistics - Q2 2021
 
JLL Pittsburgh Industrial Insight & Statistics - Q1 2021
JLL Pittsburgh Industrial Insight & Statistics - Q1 2021JLL Pittsburgh Industrial Insight & Statistics - Q1 2021
JLL Pittsburgh Industrial Insight & Statistics - Q1 2021
 
JLL Pittsburgh Industrial Insight & Statistics - Q4 2020
JLL Pittsburgh Industrial Insight & Statistics - Q4 2020JLL Pittsburgh Industrial Insight & Statistics - Q4 2020
JLL Pittsburgh Industrial Insight & Statistics - Q4 2020
 
JLL Pittsburgh Industrial Insight & Statistics - Q3 2020
JLL Pittsburgh Industrial Insight & Statistics - Q3 2020JLL Pittsburgh Industrial Insight & Statistics - Q3 2020
JLL Pittsburgh Industrial Insight & Statistics - Q3 2020
 
JLL Pittsburgh Industrial Insight & Statistics - Q1 2020
JLL Pittsburgh Industrial Insight & Statistics - Q1 2020JLL Pittsburgh Industrial Insight & Statistics - Q1 2020
JLL Pittsburgh Industrial Insight & Statistics - Q1 2020
 
JLL Pittsburgh Office Insight & Statistics - Q4 2019
JLL Pittsburgh Office Insight & Statistics - Q4 2019JLL Pittsburgh Office Insight & Statistics - Q4 2019
JLL Pittsburgh Office Insight & Statistics - Q4 2019
 
JLL Pittsburgh Industrial Insight & Statistics - Q4 2019
JLL Pittsburgh Industrial Insight & Statistics - Q4 2019JLL Pittsburgh Industrial Insight & Statistics - Q4 2019
JLL Pittsburgh Industrial Insight & Statistics - Q4 2019
 
JLL Pittsburgh Industrial Insight & Statistics - Q3 2019
JLL Pittsburgh Industrial Insight & Statistics - Q3 2019JLL Pittsburgh Industrial Insight & Statistics - Q3 2019
JLL Pittsburgh Industrial Insight & Statistics - Q3 2019
 
JLL Pittsburgh Industrial Insight & Statistics - Q2 2019
JLL Pittsburgh Industrial Insight & Statistics - Q2 2019JLL Pittsburgh Industrial Insight & Statistics - Q2 2019
JLL Pittsburgh Industrial Insight & Statistics - Q2 2019
 
JLL Pittsburgh Office Insight & Statistics - Q2 2019
JLL Pittsburgh Office Insight & Statistics - Q2 2019JLL Pittsburgh Office Insight & Statistics - Q2 2019
JLL Pittsburgh Office Insight & Statistics - Q2 2019
 
JLL Pittsburgh Industrial Insight & Statistics - Q1 2019
JLL Pittsburgh Industrial Insight & Statistics - Q1 2019JLL Pittsburgh Industrial Insight & Statistics - Q1 2019
JLL Pittsburgh Industrial Insight & Statistics - Q1 2019
 
JLL Pittsburgh Office Insight & Statistics - Q1 2019
JLL Pittsburgh Office Insight & Statistics - Q1 2019JLL Pittsburgh Office Insight & Statistics - Q1 2019
JLL Pittsburgh Office Insight & Statistics - Q1 2019
 
JLL Pittsburgh Industrial Insight & Statistics - Q4 2018
JLL Pittsburgh Industrial Insight & Statistics - Q4 2018JLL Pittsburgh Industrial Insight & Statistics - Q4 2018
JLL Pittsburgh Industrial Insight & Statistics - Q4 2018
 
JLL Pittsburgh Industrial Insight & Statistics - Q3 2018
JLL Pittsburgh Industrial Insight & Statistics - Q3 2018JLL Pittsburgh Industrial Insight & Statistics - Q3 2018
JLL Pittsburgh Industrial Insight & Statistics - Q3 2018
 
JLL Pittsburgh Industrial Insight & Statistics - Q2 2018
JLL Pittsburgh Industrial Insight & Statistics - Q2 2018JLL Pittsburgh Industrial Insight & Statistics - Q2 2018
JLL Pittsburgh Industrial Insight & Statistics - Q2 2018
 
JLL Pittsburgh Office Insight & Statistics - Q2 2018
JLL Pittsburgh Office Insight & Statistics - Q2 2018 JLL Pittsburgh Office Insight & Statistics - Q2 2018
JLL Pittsburgh Office Insight & Statistics - Q2 2018
 
JLL Pittsburgh Industrial Insight & Statistics - Q1 2018
JLL Pittsburgh Industrial Insight & Statistics - Q1 2018JLL Pittsburgh Industrial Insight & Statistics - Q1 2018
JLL Pittsburgh Industrial Insight & Statistics - Q1 2018
 

Recently uploaded

9990771857 Call Girls in Noida Sector 34 Noida (Call Girls) Delhi
9990771857 Call Girls in Noida Sector 34 Noida (Call Girls) Delhi9990771857 Call Girls in Noida Sector 34 Noida (Call Girls) Delhi
9990771857 Call Girls in Noida Sector 34 Noida (Call Girls) Delhidelhimodel235
 
9990771857 Call Girls in Noida Sector 11 Noida (Call Girls) Delhi
9990771857 Call Girls in Noida Sector 11 Noida (Call Girls) Delhi9990771857 Call Girls in Noida Sector 11 Noida (Call Girls) Delhi
9990771857 Call Girls in Noida Sector 11 Noida (Call Girls) Delhidelhimodel235
 
Omaxe Dwarka In Delhi E Brochure Pdf
Omaxe Dwarka In Delhi E Brochure     PdfOmaxe Dwarka In Delhi E Brochure     Pdf
Omaxe Dwarka In Delhi E Brochure Pdfashiyadav24
 
Low Rate Call Girls in Triveni Complex Delhi Call 9990771857
Low Rate Call Girls in Triveni Complex Delhi Call 9990771857Low Rate Call Girls in Triveni Complex Delhi Call 9990771857
Low Rate Call Girls in Triveni Complex Delhi Call 9990771857delhimodel235
 
Listing Turkey Sylvana Istanbul - Bahcesehir
Listing Turkey Sylvana Istanbul - BahcesehirListing Turkey Sylvana Istanbul - Bahcesehir
Listing Turkey Sylvana Istanbul - BahcesehirListing Turkey
 
Nanke Area Estate commercial ( Dir. Kat Kuo)
Nanke Area Estate commercial ( Dir. Kat Kuo)Nanke Area Estate commercial ( Dir. Kat Kuo)
Nanke Area Estate commercial ( Dir. Kat Kuo)jessica288382
 
Call Girls in Khan Market 9654467111 ESCORTS SERVICE
Call Girls in Khan Market 9654467111 ESCORTS SERVICECall Girls in Khan Market 9654467111 ESCORTS SERVICE
Call Girls in Khan Market 9654467111 ESCORTS SERVICESapana Sha
 
9990771857 Call Girls in Noida Sector 10 Noida (Call Girls) Delhi
9990771857 Call Girls in Noida Sector 10 Noida (Call Girls) Delhi9990771857 Call Girls in Noida Sector 10 Noida (Call Girls) Delhi
9990771857 Call Girls in Noida Sector 10 Noida (Call Girls) Delhidelhimodel235
 
Call Girls in Pitampura Delhi 💯Call Us 🔝8264348440🔝
Call Girls in Pitampura Delhi 💯Call Us 🔝8264348440🔝Call Girls in Pitampura Delhi 💯Call Us 🔝8264348440🔝
Call Girls in Pitampura Delhi 💯Call Us 🔝8264348440🔝soniya singh
 
Call Girls In Madipur Metro Delhi꧁ +91)8447779280꧂Low Rate 2 short 2000 full ...
Call Girls In Madipur Metro Delhi꧁ +91)8447779280꧂Low Rate 2 short 2000 full ...Call Girls In Madipur Metro Delhi꧁ +91)8447779280꧂Low Rate 2 short 2000 full ...
Call Girls In Madipur Metro Delhi꧁ +91)8447779280꧂Low Rate 2 short 2000 full ...asmaqueen5
 
Call Girls in Sarai Kale Khan Delhi 💯Call Us 🔝8264348440🔝
Call Girls in Sarai Kale Khan Delhi 💯Call Us 🔝8264348440🔝Call Girls in Sarai Kale Khan Delhi 💯Call Us 🔝8264348440🔝
Call Girls in Sarai Kale Khan Delhi 💯Call Us 🔝8264348440🔝soniya singh
 
Building Dreams: Newman Leech's Visionary Approach to Real Estate Investment
Building Dreams: Newman Leech's Visionary Approach to Real Estate InvestmentBuilding Dreams: Newman Leech's Visionary Approach to Real Estate Investment
Building Dreams: Newman Leech's Visionary Approach to Real Estate InvestmentNewman George Leech
 
Puravankara Mundhwa Pune E-Brochure.pdf
Puravankara Mundhwa Pune  E-Brochure.pdfPuravankara Mundhwa Pune  E-Brochure.pdf
Puravankara Mundhwa Pune E-Brochure.pdfManishSaxena95
 
Call Girls In Mundka Industrial Metro@꧂8447779280 ↬Enjoy ꧂Escort Service in ...
Call Girls In Mundka Industrial Metro@꧂8447779280 ↬Enjoy ꧂Escort Service in  ...Call Girls In Mundka Industrial Metro@꧂8447779280 ↬Enjoy ꧂Escort Service in  ...
Call Girls In Mundka Industrial Metro@꧂8447779280 ↬Enjoy ꧂Escort Service in ...asmaqueen5
 
9990771857 Call Girls in Noida Sector 03 Noida (Call Girls) Delhi
9990771857 Call Girls in Noida Sector 03 Noida (Call Girls) Delhi9990771857 Call Girls in Noida Sector 03 Noida (Call Girls) Delhi
9990771857 Call Girls in Noida Sector 03 Noida (Call Girls) Delhidelhimodel235
 
Shapoorji Pallonji Parkwest Sequoia Tower Bangalore.pdf
Shapoorji Pallonji Parkwest Sequoia Tower Bangalore.pdfShapoorji Pallonji Parkwest Sequoia Tower Bangalore.pdf
Shapoorji Pallonji Parkwest Sequoia Tower Bangalore.pdfashiyadav24
 
)_Call Girls In Radisson Blu Plaza Hotel, Delhi Airport ❤️8860477959 _Indepen...
)_Call Girls In Radisson Blu Plaza Hotel, Delhi Airport ❤️8860477959 _Indepen...)_Call Girls In Radisson Blu Plaza Hotel, Delhi Airport ❤️8860477959 _Indepen...
)_Call Girls In Radisson Blu Plaza Hotel, Delhi Airport ❤️8860477959 _Indepen...lizamodels9
 
call girls in Shahdara (DELHI) 🔝 >༒9953330565🔝 genuine Escort Service 🔝✔️✔️
call girls in Shahdara (DELHI) 🔝 >༒9953330565🔝 genuine Escort Service 🔝✔️✔️call girls in Shahdara (DELHI) 🔝 >༒9953330565🔝 genuine Escort Service 🔝✔️✔️
call girls in Shahdara (DELHI) 🔝 >༒9953330565🔝 genuine Escort Service 🔝✔️✔️9953056974 Low Rate Call Girls In Saket, Delhi NCR
 

Recently uploaded (20)

9990771857 Call Girls in Noida Sector 34 Noida (Call Girls) Delhi
9990771857 Call Girls in Noida Sector 34 Noida (Call Girls) Delhi9990771857 Call Girls in Noida Sector 34 Noida (Call Girls) Delhi
9990771857 Call Girls in Noida Sector 34 Noida (Call Girls) Delhi
 
9990771857 Call Girls in Noida Sector 11 Noida (Call Girls) Delhi
9990771857 Call Girls in Noida Sector 11 Noida (Call Girls) Delhi9990771857 Call Girls in Noida Sector 11 Noida (Call Girls) Delhi
9990771857 Call Girls in Noida Sector 11 Noida (Call Girls) Delhi
 
Omaxe Dwarka In Delhi E Brochure Pdf
Omaxe Dwarka In Delhi E Brochure     PdfOmaxe Dwarka In Delhi E Brochure     Pdf
Omaxe Dwarka In Delhi E Brochure Pdf
 
Low Rate Call Girls in Triveni Complex Delhi Call 9873940964
Low Rate Call Girls in Triveni Complex Delhi Call 9873940964Low Rate Call Girls in Triveni Complex Delhi Call 9873940964
Low Rate Call Girls in Triveni Complex Delhi Call 9873940964
 
Low Rate Call Girls in Triveni Complex Delhi Call 9990771857
Low Rate Call Girls in Triveni Complex Delhi Call 9990771857Low Rate Call Girls in Triveni Complex Delhi Call 9990771857
Low Rate Call Girls in Triveni Complex Delhi Call 9990771857
 
Listing Turkey Sylvana Istanbul - Bahcesehir
Listing Turkey Sylvana Istanbul - BahcesehirListing Turkey Sylvana Istanbul - Bahcesehir
Listing Turkey Sylvana Istanbul - Bahcesehir
 
Nanke Area Estate commercial ( Dir. Kat Kuo)
Nanke Area Estate commercial ( Dir. Kat Kuo)Nanke Area Estate commercial ( Dir. Kat Kuo)
Nanke Area Estate commercial ( Dir. Kat Kuo)
 
Call Girls in Khan Market 9654467111 ESCORTS SERVICE
Call Girls in Khan Market 9654467111 ESCORTS SERVICECall Girls in Khan Market 9654467111 ESCORTS SERVICE
Call Girls in Khan Market 9654467111 ESCORTS SERVICE
 
9990771857 Call Girls in Noida Sector 10 Noida (Call Girls) Delhi
9990771857 Call Girls in Noida Sector 10 Noida (Call Girls) Delhi9990771857 Call Girls in Noida Sector 10 Noida (Call Girls) Delhi
9990771857 Call Girls in Noida Sector 10 Noida (Call Girls) Delhi
 
Call Girls in Pitampura Delhi 💯Call Us 🔝8264348440🔝
Call Girls in Pitampura Delhi 💯Call Us 🔝8264348440🔝Call Girls in Pitampura Delhi 💯Call Us 🔝8264348440🔝
Call Girls in Pitampura Delhi 💯Call Us 🔝8264348440🔝
 
Call Girls in Mahavir Nagar whatsaap call US +919953056974
Call Girls in Mahavir Nagar  whatsaap call US  +919953056974Call Girls in Mahavir Nagar  whatsaap call US  +919953056974
Call Girls in Mahavir Nagar whatsaap call US +919953056974
 
Call Girls In Madipur Metro Delhi꧁ +91)8447779280꧂Low Rate 2 short 2000 full ...
Call Girls In Madipur Metro Delhi꧁ +91)8447779280꧂Low Rate 2 short 2000 full ...Call Girls In Madipur Metro Delhi꧁ +91)8447779280꧂Low Rate 2 short 2000 full ...
Call Girls In Madipur Metro Delhi꧁ +91)8447779280꧂Low Rate 2 short 2000 full ...
 
Call Girls in Sarai Kale Khan Delhi 💯Call Us 🔝8264348440🔝
Call Girls in Sarai Kale Khan Delhi 💯Call Us 🔝8264348440🔝Call Girls in Sarai Kale Khan Delhi 💯Call Us 🔝8264348440🔝
Call Girls in Sarai Kale Khan Delhi 💯Call Us 🔝8264348440🔝
 
Building Dreams: Newman Leech's Visionary Approach to Real Estate Investment
Building Dreams: Newman Leech's Visionary Approach to Real Estate InvestmentBuilding Dreams: Newman Leech's Visionary Approach to Real Estate Investment
Building Dreams: Newman Leech's Visionary Approach to Real Estate Investment
 
Puravankara Mundhwa Pune E-Brochure.pdf
Puravankara Mundhwa Pune  E-Brochure.pdfPuravankara Mundhwa Pune  E-Brochure.pdf
Puravankara Mundhwa Pune E-Brochure.pdf
 
Call Girls In Mundka Industrial Metro@꧂8447779280 ↬Enjoy ꧂Escort Service in ...
Call Girls In Mundka Industrial Metro@꧂8447779280 ↬Enjoy ꧂Escort Service in  ...Call Girls In Mundka Industrial Metro@꧂8447779280 ↬Enjoy ꧂Escort Service in  ...
Call Girls In Mundka Industrial Metro@꧂8447779280 ↬Enjoy ꧂Escort Service in ...
 
9990771857 Call Girls in Noida Sector 03 Noida (Call Girls) Delhi
9990771857 Call Girls in Noida Sector 03 Noida (Call Girls) Delhi9990771857 Call Girls in Noida Sector 03 Noida (Call Girls) Delhi
9990771857 Call Girls in Noida Sector 03 Noida (Call Girls) Delhi
 
Shapoorji Pallonji Parkwest Sequoia Tower Bangalore.pdf
Shapoorji Pallonji Parkwest Sequoia Tower Bangalore.pdfShapoorji Pallonji Parkwest Sequoia Tower Bangalore.pdf
Shapoorji Pallonji Parkwest Sequoia Tower Bangalore.pdf
 
)_Call Girls In Radisson Blu Plaza Hotel, Delhi Airport ❤️8860477959 _Indepen...
)_Call Girls In Radisson Blu Plaza Hotel, Delhi Airport ❤️8860477959 _Indepen...)_Call Girls In Radisson Blu Plaza Hotel, Delhi Airport ❤️8860477959 _Indepen...
)_Call Girls In Radisson Blu Plaza Hotel, Delhi Airport ❤️8860477959 _Indepen...
 
call girls in Shahdara (DELHI) 🔝 >༒9953330565🔝 genuine Escort Service 🔝✔️✔️
call girls in Shahdara (DELHI) 🔝 >༒9953330565🔝 genuine Escort Service 🔝✔️✔️call girls in Shahdara (DELHI) 🔝 >༒9953330565🔝 genuine Escort Service 🔝✔️✔️
call girls in Shahdara (DELHI) 🔝 >༒9953330565🔝 genuine Escort Service 🔝✔️✔️
 

Pittsburgh Office Insight & Stats Q1 2022

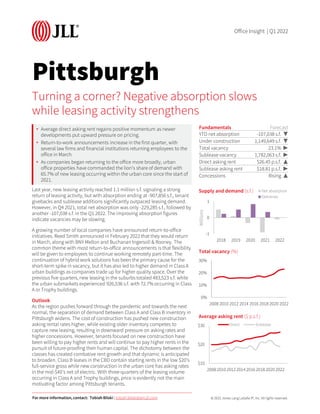
  • 1. © 2022 Jones Lang LaSalle IP, Inc. All rights reserved. Pittsburgh Last year, new leasing activity reached 1.1 million s.f. signaling a strong return of leasing activity, but with absorption ending at -907,856 s.f., tenant givebacks and sublease additions significantly outpaced leasing demand. However, in Q4 2021, total net absorption was only -229,285 s.f., followed by another -107,038 s.f. in the Q1 2022. The improving absorption figures indicate vacancies may be slowing. A growing number of local companies have announced return-to-office initiatives. Reed Smith announced in February 2022 that they would return in March, along with BNY Mellon and Buchanan Ingersoll & Rooney. The common theme with most return-to-office announcements is that flexibility will be given to employees to continue working remotely part-time. The continuation of hybrid work solutions has been the primary cause for the short-term spike in vacancy, but it has also led to higher demand in Class A urban buildings as companies trade up for higher quality space. Over the previous five quarters, new leasing in the suburbs totaled 483,523 s.f. while the urban submarkets experienced 926,536 s.f. with 72.7% occurring in Class A or Trophy buildings. Outlook As the region pushes forward through the pandemic and towards the next normal, the separation of demand between Class A and Class B inventory in Pittsburgh widens. The cost of construction has pushed new construction asking rental rates higher, while existing older inventory competes to capture new leasing, resulting in downward pressure on asking rates and higher concessions. However, tenants focused on new construction have been willing to pay higher rents and will continue to pay higher rents in the pursuit of future-proofing their human capital. The dichotomy between the classes has created combative rent growth and that dynamic is anticipated to broaden. Class B leases in the CBD contain starting rents in the low $20’s full-service gross while new construction in the urban core has asking rates in the mid-$40’s net of electric. With three-quarters of the leasing volume occurring in Class A and Trophy buildings, price is evidently not the main motivating factor among Pittsburgh tenants. Turning a corner? Negative absorption slows while leasing activity strengthens • Average direct asking rent regains positive momentum as newer developments put upward pressure on pricing. • Return-to-work announcements increase in the first quarter, with several law firms and financial institutions returning employees to the office in March. • As companies began returning to the office more broadly, urban office properties have commanded the lion’s share of demand with 65.7% of new leasing occurring within the urban core since the start of 2021. Fundamentals Forecast YTD net absorption -107,038 s.f. ▼ Under construction 1,149,649 s.f. ▼ Total vacancy 23.1% ▶ Sublease vacancy 1,782,063 s.f. ▶ Direct asking rent $26.45 p.s.f. ▲ Sublease asking rent $18.81 p.s.f. ▶ Concessions Rising ▲ -1 0 1 2018 2019 2020 2021 2022 Millions Supply and demand (s.f.) Net absorption Deliveries 0% 10% 20% 30% 2008 2010 2012 2014 2016 2018 2020 2022 Total vacancy (%) $10 $20 $30 2008 2010 2012 2014 2016 2018 2020 2022 Average asking rent ($ p.s.f.) Direct Sublease For more information, contact: Tobiah Bilski | tobiah.bilski@am.jll.com Office Insight | Q1 2022
  • 2. © 2022 Jones Lang LaSalle IP, Inc. All rights reserved. Pittsburgh For more information, contact: Tobiah Bilski | Tobiah.Bilski@am.jll.com Office Statistics | Q1 2022 Class Inventory (s.f.) Total net absorption (s.f.) YTD total net absorption (s.f.) YTD total net absorption (% of stock) Direct vacancy (%) Total vacancy (%) Average direct asking rent ($ p.s.f.) YTD Completions (s.f.) Under Development (s.f.) Northern I-79 / Cranberry Totals 4,449,807 -56,193 -56,193 -1.3% 17.1% 24.4% $24.73 0 0 East Totals 3,256,850 3,230 3,230 0.1% 30.1% 30.5% $20.18 0 0 North Totals 2,884,813 16,004 16,004 0.6% 16.1% 16.7% $19.98 0 100,000 South Totals 2,451,420 -9,525 -9,525 -0.4% 13.3% 13.3% $20.58 0 0 Southpointe Totals 3,532,244 23,292 23,292 0.7% 17.2% 27.1% $21.95 0 0 West Totals 7,549,182 -21,746 -21,746 -0.3% 24.7% 26.1% $21.76 0 0 Suburban Totals 24,124,316 -44,938 -44,938 -0.2% 20.7% 24.1% $21.69 0 100,000 CBD Totals 19,117,727 -28,220 -28,220 -0.1% 18.4% 21.2% $27.86 0 458,000 Fringe Totals 8,824,279 -47,416 -47,416 -0.5% 18.2% 22.7% $29.21 0 232,000 Oakland / East End Totals 3,477,188 13,536 13,536 1.0% 26.0% 26.6% $37.50 0 359,649 Urban Totals 31,419,194 -62,100 -62,100 -0.1% 19.2% 22.3% $29.94 0 1,049,649 Pittsburgh Totals 55,543,510 -107,038 -107,038 -0.2% 19.8% 23.1% $26.45 0 1,149,649 Northern I-79 / Cranberry A 3,726,249 -32,087 -32,087 -0.9% 16.3% 24.9% $25.24 0 0 East A 1,539,784 -7,216 -7,216 -0.5% 40.7% 41.0% $21.19 0 0 North A 855,815 7,755 7,755 0.9% 16.9% 16.9% $23.85 0 100,000 South A 220,000 0 0 0.0% 11.3% 11.3% $20.00 0 0 Southpointe A 2,449,891 -11,339 -11,339 -0.5% 13.7% 27.3% $22.74 0 0 West A 4,162,490 -13,666 -13,666 -0.3% 19.6% 21.3% $23.59 0 0 Suburban A 12,954,229 -56,553 -56,553 -0.4% 19.7% 25.4% $23.28 0 100,000 CBD A 13,512,018 -34,808 -34,808 -0.3% 14.5% 17.9% $31.73 0 458,000 Fringe A 2,944,083 -40,413 -40,413 -1.4% 14.2% 20.3% $37.41 0 232,000 Oakland / East End A 2,015,559 0 0 0.0% 35.2% 35.9% $39.62 0 359,649 Urban A 18,471,660 -75,221 -75,221 -0.4% 16.7% 20.3% $34.73 0 1,049,649 Pittsburgh A 31,425,889 -131,774 -131,774 -0.4% 17.9% 22.4% $30.20 0 1,149,649 Northern I-79 / Cranberry B 723,558 -24,106 -24,106 -3.3% 21.4% 21.9% $22.58 0 0 East B 1,717,066 10,446 10,446 0.6% 20.6% 21.1% $18.36 0 0 North B 2,028,998 8,249 8,249 0.4% 15.7% 16.6% $18.24 0 0 South B 2,231,420 -9,525 -9,525 -0.4% 13.5% 13.5% $20.63 0 0 Southpointe B 1,082,353 34,631 34,631 3.2% 25.3% 26.8% $21.01 0 0 West B 3,386,692 -8,080 -8,080 -0.2% 31.0% 32.0% $20.32 0 0 Suburban B 11,170,087 11,615 11,615 0.1% 21.9% 22.7% $20.01 0 0 CBD B 5,605,709 6,588 6,588 0.1% 27.7% 29.3% $22.18 0 0 Fringe B 5,880,196 -7,003 -7,003 -0.1% 20.3% 24.0% $24.83 0 0 Oakland / East End B 1,461,629 13,536 13,536 2.4% 13.2% 13.8% $25.78 0 0 Urban B 12,947,534 13,121 13,121 0.3% 22.7% 25.1% $23.50 0 0 Pittsburgh B 24,117,621 24,736 24,736 0.2% 22.3% 24.0% $21.91 0 0