SlideShare a Scribd company logo
1 of 2
Download to read offline
© 2017 Jones Lang LaSalle IP, Inc. All rights reserved. All information contained herein is from sources deemedreliable; however, no representation or warranty is made to the accuracy thereof.
Q3 2017
Detroit
Office Insight
The third quarter of 2017 saw a handful of smaller leases take place in both
urban and suburban submarkets. Multiple leases were executed in the Fisher
building, including the Children’s Hospital of Michigan and Yamasaki Inc.
LinkedIn announced plans to open a downtownDetroit office, as did
Berkshire Hathaway and the Ballmer Group, but none of these three have yet
to sign a lease. Construction and development activity keeps gaining
momentum. Masco opened their 91,220-square-footheadquarters in Livonia,
while Toyota announced plans to build a headquarters facility in Novi for their
truck division, Hino, and Tenneco announced plans for a $23.0 million
customer center in Northville. A 100,000-square-foot,$25.0 million
development in downtownRoyal Oak received site approval and Bedrock’s
Hudson’s site plan has grown in scale by an additional $125.0 million.
Investment sales activity continues to increase, as multiple high profile office
assets traded in the third quarter. Wilshere Plaza in Troy sold to a New York
buyer for $33.0 million, and the Ford Building downtownwas sold to a
Birmingham development group. The Bank of America building in Troy sold
for $74.0 million while United Shore Financial purchased a property in Pontiac
to relocate their headquarters from Troy.
Outlook
As conditions continue to improve in Detroit, we will see sustained rent
growth and dropping vacancies. Looking ahead - we can prepare to see
cranes amongst the downtownskyline, as Bedrock readies to break ground
on the Hudson’s development on Woodward in December. It will be
interesting to keep an eye on Mayor Duggan and Dan Gilbert’s pitch to
Amazon for their second North American headquarters. Will Detroit be seen as
a viable option?
Fundamentals Forecast
YTD net absorption 319,436 s.f. ▲
Under construction 688,957 s.f. ▲
Total vacancy 19.6% ▶
Average asking rent (gross) $19.00 p.s.f. ▲
Concessions Falling ▼
0
500,000
1,000,000
1,500,000
2013 2014 2015 2016 YTD
2017
Supply and demand (s.f.) Net absorption
Deliveries
Construction and investment activity picks up as
outlook improves upon metro Detroit
25.4% 25.1%
19.0% 20.2% 19.6%
2013 2014 2015 2016 2017
Total vacancy
$0.00
$15.00
$30.00
2013 2014 2015 2016 2017
Average asking rents ($/s.f.) Class A
Class B
For more information, contact: Harrison West | harrison.west@am.jll.com
• Smaller lease deals make up most of the third quarter activity as rent
growth and dropping vacancies have slowed
• Construction and development activity continues to ramp up, most
notably downtown
• Volume of property trades is up, driven by improving investor sentiment
and strong market conditions
© 2017 Jones Lang LaSalle IP, Inc. All rights reserved. All information contained herein is from sources deemedreliable; however, no representation or warranty is made to the accuracy thereof.
Q3 2017
Detroit
Office Statistics
For more information, contact: Harrison West | harrison.west@am.jll.com
Class Inventory (s.f.)
Total net
absorption
(s.f.)
YTD total net
absorption
(s.f.)
YTD total net
absorption
(% ofstock)
Direct
vacancy (%)
Total
vacancy (%)
Average
direct asking
rent ($ p.s.f.)
YTD
completions
(s.f.)
Under
construction
(s.f.)
CBD Totals 13,317,209 93,779 34,887 0.3% 12.7% 13.1% $21.12 0 227,430
New Center Totals 1,142,100 34,130 18,335 1.6% 22.3% 22.3% $18.84 0 0
Urban Totals 14,459,309 127,909 53,222 0.4% 13.5% 13.9% $20.82 0 227,430
Birmingham/Bloomfield Totals 3,979,668 -11,490 23,707 0.6% 11.2% 15.7% $25.27 0 0
Dearborn Totals 2,705,625 -4,218 186,324 6.9% 26.9% 27.1% $16.79 0 150,000
Downriver Totals 483,907 19,360 3,007 0.6% 40.1% 40.1% $14.70 0 0
Farmington/Farmington Hills Totals 4,658,516 -26,061 -8,402 -0.2% 17.4% 17.4% $18.76 0 30,000
Macomb Totals 1,286,875 -26,204 -30,242 -2.4% 21.5% 21.5% $17.23 0 0
Northern I-275 Corridor Totals 4,467,691 118,859 168,160 3.8% 9.4% 10.4% $18.64 180,000 152,527
North Oakland Totals 2,845,648 37,323 -171,056 -6.0% 20.8% 21.4% $19.37 0 0
Royal Oak/Southeast Oakland Totals 706,710 -38 -2,513 -0.4% 7.1% 7.1% $15.70 0 129,000
Southern I-275 Corridor Totals 1,077,525 4,600 4,600 0.4% 0.0% 0.0% NA 0 0
Southfield Totals 13,595,696 -50,516 -37,807 -0.3% 29.2% 30.9% $18.09 0 0
Troy Totals 11,003,062 -22,392 123,580 1.1% 22.8% 23.2% $18.25 0 0
Washtenaw Totals 6,613,772 -46,497 6,856 0.1% 10.6% 11.5% $22.36 0 0
Suburbs Totals 53,424,695 -7,274 266,214 0.5% 20.0% 21.1% $18.67 180,000 461,527
Detroit Totals 67,884,004 120,635 319,436 0.5% 18.6% 19.6% $19.00 180,000 688,957
CBD A 6,194,714 93,318 27,549 0.4% 8.2% 9.1% $22.70 0 227,430
Urban A 6,194,714 93,318 27,549 0.4% 8.2% 9.1% $22.70 0 227,430
Birmingham/Bloomfield A 1,569,497 6,417 21,798 1.4% 11.5% 22.4% $27.21 0 0
Dearborn A 446,890 0 1,619 0.4% 10.9% 10.9% $27.50 0 150,000
Farmington/Farmington Hills A 618,109 -14,109 -14,109 -2.3% 15.3% 15.3% $23.92 0 0
Macomb A 295,494 4,411 11,712 4.0% 1.6% 1.6% $19.32 0 0
Northern I-275 Corridor A 1,113,719 -635 -2,472 -0.2% 6.5% 7.6% $19.06 180,000 75,980
North Oakland A 488,665 17,142 -6,915 -1.4% 24.2% 24.2% $21.02 0 0
Southern I-275 Corridor A 832,753 0 0 0.0% 0.0% 0.0% NA 0 0
Southfield A 2,970,217 38,680 -19,313 -0.7% 25.1% 25.7% $23.24 0 0
Troy A 1,924,131 44,722 -21,724 -1.1% 18.0% 18.8% $24.96 0 0
Washtenaw A 3,218,983 -334 17,094 0.5% 11.3% 12.9% $23.78 0 0
Suburbs A 13,478,458 96,294 -12,310 -0.1% 14.7% 16.6% $23.84 180,000 225,980
Detroit A 19,673,172 189,612 15,239 0.1% 12.6% 14.3% $23.61 180,000 453,410
CBD B 7,122,495 461 7,338 0.1% 16.7% 16.7% $20.33 0 0
New Center B 1,142,100 34,130 18,335 1.6% 22.3% 22.3% $18.84 0 0
Urban B 8,264,595 34,591 25,673 0.3% 17.5% 17.5% $20.06 0 0
Birmingham/Bloomfield B 2,410,171 -17,907 1,909 0.1% 11.1% 11.3% $23.85 0 0
Dearborn B 2,258,735 -4,218 184,705 8.2% 30.0% 30.3% $16.04 0 0
Downriver B 483,907 19,360 3,007 0.6% 40.1% 40.1% $14.70 0 0
Farmington/Farmington Hills B 4,040,407 -11,952 5,707 0.1% 17.8% 17.8% $18.16 0 30,000
Macomb B 991,381 -30,615 -41,954 -4.2% 27.5% 27.5% $17.18 0 0
Northern I-275 Corridor B 3,353,972 119,494 170,632 5.1% 10.3% 11.3% $18.56 0 76,547
North Oakland B 2,356,983 20,181 -164,141 -7.0% 20.1% 20.8% $18.96 0 0
Royal Oak/Southeast Oakland B 706,710 -38 -2,513 -0.4% 7.1% 7.1% $15.70 0 129,000
Southern I-275 Corridor B 244,772 4,600 4,600 1.9% 0.0% 0.0% NA 0 0
Southfield B 10,625,479 -89,196 -18,494 -0.2% 30.3% 32.4% $16.92 0 0
Troy B 9,078,931 -67,114 145,304 1.6% 23.8% 24.1% $17.34 0 0
Washtenaw B 3,394,789 -46,163 -10,238 -0.3% 9.8% 10.2% $20.74 0 0
Suburbs B 39,946,237 -103,568 278,524 0.7% 21.8% 22.6% $17.55 0 235,547
Detroit B 48,210,832 -68,977 304,197 0.6% 21.1% 21.7% $17.90 0 235,547

More Related Content

What's hot

Pittsburgh Office Insight & Stats Q1 2022
Pittsburgh Office Insight & Stats Q1 2022Pittsburgh Office Insight & Stats Q1 2022
Pittsburgh Office Insight & Stats Q1 2022Tobiah Bilski
 
JLL Cleveland Office Outlook: Q4 2018
JLL Cleveland Office Outlook: Q4 2018JLL Cleveland Office Outlook: Q4 2018
JLL Cleveland Office Outlook: Q4 2018Andrew Batson
 
JLL Cleveland Office Outlook: Q2 2018
JLL Cleveland Office Outlook: Q2 2018JLL Cleveland Office Outlook: Q2 2018
JLL Cleveland Office Outlook: Q2 2018Andrew Batson
 
JLL Cleveland Office Outlook: Q3 2018
JLL Cleveland Office Outlook: Q3 2018JLL Cleveland Office Outlook: Q3 2018
JLL Cleveland Office Outlook: Q3 2018Andrew Batson
 
JLL Grand Rapids Office Insight & Statistics - Q1 2019
JLL Grand Rapids Office Insight & Statistics - Q1 2019JLL Grand Rapids Office Insight & Statistics - Q1 2019
JLL Grand Rapids Office Insight & Statistics - Q1 2019Harrison West
 
Jll cincinnati office outlook q2 2017
Jll cincinnati office outlook   q2 2017Jll cincinnati office outlook   q2 2017
Jll cincinnati office outlook q2 2017Abby Armbruster
 
JLL Cleveland Office Outlook: Q3 2017
JLL Cleveland Office Outlook: Q3 2017JLL Cleveland Office Outlook: Q3 2017
JLL Cleveland Office Outlook: Q3 2017Andrew Batson
 
JLL Pittsburgh Office Insight & Statistics - Q3 2019
 JLL Pittsburgh Office Insight & Statistics - Q3 2019 JLL Pittsburgh Office Insight & Statistics - Q3 2019
JLL Pittsburgh Office Insight & Statistics - Q3 2019Tobiah Bilski
 
JLL Cleveland Office Outlook: Q1 2017
JLL Cleveland Office Outlook: Q1 2017JLL Cleveland Office Outlook: Q1 2017
JLL Cleveland Office Outlook: Q1 2017Andrew Batson
 
JLL Cleveland Office Outlook: Q3 2019
JLL Cleveland Office Outlook: Q3 2019JLL Cleveland Office Outlook: Q3 2019
JLL Cleveland Office Outlook: Q3 2019Johnathan Miller
 
JLL Pittsburgh Office Outlook - Q4 2015
JLL Pittsburgh Office Outlook - Q4 2015JLL Pittsburgh Office Outlook - Q4 2015
JLL Pittsburgh Office Outlook - Q4 2015Andrew Batson
 
JLL Cleveland Office Outlook: Q2 2018
JLL Cleveland Office Outlook: Q2 2018JLL Cleveland Office Outlook: Q2 2018
JLL Cleveland Office Outlook: Q2 2018Andrew Batson
 
JLL Cincinnati Office Insight & Statistics - Q3 2016
JLL Cincinnati Office Insight & Statistics - Q3 2016JLL Cincinnati Office Insight & Statistics - Q3 2016
JLL Cincinnati Office Insight & Statistics - Q3 2016Ross Bratcher
 
JLL Cleveland Office Outlook: Q4 2017
JLL Cleveland Office Outlook: Q4 2017JLL Cleveland Office Outlook: Q4 2017
JLL Cleveland Office Outlook: Q4 2017Andrew Batson
 
JLL Cleveland Office Outlook: Q4 2020
JLL Cleveland Office Outlook: Q4 2020JLL Cleveland Office Outlook: Q4 2020
JLL Cleveland Office Outlook: Q4 2020Andrew Batson
 
JLL Pittsburgh Office Insight & Statistics - Q4 2018
JLL Pittsburgh Office Insight & Statistics - Q4 2018JLL Pittsburgh Office Insight & Statistics - Q4 2018
JLL Pittsburgh Office Insight & Statistics - Q4 2018Tobiah Bilski
 
JLL Pittsburgh Office Insight & Statistics - Q3 2018
JLL Pittsburgh Office Insight & Statistics - Q3 2018JLL Pittsburgh Office Insight & Statistics - Q3 2018
JLL Pittsburgh Office Insight & Statistics - Q3 2018Tobiah Bilski
 
JLL Cleveland Office Outlook: Q1 2018
JLL Cleveland Office Outlook: Q1 2018JLL Cleveland Office Outlook: Q1 2018
JLL Cleveland Office Outlook: Q1 2018Andrew Batson
 
JLL Cleveland Office Outlook: Q1 2018
JLL Cleveland Office Outlook: Q1 2018JLL Cleveland Office Outlook: Q1 2018
JLL Cleveland Office Outlook: Q1 2018Andrew Batson
 
JLL Cleveland Office Outlook: Q1 2018
JLL Cleveland Office Outlook: Q1 2018JLL Cleveland Office Outlook: Q1 2018
JLL Cleveland Office Outlook: Q1 2018Andrew Batson
 

What's hot (20)

Pittsburgh Office Insight & Stats Q1 2022
Pittsburgh Office Insight & Stats Q1 2022Pittsburgh Office Insight & Stats Q1 2022
Pittsburgh Office Insight & Stats Q1 2022
 
JLL Cleveland Office Outlook: Q4 2018
JLL Cleveland Office Outlook: Q4 2018JLL Cleveland Office Outlook: Q4 2018
JLL Cleveland Office Outlook: Q4 2018
 
JLL Cleveland Office Outlook: Q2 2018
JLL Cleveland Office Outlook: Q2 2018JLL Cleveland Office Outlook: Q2 2018
JLL Cleveland Office Outlook: Q2 2018
 
JLL Cleveland Office Outlook: Q3 2018
JLL Cleveland Office Outlook: Q3 2018JLL Cleveland Office Outlook: Q3 2018
JLL Cleveland Office Outlook: Q3 2018
 
JLL Grand Rapids Office Insight & Statistics - Q1 2019
JLL Grand Rapids Office Insight & Statistics - Q1 2019JLL Grand Rapids Office Insight & Statistics - Q1 2019
JLL Grand Rapids Office Insight & Statistics - Q1 2019
 
Jll cincinnati office outlook q2 2017
Jll cincinnati office outlook   q2 2017Jll cincinnati office outlook   q2 2017
Jll cincinnati office outlook q2 2017
 
JLL Cleveland Office Outlook: Q3 2017
JLL Cleveland Office Outlook: Q3 2017JLL Cleveland Office Outlook: Q3 2017
JLL Cleveland Office Outlook: Q3 2017
 
JLL Pittsburgh Office Insight & Statistics - Q3 2019
 JLL Pittsburgh Office Insight & Statistics - Q3 2019 JLL Pittsburgh Office Insight & Statistics - Q3 2019
JLL Pittsburgh Office Insight & Statistics - Q3 2019
 
JLL Cleveland Office Outlook: Q1 2017
JLL Cleveland Office Outlook: Q1 2017JLL Cleveland Office Outlook: Q1 2017
JLL Cleveland Office Outlook: Q1 2017
 
JLL Cleveland Office Outlook: Q3 2019
JLL Cleveland Office Outlook: Q3 2019JLL Cleveland Office Outlook: Q3 2019
JLL Cleveland Office Outlook: Q3 2019
 
JLL Pittsburgh Office Outlook - Q4 2015
JLL Pittsburgh Office Outlook - Q4 2015JLL Pittsburgh Office Outlook - Q4 2015
JLL Pittsburgh Office Outlook - Q4 2015
 
JLL Cleveland Office Outlook: Q2 2018
JLL Cleveland Office Outlook: Q2 2018JLL Cleveland Office Outlook: Q2 2018
JLL Cleveland Office Outlook: Q2 2018
 
JLL Cincinnati Office Insight & Statistics - Q3 2016
JLL Cincinnati Office Insight & Statistics - Q3 2016JLL Cincinnati Office Insight & Statistics - Q3 2016
JLL Cincinnati Office Insight & Statistics - Q3 2016
 
JLL Cleveland Office Outlook: Q4 2017
JLL Cleveland Office Outlook: Q4 2017JLL Cleveland Office Outlook: Q4 2017
JLL Cleveland Office Outlook: Q4 2017
 
JLL Cleveland Office Outlook: Q4 2020
JLL Cleveland Office Outlook: Q4 2020JLL Cleveland Office Outlook: Q4 2020
JLL Cleveland Office Outlook: Q4 2020
 
JLL Pittsburgh Office Insight & Statistics - Q4 2018
JLL Pittsburgh Office Insight & Statistics - Q4 2018JLL Pittsburgh Office Insight & Statistics - Q4 2018
JLL Pittsburgh Office Insight & Statistics - Q4 2018
 
JLL Pittsburgh Office Insight & Statistics - Q3 2018
JLL Pittsburgh Office Insight & Statistics - Q3 2018JLL Pittsburgh Office Insight & Statistics - Q3 2018
JLL Pittsburgh Office Insight & Statistics - Q3 2018
 
JLL Cleveland Office Outlook: Q1 2018
JLL Cleveland Office Outlook: Q1 2018JLL Cleveland Office Outlook: Q1 2018
JLL Cleveland Office Outlook: Q1 2018
 
JLL Cleveland Office Outlook: Q1 2018
JLL Cleveland Office Outlook: Q1 2018JLL Cleveland Office Outlook: Q1 2018
JLL Cleveland Office Outlook: Q1 2018
 
JLL Cleveland Office Outlook: Q1 2018
JLL Cleveland Office Outlook: Q1 2018JLL Cleveland Office Outlook: Q1 2018
JLL Cleveland Office Outlook: Q1 2018
 

Similar to JLL Detroit Office Insight & Statistics - Q3 2017

JLL Detroit Office Insight & Statistics - Q3 2019
JLL Detroit Office Insight & Statistics - Q3 2019JLL Detroit Office Insight & Statistics - Q3 2019
JLL Detroit Office Insight & Statistics - Q3 2019Harrison West
 
JLL Detroit Office Insight & Statistics - Q4 2019
JLL Detroit Office Insight & Statistics - Q4 2019JLL Detroit Office Insight & Statistics - Q4 2019
JLL Detroit Office Insight & Statistics - Q4 2019Harrison West
 
JLL Detroit Office Insight & Statistics - Q4 2018
JLL Detroit Office Insight & Statistics - Q4 2018JLL Detroit Office Insight & Statistics - Q4 2018
JLL Detroit Office Insight & Statistics - Q4 2018Harrison West
 
JLL Detroit Office Outlook: Q4 2015
JLL Detroit Office Outlook: Q4 2015JLL Detroit Office Outlook: Q4 2015
JLL Detroit Office Outlook: Q4 2015Aaron Moore
 
Q1 2017 - Chicago Suburbs Office Reports
Q1 2017 - Chicago Suburbs Office ReportsQ1 2017 - Chicago Suburbs Office Reports
Q1 2017 - Chicago Suburbs Office ReportsHailey Harrington
 
Jll cincinnati office outlook q1 2017
Jll cincinnati office outlook   q1 2017Jll cincinnati office outlook   q1 2017
Jll cincinnati office outlook q1 2017Abby Armbruster
 
JLL Cincinnati Office Outlook Q4 2020
JLL Cincinnati Office Outlook Q4 2020JLL Cincinnati Office Outlook Q4 2020
JLL Cincinnati Office Outlook Q4 2020Abby Armbruster
 
JLL Cincinnati Office Outlook Q2 2020
JLL Cincinnati Office Outlook Q2 2020JLL Cincinnati Office Outlook Q2 2020
JLL Cincinnati Office Outlook Q2 2020Abby Armbruster
 
JLL Pittsburgh Office Insight & Statistics - Q2 2021
JLL Pittsburgh Office Insight & Statistics - Q2 2021JLL Pittsburgh Office Insight & Statistics - Q2 2021
JLL Pittsburgh Office Insight & Statistics - Q2 2021Tobiah Bilski
 
JLL Cincinnati Office Insight & Statistics - Q2 2016
JLL Cincinnati Office Insight & Statistics - Q2 2016JLL Cincinnati Office Insight & Statistics - Q2 2016
JLL Cincinnati Office Insight & Statistics - Q2 2016Ross Bratcher
 
JLL Downtown Chicago Office Market Update - Q3 2016
JLL Downtown Chicago Office Market Update - Q3 2016JLL Downtown Chicago Office Market Update - Q3 2016
JLL Downtown Chicago Office Market Update - Q3 2016Hailey Harrington
 
St. Louis Office Outlook Q2 2016
St. Louis Office Outlook Q2 2016St. Louis Office Outlook Q2 2016
St. Louis Office Outlook Q2 2016Blaise Tomazic
 
JLL Louisville Office Outlook - Q4 2019
JLL Louisville Office Outlook - Q4 2019JLL Louisville Office Outlook - Q4 2019
JLL Louisville Office Outlook - Q4 2019Alex Westcott
 
JLL Grand Rapids Office Insight & Statistics - Q3 2018
JLL Grand Rapids Office Insight & Statistics - Q3 2018JLL Grand Rapids Office Insight & Statistics - Q3 2018
JLL Grand Rapids Office Insight & Statistics - Q3 2018Harrison West
 
JLL Grand Rapids Office Insight & Statistics - Q4 2019
JLL Grand Rapids Office Insight & Statistics - Q4 2019JLL Grand Rapids Office Insight & Statistics - Q4 2019
JLL Grand Rapids Office Insight & Statistics - Q4 2019Harrison West
 
JLL Houston Office Market Report - Q4 2018
JLL Houston Office Market Report - Q4 2018JLL Houston Office Market Report - Q4 2018
JLL Houston Office Market Report - Q4 2018DavidDominy1
 
JLL Louisville Office Outlook - Q3 2019
JLL Louisville Office Outlook - Q3 2019JLL Louisville Office Outlook - Q3 2019
JLL Louisville Office Outlook - Q3 2019Alex Westcott
 
JLL Louisville Office Outlook - Q4 2020
JLL Louisville Office Outlook - Q4 2020JLL Louisville Office Outlook - Q4 2020
JLL Louisville Office Outlook - Q4 2020Alex Westcott
 
JLL Louisville Office Outlook - Q3 2018
JLL Louisville Office Outlook - Q3 2018JLL Louisville Office Outlook - Q3 2018
JLL Louisville Office Outlook - Q3 2018Alex Westcott
 

Similar to JLL Detroit Office Insight & Statistics - Q3 2017 (20)

JLL Detroit Office Insight & Statistics - Q3 2019
JLL Detroit Office Insight & Statistics - Q3 2019JLL Detroit Office Insight & Statistics - Q3 2019
JLL Detroit Office Insight & Statistics - Q3 2019
 
JLL Detroit Office Insight & Statistics - Q4 2019
JLL Detroit Office Insight & Statistics - Q4 2019JLL Detroit Office Insight & Statistics - Q4 2019
JLL Detroit Office Insight & Statistics - Q4 2019
 
JLL Detroit Office Insight & Statistics - Q4 2018
JLL Detroit Office Insight & Statistics - Q4 2018JLL Detroit Office Insight & Statistics - Q4 2018
JLL Detroit Office Insight & Statistics - Q4 2018
 
JLL Detroit Office Outlook: Q4 2015
JLL Detroit Office Outlook: Q4 2015JLL Detroit Office Outlook: Q4 2015
JLL Detroit Office Outlook: Q4 2015
 
Q1 2017 - Chicago Suburbs Office Reports
Q1 2017 - Chicago Suburbs Office ReportsQ1 2017 - Chicago Suburbs Office Reports
Q1 2017 - Chicago Suburbs Office Reports
 
Jll cincinnati office outlook q1 2017
Jll cincinnati office outlook   q1 2017Jll cincinnati office outlook   q1 2017
Jll cincinnati office outlook q1 2017
 
JLL Cincinnati Office Outlook Q4 2020
JLL Cincinnati Office Outlook Q4 2020JLL Cincinnati Office Outlook Q4 2020
JLL Cincinnati Office Outlook Q4 2020
 
JLL Cincinnati Office Outlook Q2 2020
JLL Cincinnati Office Outlook Q2 2020JLL Cincinnati Office Outlook Q2 2020
JLL Cincinnati Office Outlook Q2 2020
 
JLL Pittsburgh Office Insight & Statistics - Q2 2021
JLL Pittsburgh Office Insight & Statistics - Q2 2021JLL Pittsburgh Office Insight & Statistics - Q2 2021
JLL Pittsburgh Office Insight & Statistics - Q2 2021
 
JLL Cincinnati Office Insight & Statistics - Q2 2016
JLL Cincinnati Office Insight & Statistics - Q2 2016JLL Cincinnati Office Insight & Statistics - Q2 2016
JLL Cincinnati Office Insight & Statistics - Q2 2016
 
JLL Downtown Chicago Office Market Update - Q3 2016
JLL Downtown Chicago Office Market Update - Q3 2016JLL Downtown Chicago Office Market Update - Q3 2016
JLL Downtown Chicago Office Market Update - Q3 2016
 
St. Louis Office Outlook Q2 2016
St. Louis Office Outlook Q2 2016St. Louis Office Outlook Q2 2016
St. Louis Office Outlook Q2 2016
 
JLL Louisville Office Outlook - Q4 2019
JLL Louisville Office Outlook - Q4 2019JLL Louisville Office Outlook - Q4 2019
JLL Louisville Office Outlook - Q4 2019
 
JLL Grand Rapids Office Insight & Statistics - Q3 2018
JLL Grand Rapids Office Insight & Statistics - Q3 2018JLL Grand Rapids Office Insight & Statistics - Q3 2018
JLL Grand Rapids Office Insight & Statistics - Q3 2018
 
JLL Grand Rapids Office Insight & Statistics - Q4 2019
JLL Grand Rapids Office Insight & Statistics - Q4 2019JLL Grand Rapids Office Insight & Statistics - Q4 2019
JLL Grand Rapids Office Insight & Statistics - Q4 2019
 
JLL Houston Office Report Q4
JLL Houston Office Report Q4JLL Houston Office Report Q4
JLL Houston Office Report Q4
 
JLL Houston Office Market Report - Q4 2018
JLL Houston Office Market Report - Q4 2018JLL Houston Office Market Report - Q4 2018
JLL Houston Office Market Report - Q4 2018
 
JLL Louisville Office Outlook - Q3 2019
JLL Louisville Office Outlook - Q3 2019JLL Louisville Office Outlook - Q3 2019
JLL Louisville Office Outlook - Q3 2019
 
JLL Louisville Office Outlook - Q4 2020
JLL Louisville Office Outlook - Q4 2020JLL Louisville Office Outlook - Q4 2020
JLL Louisville Office Outlook - Q4 2020
 
JLL Louisville Office Outlook - Q3 2018
JLL Louisville Office Outlook - Q3 2018JLL Louisville Office Outlook - Q3 2018
JLL Louisville Office Outlook - Q3 2018
 

Recently uploaded

call girls in Shahdara (DELHI) 🔝 >༒9953330565🔝 genuine Escort Service 🔝✔️✔️
call girls in Shahdara (DELHI) 🔝 >༒9953330565🔝 genuine Escort Service 🔝✔️✔️call girls in Shahdara (DELHI) 🔝 >༒9953330565🔝 genuine Escort Service 🔝✔️✔️
call girls in Shahdara (DELHI) 🔝 >༒9953330565🔝 genuine Escort Service 🔝✔️✔️9953056974 Low Rate Call Girls In Saket, Delhi NCR
 
Rustomjee The Panorama At Pali Hill, Bandra West, Mumbai - Brochure.pdf
Rustomjee The Panorama At Pali Hill, Bandra West, Mumbai - Brochure.pdfRustomjee The Panorama At Pali Hill, Bandra West, Mumbai - Brochure.pdf
Rustomjee The Panorama At Pali Hill, Bandra West, Mumbai - Brochure.pdfmonikasharma630
 
Call Girls In Mayur Vihar-1 Delhi ❤️8860477959 Good Looking Escorts In 24/7 D...
Call Girls In Mayur Vihar-1 Delhi ❤️8860477959 Good Looking Escorts In 24/7 D...Call Girls In Mayur Vihar-1 Delhi ❤️8860477959 Good Looking Escorts In 24/7 D...
Call Girls In Mayur Vihar-1 Delhi ❤️8860477959 Good Looking Escorts In 24/7 D...lizamodels9
 
9990771857 Call Girls in Noida Sector 34 Noida (Call Girls) Delhi
9990771857 Call Girls in Noida Sector 34 Noida (Call Girls) Delhi9990771857 Call Girls in Noida Sector 34 Noida (Call Girls) Delhi
9990771857 Call Girls in Noida Sector 34 Noida (Call Girls) Delhidelhimodel235
 
8 Key Elements for Comfortable Farmland Living
8 Key Elements for Comfortable Farmland Living 8 Key Elements for Comfortable Farmland Living
8 Key Elements for Comfortable Farmland Living Farmland Bazaar
 
Call Girls In Peeragarhi, Delhi↫8447779280↬Call Girls in Peeragarhi Delhi NCR
Call Girls In Peeragarhi, Delhi↫8447779280↬Call Girls in Peeragarhi Delhi NCRCall Girls In Peeragarhi, Delhi↫8447779280↬Call Girls in Peeragarhi Delhi NCR
Call Girls In Peeragarhi, Delhi↫8447779280↬Call Girls in Peeragarhi Delhi NCRasmaqueen5
 
9990771857 Call Girls in Noida Sector 1 Noida (Call Girls) Delhi
9990771857 Call Girls in Noida Sector 1 Noida (Call Girls) Delhi9990771857 Call Girls in Noida Sector 1 Noida (Call Girls) Delhi
9990771857 Call Girls in Noida Sector 1 Noida (Call Girls) Delhidelhimodel235
 
SSPL The Strand Abodes Kharadi Pune Brochure.pdf
SSPL The Strand Abodes Kharadi Pune Brochure.pdfSSPL The Strand Abodes Kharadi Pune Brochure.pdf
SSPL The Strand Abodes Kharadi Pune Brochure.pdfabbu831446
 
Dynamic Netsoft A leader In Property management Software
Dynamic Netsoft A leader In Property management SoftwareDynamic Netsoft A leader In Property management Software
Dynamic Netsoft A leader In Property management SoftwareDynamic Netsoft
 
Managed Farmland Brochures to get more in
Managed Farmland Brochures to get more inManaged Farmland Brochures to get more in
Managed Farmland Brochures to get more inknoxdigital1
 
The Omaxe State Dwarka Delhi-broucher.pdf.pdf
The Omaxe State Dwarka Delhi-broucher.pdf.pdfThe Omaxe State Dwarka Delhi-broucher.pdf.pdf
The Omaxe State Dwarka Delhi-broucher.pdf.pdfkratirudram
 
SVN Live 4.22.24 Weekly Property Broadcast
SVN Live 4.22.24 Weekly Property BroadcastSVN Live 4.22.24 Weekly Property Broadcast
SVN Live 4.22.24 Weekly Property BroadcastSVN International Corp.
 
Namrata 7 Plumeria Drive Pimpri Chinchwad Pune Brochure.pdf
Namrata 7 Plumeria Drive Pimpri Chinchwad Pune Brochure.pdfNamrata 7 Plumeria Drive Pimpri Chinchwad Pune Brochure.pdf
Namrata 7 Plumeria Drive Pimpri Chinchwad Pune Brochure.pdfPrachiRudram
 
Call Girls In Vasundhara Ghaziabad ❤️8860477959 Low Rate Escorts Service In 2...
Call Girls In Vasundhara Ghaziabad ❤️8860477959 Low Rate Escorts Service In 2...Call Girls In Vasundhara Ghaziabad ❤️8860477959 Low Rate Escorts Service In 2...
Call Girls In Vasundhara Ghaziabad ❤️8860477959 Low Rate Escorts Service In 2...lizamodels9
 
Call Girls in Nehru Place Delhi 💯Call Us 🔝8264348440🔝
Call Girls in Nehru Place Delhi 💯Call Us 🔝8264348440🔝Call Girls in Nehru Place Delhi 💯Call Us 🔝8264348440🔝
Call Girls in Nehru Place Delhi 💯Call Us 🔝8264348440🔝soniya singh
 
Low Rate Call Girls in Tughlakabad Delhi Call 9990771857
Low Rate Call Girls in Tughlakabad Delhi Call 9990771857Low Rate Call Girls in Tughlakabad Delhi Call 9990771857
Low Rate Call Girls in Tughlakabad Delhi Call 9990771857delhimodel235
 
Call Girls in Pitampura Delhi 💯Call Us 🔝8264348440🔝
Call Girls in Pitampura Delhi 💯Call Us 🔝8264348440🔝Call Girls in Pitampura Delhi 💯Call Us 🔝8264348440🔝
Call Girls in Pitampura Delhi 💯Call Us 🔝8264348440🔝soniya singh
 

Recently uploaded (20)

call girls in Shahdara (DELHI) 🔝 >༒9953330565🔝 genuine Escort Service 🔝✔️✔️
call girls in Shahdara (DELHI) 🔝 >༒9953330565🔝 genuine Escort Service 🔝✔️✔️call girls in Shahdara (DELHI) 🔝 >༒9953330565🔝 genuine Escort Service 🔝✔️✔️
call girls in Shahdara (DELHI) 🔝 >༒9953330565🔝 genuine Escort Service 🔝✔️✔️
 
Rustomjee The Panorama At Pali Hill, Bandra West, Mumbai - Brochure.pdf
Rustomjee The Panorama At Pali Hill, Bandra West, Mumbai - Brochure.pdfRustomjee The Panorama At Pali Hill, Bandra West, Mumbai - Brochure.pdf
Rustomjee The Panorama At Pali Hill, Bandra West, Mumbai - Brochure.pdf
 
Low Rate Call Girls in Triveni Complex Delhi Call 9873940964
Low Rate Call Girls in Triveni Complex Delhi Call 9873940964Low Rate Call Girls in Triveni Complex Delhi Call 9873940964
Low Rate Call Girls in Triveni Complex Delhi Call 9873940964
 
Call Girls In Mayur Vihar-1 Delhi ❤️8860477959 Good Looking Escorts In 24/7 D...
Call Girls In Mayur Vihar-1 Delhi ❤️8860477959 Good Looking Escorts In 24/7 D...Call Girls In Mayur Vihar-1 Delhi ❤️8860477959 Good Looking Escorts In 24/7 D...
Call Girls In Mayur Vihar-1 Delhi ❤️8860477959 Good Looking Escorts In 24/7 D...
 
9990771857 Call Girls in Noida Sector 34 Noida (Call Girls) Delhi
9990771857 Call Girls in Noida Sector 34 Noida (Call Girls) Delhi9990771857 Call Girls in Noida Sector 34 Noida (Call Girls) Delhi
9990771857 Call Girls in Noida Sector 34 Noida (Call Girls) Delhi
 
9953056974 Low Rate Call Girls In Saket, Delhi NCR
9953056974 Low Rate Call Girls In Saket, Delhi NCR9953056974 Low Rate Call Girls In Saket, Delhi NCR
9953056974 Low Rate Call Girls In Saket, Delhi NCR
 
8 Key Elements for Comfortable Farmland Living
8 Key Elements for Comfortable Farmland Living 8 Key Elements for Comfortable Farmland Living
8 Key Elements for Comfortable Farmland Living
 
Call Girls In Peeragarhi, Delhi↫8447779280↬Call Girls in Peeragarhi Delhi NCR
Call Girls In Peeragarhi, Delhi↫8447779280↬Call Girls in Peeragarhi Delhi NCRCall Girls In Peeragarhi, Delhi↫8447779280↬Call Girls in Peeragarhi Delhi NCR
Call Girls In Peeragarhi, Delhi↫8447779280↬Call Girls in Peeragarhi Delhi NCR
 
9990771857 Call Girls in Noida Sector 1 Noida (Call Girls) Delhi
9990771857 Call Girls in Noida Sector 1 Noida (Call Girls) Delhi9990771857 Call Girls in Noida Sector 1 Noida (Call Girls) Delhi
9990771857 Call Girls in Noida Sector 1 Noida (Call Girls) Delhi
 
SSPL The Strand Abodes Kharadi Pune Brochure.pdf
SSPL The Strand Abodes Kharadi Pune Brochure.pdfSSPL The Strand Abodes Kharadi Pune Brochure.pdf
SSPL The Strand Abodes Kharadi Pune Brochure.pdf
 
Call Girls in Mahavir Nagar whatsaap call US +919953056974
Call Girls in Mahavir Nagar  whatsaap call US  +919953056974Call Girls in Mahavir Nagar  whatsaap call US  +919953056974
Call Girls in Mahavir Nagar whatsaap call US +919953056974
 
Dynamic Netsoft A leader In Property management Software
Dynamic Netsoft A leader In Property management SoftwareDynamic Netsoft A leader In Property management Software
Dynamic Netsoft A leader In Property management Software
 
Managed Farmland Brochures to get more in
Managed Farmland Brochures to get more inManaged Farmland Brochures to get more in
Managed Farmland Brochures to get more in
 
The Omaxe State Dwarka Delhi-broucher.pdf.pdf
The Omaxe State Dwarka Delhi-broucher.pdf.pdfThe Omaxe State Dwarka Delhi-broucher.pdf.pdf
The Omaxe State Dwarka Delhi-broucher.pdf.pdf
 
SVN Live 4.22.24 Weekly Property Broadcast
SVN Live 4.22.24 Weekly Property BroadcastSVN Live 4.22.24 Weekly Property Broadcast
SVN Live 4.22.24 Weekly Property Broadcast
 
Namrata 7 Plumeria Drive Pimpri Chinchwad Pune Brochure.pdf
Namrata 7 Plumeria Drive Pimpri Chinchwad Pune Brochure.pdfNamrata 7 Plumeria Drive Pimpri Chinchwad Pune Brochure.pdf
Namrata 7 Plumeria Drive Pimpri Chinchwad Pune Brochure.pdf
 
Call Girls In Vasundhara Ghaziabad ❤️8860477959 Low Rate Escorts Service In 2...
Call Girls In Vasundhara Ghaziabad ❤️8860477959 Low Rate Escorts Service In 2...Call Girls In Vasundhara Ghaziabad ❤️8860477959 Low Rate Escorts Service In 2...
Call Girls In Vasundhara Ghaziabad ❤️8860477959 Low Rate Escorts Service In 2...
 
Call Girls in Nehru Place Delhi 💯Call Us 🔝8264348440🔝
Call Girls in Nehru Place Delhi 💯Call Us 🔝8264348440🔝Call Girls in Nehru Place Delhi 💯Call Us 🔝8264348440🔝
Call Girls in Nehru Place Delhi 💯Call Us 🔝8264348440🔝
 
Low Rate Call Girls in Tughlakabad Delhi Call 9990771857
Low Rate Call Girls in Tughlakabad Delhi Call 9990771857Low Rate Call Girls in Tughlakabad Delhi Call 9990771857
Low Rate Call Girls in Tughlakabad Delhi Call 9990771857
 
Call Girls in Pitampura Delhi 💯Call Us 🔝8264348440🔝
Call Girls in Pitampura Delhi 💯Call Us 🔝8264348440🔝Call Girls in Pitampura Delhi 💯Call Us 🔝8264348440🔝
Call Girls in Pitampura Delhi 💯Call Us 🔝8264348440🔝
 

JLL Detroit Office Insight & Statistics - Q3 2017

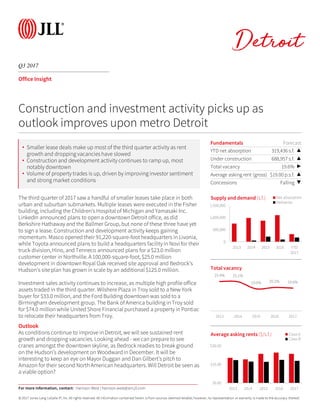
  • 1. © 2017 Jones Lang LaSalle IP, Inc. All rights reserved. All information contained herein is from sources deemedreliable; however, no representation or warranty is made to the accuracy thereof. Q3 2017 Detroit Office Insight The third quarter of 2017 saw a handful of smaller leases take place in both urban and suburban submarkets. Multiple leases were executed in the Fisher building, including the Children’s Hospital of Michigan and Yamasaki Inc. LinkedIn announced plans to open a downtownDetroit office, as did Berkshire Hathaway and the Ballmer Group, but none of these three have yet to sign a lease. Construction and development activity keeps gaining momentum. Masco opened their 91,220-square-footheadquarters in Livonia, while Toyota announced plans to build a headquarters facility in Novi for their truck division, Hino, and Tenneco announced plans for a $23.0 million customer center in Northville. A 100,000-square-foot,$25.0 million development in downtownRoyal Oak received site approval and Bedrock’s Hudson’s site plan has grown in scale by an additional $125.0 million. Investment sales activity continues to increase, as multiple high profile office assets traded in the third quarter. Wilshere Plaza in Troy sold to a New York buyer for $33.0 million, and the Ford Building downtownwas sold to a Birmingham development group. The Bank of America building in Troy sold for $74.0 million while United Shore Financial purchased a property in Pontiac to relocate their headquarters from Troy. Outlook As conditions continue to improve in Detroit, we will see sustained rent growth and dropping vacancies. Looking ahead - we can prepare to see cranes amongst the downtownskyline, as Bedrock readies to break ground on the Hudson’s development on Woodward in December. It will be interesting to keep an eye on Mayor Duggan and Dan Gilbert’s pitch to Amazon for their second North American headquarters. Will Detroit be seen as a viable option? Fundamentals Forecast YTD net absorption 319,436 s.f. ▲ Under construction 688,957 s.f. ▲ Total vacancy 19.6% ▶ Average asking rent (gross) $19.00 p.s.f. ▲ Concessions Falling ▼ 0 500,000 1,000,000 1,500,000 2013 2014 2015 2016 YTD 2017 Supply and demand (s.f.) Net absorption Deliveries Construction and investment activity picks up as outlook improves upon metro Detroit 25.4% 25.1% 19.0% 20.2% 19.6% 2013 2014 2015 2016 2017 Total vacancy $0.00 $15.00 $30.00 2013 2014 2015 2016 2017 Average asking rents ($/s.f.) Class A Class B For more information, contact: Harrison West | harrison.west@am.jll.com • Smaller lease deals make up most of the third quarter activity as rent growth and dropping vacancies have slowed • Construction and development activity continues to ramp up, most notably downtown • Volume of property trades is up, driven by improving investor sentiment and strong market conditions
  • 2. © 2017 Jones Lang LaSalle IP, Inc. All rights reserved. All information contained herein is from sources deemedreliable; however, no representation or warranty is made to the accuracy thereof. Q3 2017 Detroit Office Statistics For more information, contact: Harrison West | harrison.west@am.jll.com Class Inventory (s.f.) Total net absorption (s.f.) YTD total net absorption (s.f.) YTD total net absorption (% ofstock) Direct vacancy (%) Total vacancy (%) Average direct asking rent ($ p.s.f.) YTD completions (s.f.) Under construction (s.f.) CBD Totals 13,317,209 93,779 34,887 0.3% 12.7% 13.1% $21.12 0 227,430 New Center Totals 1,142,100 34,130 18,335 1.6% 22.3% 22.3% $18.84 0 0 Urban Totals 14,459,309 127,909 53,222 0.4% 13.5% 13.9% $20.82 0 227,430 Birmingham/Bloomfield Totals 3,979,668 -11,490 23,707 0.6% 11.2% 15.7% $25.27 0 0 Dearborn Totals 2,705,625 -4,218 186,324 6.9% 26.9% 27.1% $16.79 0 150,000 Downriver Totals 483,907 19,360 3,007 0.6% 40.1% 40.1% $14.70 0 0 Farmington/Farmington Hills Totals 4,658,516 -26,061 -8,402 -0.2% 17.4% 17.4% $18.76 0 30,000 Macomb Totals 1,286,875 -26,204 -30,242 -2.4% 21.5% 21.5% $17.23 0 0 Northern I-275 Corridor Totals 4,467,691 118,859 168,160 3.8% 9.4% 10.4% $18.64 180,000 152,527 North Oakland Totals 2,845,648 37,323 -171,056 -6.0% 20.8% 21.4% $19.37 0 0 Royal Oak/Southeast Oakland Totals 706,710 -38 -2,513 -0.4% 7.1% 7.1% $15.70 0 129,000 Southern I-275 Corridor Totals 1,077,525 4,600 4,600 0.4% 0.0% 0.0% NA 0 0 Southfield Totals 13,595,696 -50,516 -37,807 -0.3% 29.2% 30.9% $18.09 0 0 Troy Totals 11,003,062 -22,392 123,580 1.1% 22.8% 23.2% $18.25 0 0 Washtenaw Totals 6,613,772 -46,497 6,856 0.1% 10.6% 11.5% $22.36 0 0 Suburbs Totals 53,424,695 -7,274 266,214 0.5% 20.0% 21.1% $18.67 180,000 461,527 Detroit Totals 67,884,004 120,635 319,436 0.5% 18.6% 19.6% $19.00 180,000 688,957 CBD A 6,194,714 93,318 27,549 0.4% 8.2% 9.1% $22.70 0 227,430 Urban A 6,194,714 93,318 27,549 0.4% 8.2% 9.1% $22.70 0 227,430 Birmingham/Bloomfield A 1,569,497 6,417 21,798 1.4% 11.5% 22.4% $27.21 0 0 Dearborn A 446,890 0 1,619 0.4% 10.9% 10.9% $27.50 0 150,000 Farmington/Farmington Hills A 618,109 -14,109 -14,109 -2.3% 15.3% 15.3% $23.92 0 0 Macomb A 295,494 4,411 11,712 4.0% 1.6% 1.6% $19.32 0 0 Northern I-275 Corridor A 1,113,719 -635 -2,472 -0.2% 6.5% 7.6% $19.06 180,000 75,980 North Oakland A 488,665 17,142 -6,915 -1.4% 24.2% 24.2% $21.02 0 0 Southern I-275 Corridor A 832,753 0 0 0.0% 0.0% 0.0% NA 0 0 Southfield A 2,970,217 38,680 -19,313 -0.7% 25.1% 25.7% $23.24 0 0 Troy A 1,924,131 44,722 -21,724 -1.1% 18.0% 18.8% $24.96 0 0 Washtenaw A 3,218,983 -334 17,094 0.5% 11.3% 12.9% $23.78 0 0 Suburbs A 13,478,458 96,294 -12,310 -0.1% 14.7% 16.6% $23.84 180,000 225,980 Detroit A 19,673,172 189,612 15,239 0.1% 12.6% 14.3% $23.61 180,000 453,410 CBD B 7,122,495 461 7,338 0.1% 16.7% 16.7% $20.33 0 0 New Center B 1,142,100 34,130 18,335 1.6% 22.3% 22.3% $18.84 0 0 Urban B 8,264,595 34,591 25,673 0.3% 17.5% 17.5% $20.06 0 0 Birmingham/Bloomfield B 2,410,171 -17,907 1,909 0.1% 11.1% 11.3% $23.85 0 0 Dearborn B 2,258,735 -4,218 184,705 8.2% 30.0% 30.3% $16.04 0 0 Downriver B 483,907 19,360 3,007 0.6% 40.1% 40.1% $14.70 0 0 Farmington/Farmington Hills B 4,040,407 -11,952 5,707 0.1% 17.8% 17.8% $18.16 0 30,000 Macomb B 991,381 -30,615 -41,954 -4.2% 27.5% 27.5% $17.18 0 0 Northern I-275 Corridor B 3,353,972 119,494 170,632 5.1% 10.3% 11.3% $18.56 0 76,547 North Oakland B 2,356,983 20,181 -164,141 -7.0% 20.1% 20.8% $18.96 0 0 Royal Oak/Southeast Oakland B 706,710 -38 -2,513 -0.4% 7.1% 7.1% $15.70 0 129,000 Southern I-275 Corridor B 244,772 4,600 4,600 1.9% 0.0% 0.0% NA 0 0 Southfield B 10,625,479 -89,196 -18,494 -0.2% 30.3% 32.4% $16.92 0 0 Troy B 9,078,931 -67,114 145,304 1.6% 23.8% 24.1% $17.34 0 0 Washtenaw B 3,394,789 -46,163 -10,238 -0.3% 9.8% 10.2% $20.74 0 0 Suburbs B 39,946,237 -103,568 278,524 0.7% 21.8% 22.6% $17.55 0 235,547 Detroit B 48,210,832 -68,977 304,197 0.6% 21.1% 21.7% $17.90 0 235,547