Austin Office Market Sees Positive Absorption and Rising Rates in Q3 2021
•
0 likes•101 views

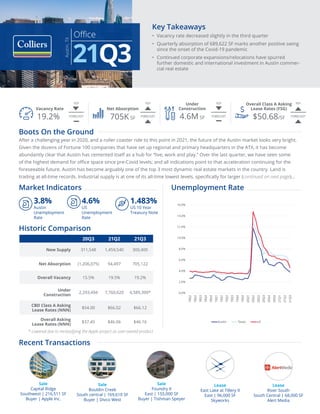
The document summarizes commercial real estate market trends in Austin, TX in Q3 2021. Key points include: - Vacancy rates decreased slightly to 19.2% while net absorption was positive at 705K SF - Strong demand driven by corporate expansions and relocations is fueling investment in Austin commercial real estate - Average citywide lease rates increased slightly to $46.16/SF, with higher rates in prime locations - Over 4.5M SF of new construction is underway to meet continuing strong demand in the market

Recommended
Recommended
More Related Content
What's hot
What's hot (20)
Similar to Austin Office Market Sees Positive Absorption and Rising Rates in Q3 2021
Similar to Austin Office Market Sees Positive Absorption and Rising Rates in Q3 2021 (20)
More from Colliers International | Houston
More from Colliers International | Houston (20)
Recently uploaded
Recently uploaded (20)
Austin Office Market Sees Positive Absorption and Rising Rates in Q3 2021
- 1. 20Q3 21Q2 21Q3 New Supply 311,548 1,459,540 300,400 Net Absorption (1,206,075) 94,497 705,122 Overall Vacancy 15.5% 19.5% 19.2% Under Construction 2,293,494 7,760,620 4,589,300* CBD Class A Asking Lease Rates (NNN) $54.00 $66.02 $66.12 Overall Asking Lease Rates (NNN) $37.45 $46.06 $46.16 Sale Capital Ridge Southwest | 216,511 SF Buyer | Apple Inc. Lease East Lake at Tillery II East | 96,000 SF Skyworks Lease River South South Central | 68,000 SF Alert Media Sale Bouldin Creek South central | 169,610 SF Buyer | Divco West Sale Foundry II East | 155,000 SF Buyer | Tishman Speyer YOY FORECAST YOY YOY FORECAST YOY FORECAST FORECAST Office Austin, TX 21Q3 * Lowered due to reclassifying the Apple project as user-owned product Boots On the Ground After a challenging year in 2020, and a roller coaster ride to this point in 2021, the future of the Austin market looks very bright. Given the dozens of Fortune 100 companies that have set up regional and primary headquarters in the ATX, it has become abundantly clear that Austin has cemented itself as a hub for “live, work and play.” Over the last quarter, we have seen some of the highest demand for office space since pre-Covid levels; and all indications point to that acceleration continuing for the foreseeable future. Austin has become arguably one of the top 3 most dynamic real estate markets in the country. Land is trading at all-time records. Industrial supply is at one of its all-time lowest levels, specifically for larger (continued on next page)... Unemployment Rate Market Indicators Historic Comparison 3.8% Austin Unemployment Rate 1.483% US 10 Year Treasury Note 4.6% US Unemployment Rate Vacancy Rate 19.2% Net Absorption 705K SF Overall Class A Asking Lease Rates (FSG) $50.68/SF Under Construction 4.6M SF Key Takeaways • Vacancy rate decreased slightly in the third quarter • Quarterly absorption of 689,622 SF marks another positive swing since the onset of the Covid-19 pandemic • Continued corporate expansions/relocations have spurred further domestic and international investment in Austin commer- cial real estate Recent Transactions 0.0% 2.0% 4.0% 6.0% 8.0% 10.0% 12.0% 14.0% 16.0% 18Q2 18Q2 18Q3 18Q4 18Q4 19Q1 19Q2 19Q2 19Q3 19Q4 19Q4 20Q1 20Q2 20Q2 20Q3 20Q4 20Q4 21Q1 21Q2 21Q3 Austin Texas US
- 2. Colliers | Austin | 21Q3 | Office Report Office Austin, TX 21Q3 Sublease Environment 45% 1% 0% 3% 4% 3% 23% 2% 19% CBD Central & West Central East North/Domain Northeast Far Northwest Northwest South Southwest 20Q3 21Q2 21Q3 CBD 394,195 911,991 745,866 Central & West Central 51,960 57,710 17,132 East 107,205 60,234 8,805 North/Domain 27,426 64,406 57,068 Northeast 119,636 105,886 74,130 Far Northwest 94,394 53,987 42,232 Northwest 404,236 492,082 376,815 South 30,631 29,877 21,599 Southwest 256,816 334,086 308,121 TOTAL 1,486,499 2,110,259 1,651,768 Boots on the Ground continued The Market, at a Glance Office tour activity generally improved in the third quarter; most notably the size of prospect requirements increased. We are now seeing more tours with larger users that seem to be real requirements ready to commit to leases. We recently compiled a list that included over 12 unique 100+ sf office users touring properties throughout the city. The length of desired lease term is still below the historical average as many prospects look for shorter team deals in order to provide flexibility due to unknowns in the return to the office. Construction pricing has started to increase due to lack of subs combined with higher demand, and construction timelines have elongated due to a slowdown on permitting combined with supply chain challenges. We expect overall market conditions to improve as the Q3 spike in Covid cases subsides and companies can once again start to think about a return to the office. Future Forecast Barring any major setbacks on a national level, or a resurgence of Covid, we feel the Austin buzz will continue for the foreseeable future. Companies that have been slowly having conversations with Landlords for the past twelve months are quickly turning into more normalized tours, negotiations, and executed leases. The sheer number of significant requirements considering new locations and expansion in Austin are such that if only a reasonable portion of those deals make, it will continue to strengthen the market. We expect office rates to remain mostly flat overall with continued increases in prime/in-demand locations, and we expect for pricing on capital markets (building sales) to remain high due to lack of quality product on the market and flight to the asset class. ...blocks; and new construction is being leased at a pace previously unseen. Texas is open for business, and we don’t see that changing anytime soon.
- 3. Colliers | Austin | 21Q3 | Office Report Office Austin, TX 21Q3 0.0% 5.0% 10.0% 15.0% 20.0% 25.0% $0.00 $10.00 $20.00 $30.00 $40.00 $50.00 $60.00 $70.00 Q2 2020 Q3 2020 Q4 2020 Q1 2021 Q2 2021 Q3 2021 CBD Citywide Total Vacancy Notable Q3 2021 Completions (1,500,000) (1,000,000) (500,000) 0 500,000 1,000,000 1,500,000 2,000,000 Q2 2020 Q3 2020 Q1 2021 Q2 2021 Q3 2021 Deliveries Net Absorption 300 Colorado 368,798 | CBD Cousins Properties 405 Colorado 204,108 | CBD Brandywine Realty Trust Supply & Absorption The Austin economy continues its upward swing, as less subleases hit the market and pent-up demand has driven more significant executed leases. New deliveries in Q3 were 300,402 SF. Absorption of 689,622 SF was recorded in 21’Q3, marking the third quarter with positive levels; an extreme uptick in hires by high-tech tenants during Covid, coupled with a continued robust relocation & expansion trend, will likely stimulate a continued upwards trend in absorption. These trends are creating some cautiously optimistic views by developers, who are scheduled to complete 4,450,101 SF of new construction over the next few years. Direct Lease Rates The 21’Q3 average citywide asking rate of $46.16/SF slightly exceeds the previous quarter’s rate of $46.06/SF, a bump that continues to be attributed to an abundance of recently completed Class-A office space in conjunction with growing operating expenses. With more and more high-quality product hitting the market, combined with a continuation of increasing demand by occupiers, it’s more likely that rates continue to trend higher.
- 4. Colliers | Austin | 21Q3 | Office Report Office Austin, TX 21Q3 Upcoming Projects Citywide Construction 43% 25% 27% 2% 3% East South Domain Round Rock Northwest Q3 2021 Expected Deliveries Domain Tower II HPI 320,500 SF | Domain Q4 2021 Delivery 0% Leased RiverSouth Stream Realty Partners 350,661 SF | South Q4 2021 Delivery 41% Leased Eastbound Lincoln Property Group 233,577 SF | East Q4 2021 Delivery 0% Leased Centro South Riverside Resources 164,155 SF |East Q4 2021 Delivery 100% Leased 0 200,000 400,000 600,000 800,000 1,000,000 1,200,000 1,400,000 1,600,000 1,800,000 2,000,000 Q4 2021 2022 2023 Leased Expected Deliveries
- 5. Copyright © 2021 Colliers The information contained herein has been obtained from sources deemed reliable. While every reasonable effort has been made to ensure its accuracy, we cannot guarantee it. No responsibility is assumed for any inaccuracies. Readers are encouraged to consult their professional advisors prior to acting on any of the material contained in this report. FOR MORE INFORMATION John O’Sullivan Research Associate Austin +1 512 539 3012 john.o’sullivan@colliers.com David Bremer, SIOR Managing Director Austin +1 512 539 3014 david.bremer@colliers.com Submarket Existing Inventory (SF) Direct Vacancy (SF) Sublease Vacancy (SF) Overall Vacancy Rate Quarterly Net Absorption (SF) Weighted Average Asking Rate Downtown CBD 13,148,572 1,690,829 745,866 18.5% 417,352 $61.79 TOTAL 13,148,572 1,690,829 745,866 18.5% 417,352 $61.79 Market Total CBD 13,148,572 1,690,829 745,866 18.5% 417,352 $61.79 Suburban 52,117,964 9,132,727 954,593 19.4% 272,270 $42.65 TOTAL 65,266,536 10,823,556 1,700,459 19.2% 689,622 $46.16 Suburban Central & West Central 3,512,125 507,162 17,132 14.9% 101,850 $48.22 East 3,799,574 1,300,073 8,805 34.4% 162,439 $56.63 North / Domain 7,404,375 911,082 57,068 13.1% (84,995) $39.68 Northeast 2,965,542 518,971 74,130 20.0% 51,382 $36.66 Far Northwest 3,755,456 566,249 42,323 16.2% (25,862) $40.16 Northwest 13,215,204 2,976,276 364,815 25.3% 195,773 $38.98 Round Rock 1,515,562 213,203 18,327 15.3% 24,773 $34.26 South 2,362,734 468,755 21,599 20.8% 14,330 $51.83 Southeast 3,174,828 287,279 42,273 10.4% (36,035) $35.19 Southwest 10,412,564 1,383,677 308,121 16.2% (131,385) $44.88 TOTAL 52,117,964 9,132,727 954,593 19.4% 272,270 $42.65 Austin | Q3 2021 | Office | Market Statistics