SlideShare a Scribd company logo
1 of 2
Download to read offline
© 2019 Jones Lang LaSalle IP, Inc. All rights reserved. All information contained herein is from sources deemed reliable; however, no representation or warranty is made to the accuracy thereof.
Q4 2019
Industrial Insight
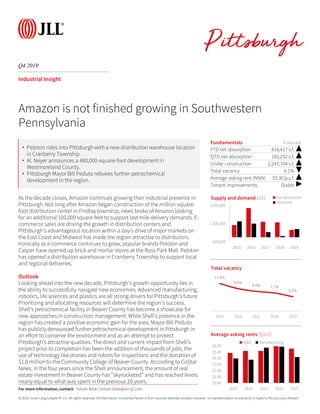
As the decade closes, Amazon continues growing their industrial presence in
Pittsburgh. Not long after Amazon began construction of the million-square-
foot distribution center in Findlay township, news broke of Amazon looking
for an additional 100,000 square feet to support last mile delivery demands. E-
commerce sales are driving the growth in distribution centers and
Pittsburgh’s advantageous location within a day’s drive of major markets on
the East Coast and Midwest has made the region attractive to distributors.
Ironically as e-commerce continues to grow, popular brands Peloton and
Casper have opened up brick and mortar stores at the Ross Park Mall. Peloton
has opened a distribution warehouse in Cranberry Township to support local
and regional deliveries.
Outlook
Looking ahead into the new decade, Pittsburgh’s growth opportunity lies in
the ability to successfully navigate new economies. Advanced manufacturing,
robotics, life sciences and plastics are all strong drivers for Pittsburgh’s future.
Prioritizing and allocating resources will determine the region’s success.
Shell’s petrochemical facility in Beaver County has become a showcase for
new approaches in construction management. While Shell’s presence in the
region has created a positive economic gain for the area, Mayor Bill Peduto
has publicly denounced further petrochemical development in Pittsburgh in
an effort to conserve the environment and as an attempt to protect
Pittsburgh’s attractive qualities. The direct and current impact from Shell’s
project prior to completion has been the addition of thousands of jobs, the
use of technology like drones and robots for inspections and the donation of
$1.0 million to the Community College of Beaver County. According to CoStar
News, in the four years since the Shell announcement, the amount of real
estate investment in Beaver County has “skyrocketed” and has reached levels
nearly equal to what was spent in the previous 20 years.
Fundamentals Forecast
YTD net absorption 818,417 s.f. ▲
QTD net absorption 165,292 s.f. ▲
Under construction 2,247,704 s.f. ▲
Total vacancy 6.1% ▼
Average asking rent (NNN) $5.30 p.s.f. ▲
Tenant improvements Stable ▶
-500,000
1,500,000
3,500,000
2015 2016 2017 2018 2019
Supply and demand (s.f.) Net absorption
Deliveries
Amazon is not finished growing in Southwestern
Pennsylvania
11.8%
9.6%
8.4% 7.7%
6.1%
2015 2016 2017 2018 2019
Total vacancy
For more information, contact: Tobiah Bilski | tobiah.bilski@am.jll.com
• Peloton rides into Pittsburgh with a new distribution warehouse location
in Cranberry Township.
• Al. Neyer announces a 480,000-square-foot development in
Westmoreland County.
• Pittsburgh Mayor Bill Peduto rebukes further petrochemical
development in the region.
$0.00
$1.00
$2.00
$3.00
$4.00
$5.00
$6.00
2015 2016 2017 2018 2019
Average asking rents ($/s.f.)
W&D Manufacturing
© 2019 Jones Lang LaSalle IP, Inc. All rights reserved. All information contained herein is from sources deemed reliable; however, no representation or warranty is made to the accuracy thereof.
Inventory (s.f.)
Quarterly total
net absorption
(s.f.)
YTD total net
absorption (s.f.)
YTD total net
absorption (%
of stock)
Total vacancy
(%)
Total
availability
(%)
Average
total asking
rent ($
p.s.f.)
Quarterly
Completions
(s.f.)
YTD
Completions
(s.f.)
Under
construction (s.f.)
Pittsburgh total
Warehouse & Distribution 88,637,537 47,243 816,837 0.9% 5.8% 7.9% $5.56 286,387 898,286 2,247,704
Manufacturing 53,869,017 118,049 1,580 0.0% 6.5% 7.7% $4.19 0 0 0
Totals 142,601,554 165,292 818,417 0.6% 6.1% 7.9% $5.30 286,387 898,286 2,247,704
Beaver County
Warehouse & Distribution 5,497,234 -20,140 -184,287 -3.4% 10.8% 17.1% $4.84 0 0 651,000
Manufacturing 4,358,833 25,000 75,044 1.7% 10.5% 9.3% $3.50 0 0 0
Totals 9,856,067 4,860 -109,243 -1.1% 10.7% 13.9% $4.60 0 0 651,000
Butler County
Warehouse & Distribution 4,136,199 90,592 -63,425 -1.5% 17.5% 20.6% $4.58 220,000 0 0
Manufacturing 3,561,575 0 509 0.0% 7.4% 10.1% $2.56 0 0 0
Totals 7,697,774 90,592 -62,916 -0.8% 12.8% 15.8% $3.95 220,000 0 0
Downtown
Warehouse & Distribution 18,373,235 -6,234 -212,709 -1.2% 4.2% 4.7% $10.20 0 0 0
Manufacturing 4,643,481 -8,153 -10,009 -0.2% 1.3% 3.9% $0.00 0 0 0
Totals 23,031,716 -14,387 -222,718 -1.0% 3.6% 4.6% $10.20 0 0 0
East
Warehouse & Distribution 5,969,910 59,518 117,239 2.0% 3.8% 5.9% $4.50 0 0 0
Manufacturing 3,637,199 29,000 11,500 0.3% 5.7% 5.7% $3.50 0 0 0
Totals 9,607,109 88,518 128,739 1.3% 4.5% 5.8% $4.09 0 0 0
Northeast
Warehouse & Distribution 6,086,164 0 77,495 1.3% 2.3% 2.9% $6.08 0 0 0
Manufacturing 6,880,307 0 -231,000 -3.4% 5.3% 5.3% $0.00 0 0 0
Totals 12,966,471 0 -153,505 -1.2% 3.9% 4.1% $6.08 0 0 0
Northwest
Warehouse & Distribution 10,525,275 -35,626 -42,216 -0.4% 3.2% 6.2% $8.52 0 0 0
Manufacturing 3,063,621 79,825 128,108 4.2% 0.3% 0.3% $0.00 0 0 0
Totals 13,588,896 44,199 85,892 0.6% 2.5% 4.9% $8.52 0 0 0
South
Warehouse & Distribution 5,521,847 -21,500 -205,569 -3.7% 7.4% 9.0% $5.77 0 0 0
Manufacturing 7,892,472 4,000 -97,929 -1.2% 5.1% 5.1% $6.18 0 0 0
Totals 13,414,319 -17,500 -303,498 -2.3% 6.1% 6.7% $6.04 0 0 0
Washington County
Warehouse & Distribution 6,589,531 17,786 571,061 8.7% 10.6% 16.5% $4.96 0 535,249 0
Manufacturing 4,736,380 -37,273 48,402 1.0% 2.4% 2.4% $3.90 0 0 0
Totals 11,325,911 -19,487 619,463 5.5% 7.2% 10.6% $4.86 0 535,249 0
West
Warehouse & Distribution 11,518,528 16,727 670,496 5.8% 3.0% 4.6% $6.30 66,387 325,537 1,596,704
Manufacturing 2,706,639 -12,000 15,705 0.6% 2.5% 4.5% $0.00 0 0 0
Totals 14,225,167 4,727 686,201 4.8% 2.9% 4.6% $6.30 66,387 325,537 1,596,704
Westmoreland County
Warehouse & Distribution 14,419,614 -53,880 88,752 0.6% 6.1% 7.2% $4.80 0 37,500 0
Manufacturing 12,388,510 37,650 61,250 0.5% 12.7% 16.1% $6.60 0 0 0
Totals 26,888,124 -16,230 150,002 0.6% 9.3% 11.4% $5.28 0 37,500 0
Q4 2019
Industrial Statistics
For more information, contact: Tobiah Bilski | tobiah.bilski@am.jll.com

More Related Content

What's hot

JLL Pittsburgh Office Insight & Statistics - Q3 2021
JLL Pittsburgh Office Insight & Statistics - Q3 2021JLL Pittsburgh Office Insight & Statistics - Q3 2021
JLL Pittsburgh Office Insight & Statistics - Q3 2021Tobiah Bilski
 
JLL Pittsburgh Industrial Insight & Statistics - Q3 2017
JLL Pittsburgh Industrial Insight & Statistics - Q3 2017JLL Pittsburgh Industrial Insight & Statistics - Q3 2017
JLL Pittsburgh Industrial Insight & Statistics - Q3 2017Tobiah Bilski
 
JLL West Michigan Industrial Insight & Statistics - Q2 2019
JLL West Michigan Industrial Insight & Statistics - Q2 2019JLL West Michigan Industrial Insight & Statistics - Q2 2019
JLL West Michigan Industrial Insight & Statistics - Q2 2019Harrison West
 
JLL - Tampa Bay 2018 Q2 Industrial Outlook
JLL - Tampa Bay 2018 Q2 Industrial OutlookJLL - Tampa Bay 2018 Q2 Industrial Outlook
JLL - Tampa Bay 2018 Q2 Industrial OutlookKyle Koller
 
JLL West Michigan Industrial Insight & Statistics - Q1 2019
JLL West Michigan Industrial Insight & Statistics - Q1 2019JLL West Michigan Industrial Insight & Statistics - Q1 2019
JLL West Michigan Industrial Insight & Statistics - Q1 2019Harrison West
 
JLL Pittsburgh Industrial Insight & Statistics - Q2 2020
JLL Pittsburgh Industrial Insight & Statistics - Q2 2020JLL Pittsburgh Industrial Insight & Statistics - Q2 2020
JLL Pittsburgh Industrial Insight & Statistics - Q2 2020Tobiah Bilski
 
JLL - Tampa Bay 2018 Q1 Industrial Outlook
JLL - Tampa Bay 2018 Q1 Industrial OutlookJLL - Tampa Bay 2018 Q1 Industrial Outlook
JLL - Tampa Bay 2018 Q1 Industrial OutlookKyle Koller
 
JLL Pittsburgh Industrial Insight & Statistics - Q2 2019
JLL Pittsburgh Industrial Insight & Statistics - Q2 2019JLL Pittsburgh Industrial Insight & Statistics - Q2 2019
JLL Pittsburgh Industrial Insight & Statistics - Q2 2019Tobiah Bilski
 
JLL Pittsburgh Industrial Insight & Statistics - Q4 2016
JLL Pittsburgh Industrial Insight & Statistics - Q4 2016JLL Pittsburgh Industrial Insight & Statistics - Q4 2016
JLL Pittsburgh Industrial Insight & Statistics - Q4 2016Tobiah Bilski
 
JLL Pittsburgh Industrial Insight & Statistics - Q3 2020
JLL Pittsburgh Industrial Insight & Statistics - Q3 2020JLL Pittsburgh Industrial Insight & Statistics - Q3 2020
JLL Pittsburgh Industrial Insight & Statistics - Q3 2020Tobiah Bilski
 
JLL Detroit Industrial Insight & Statistics - Q4 2019
JLL Detroit Industrial Insight & Statistics - Q4 2019JLL Detroit Industrial Insight & Statistics - Q4 2019
JLL Detroit Industrial Insight & Statistics - Q4 2019Harrison West
 
JLL Pittsburgh Office Insight & Statistics - Q2 2021
JLL Pittsburgh Office Insight & Statistics - Q2 2021JLL Pittsburgh Office Insight & Statistics - Q2 2021
JLL Pittsburgh Office Insight & Statistics - Q2 2021Tobiah Bilski
 
JLL Pittsburgh Office Outlook - Q4 2015
JLL Pittsburgh Office Outlook - Q4 2015JLL Pittsburgh Office Outlook - Q4 2015
JLL Pittsburgh Office Outlook - Q4 2015Andrew Batson
 
JLL Pittsburgh Office Insight & Statistics - Q3 2017
JLL Pittsburgh Office Insight & Statistics - Q3 2017JLL Pittsburgh Office Insight & Statistics - Q3 2017
JLL Pittsburgh Office Insight & Statistics - Q3 2017Tobiah Bilski
 
JLL West Michigan Industrial Insight & Statistics - Q4 2019
JLL West Michigan Industrial Insight & Statistics - Q4 2019JLL West Michigan Industrial Insight & Statistics - Q4 2019
JLL West Michigan Industrial Insight & Statistics - Q4 2019Harrison West
 
JLL West Michigan Industrial Insight & Statistics - Q3 2019
JLL West Michigan Industrial Insight & Statistics - Q3 2019JLL West Michigan Industrial Insight & Statistics - Q3 2019
JLL West Michigan Industrial Insight & Statistics - Q3 2019Harrison West
 
JLL Detroit Industrial Insight & Statistics - Q2 2017
JLL Detroit Industrial Insight & Statistics - Q2 2017JLL Detroit Industrial Insight & Statistics - Q2 2017
JLL Detroit Industrial Insight & Statistics - Q2 2017Harrison West
 
JLL West Michigan Industrial Insight & Statistics - Q2 2018
JLL West Michigan Industrial Insight & Statistics - Q2 2018JLL West Michigan Industrial Insight & Statistics - Q2 2018
JLL West Michigan Industrial Insight & Statistics - Q2 2018Harrison West
 
JLL Detroit Industrial Insight & Statistics - Q3 2017
JLL Detroit Industrial Insight & Statistics - Q3 2017JLL Detroit Industrial Insight & Statistics - Q3 2017
JLL Detroit Industrial Insight & Statistics - Q3 2017Harrison West
 
JLL Detroit Industrial Insight & Statistics - Q1 2019
JLL Detroit Industrial Insight & Statistics - Q1 2019JLL Detroit Industrial Insight & Statistics - Q1 2019
JLL Detroit Industrial Insight & Statistics - Q1 2019Harrison West
 

What's hot (20)

JLL Pittsburgh Office Insight & Statistics - Q3 2021
JLL Pittsburgh Office Insight & Statistics - Q3 2021JLL Pittsburgh Office Insight & Statistics - Q3 2021
JLL Pittsburgh Office Insight & Statistics - Q3 2021
 
JLL Pittsburgh Industrial Insight & Statistics - Q3 2017
JLL Pittsburgh Industrial Insight & Statistics - Q3 2017JLL Pittsburgh Industrial Insight & Statistics - Q3 2017
JLL Pittsburgh Industrial Insight & Statistics - Q3 2017
 
JLL West Michigan Industrial Insight & Statistics - Q2 2019
JLL West Michigan Industrial Insight & Statistics - Q2 2019JLL West Michigan Industrial Insight & Statistics - Q2 2019
JLL West Michigan Industrial Insight & Statistics - Q2 2019
 
JLL - Tampa Bay 2018 Q2 Industrial Outlook
JLL - Tampa Bay 2018 Q2 Industrial OutlookJLL - Tampa Bay 2018 Q2 Industrial Outlook
JLL - Tampa Bay 2018 Q2 Industrial Outlook
 
JLL West Michigan Industrial Insight & Statistics - Q1 2019
JLL West Michigan Industrial Insight & Statistics - Q1 2019JLL West Michigan Industrial Insight & Statistics - Q1 2019
JLL West Michigan Industrial Insight & Statistics - Q1 2019
 
JLL Pittsburgh Industrial Insight & Statistics - Q2 2020
JLL Pittsburgh Industrial Insight & Statistics - Q2 2020JLL Pittsburgh Industrial Insight & Statistics - Q2 2020
JLL Pittsburgh Industrial Insight & Statistics - Q2 2020
 
JLL - Tampa Bay 2018 Q1 Industrial Outlook
JLL - Tampa Bay 2018 Q1 Industrial OutlookJLL - Tampa Bay 2018 Q1 Industrial Outlook
JLL - Tampa Bay 2018 Q1 Industrial Outlook
 
JLL Pittsburgh Industrial Insight & Statistics - Q2 2019
JLL Pittsburgh Industrial Insight & Statistics - Q2 2019JLL Pittsburgh Industrial Insight & Statistics - Q2 2019
JLL Pittsburgh Industrial Insight & Statistics - Q2 2019
 
JLL Pittsburgh Industrial Insight & Statistics - Q4 2016
JLL Pittsburgh Industrial Insight & Statistics - Q4 2016JLL Pittsburgh Industrial Insight & Statistics - Q4 2016
JLL Pittsburgh Industrial Insight & Statistics - Q4 2016
 
JLL Pittsburgh Industrial Insight & Statistics - Q3 2020
JLL Pittsburgh Industrial Insight & Statistics - Q3 2020JLL Pittsburgh Industrial Insight & Statistics - Q3 2020
JLL Pittsburgh Industrial Insight & Statistics - Q3 2020
 
JLL Detroit Industrial Insight & Statistics - Q4 2019
JLL Detroit Industrial Insight & Statistics - Q4 2019JLL Detroit Industrial Insight & Statistics - Q4 2019
JLL Detroit Industrial Insight & Statistics - Q4 2019
 
JLL Pittsburgh Office Insight & Statistics - Q2 2021
JLL Pittsburgh Office Insight & Statistics - Q2 2021JLL Pittsburgh Office Insight & Statistics - Q2 2021
JLL Pittsburgh Office Insight & Statistics - Q2 2021
 
JLL Pittsburgh Office Outlook - Q4 2015
JLL Pittsburgh Office Outlook - Q4 2015JLL Pittsburgh Office Outlook - Q4 2015
JLL Pittsburgh Office Outlook - Q4 2015
 
JLL Pittsburgh Office Insight & Statistics - Q3 2017
JLL Pittsburgh Office Insight & Statistics - Q3 2017JLL Pittsburgh Office Insight & Statistics - Q3 2017
JLL Pittsburgh Office Insight & Statistics - Q3 2017
 
JLL West Michigan Industrial Insight & Statistics - Q4 2019
JLL West Michigan Industrial Insight & Statistics - Q4 2019JLL West Michigan Industrial Insight & Statistics - Q4 2019
JLL West Michigan Industrial Insight & Statistics - Q4 2019
 
JLL West Michigan Industrial Insight & Statistics - Q3 2019
JLL West Michigan Industrial Insight & Statistics - Q3 2019JLL West Michigan Industrial Insight & Statistics - Q3 2019
JLL West Michigan Industrial Insight & Statistics - Q3 2019
 
JLL Detroit Industrial Insight & Statistics - Q2 2017
JLL Detroit Industrial Insight & Statistics - Q2 2017JLL Detroit Industrial Insight & Statistics - Q2 2017
JLL Detroit Industrial Insight & Statistics - Q2 2017
 
JLL West Michigan Industrial Insight & Statistics - Q2 2018
JLL West Michigan Industrial Insight & Statistics - Q2 2018JLL West Michigan Industrial Insight & Statistics - Q2 2018
JLL West Michigan Industrial Insight & Statistics - Q2 2018
 
JLL Detroit Industrial Insight & Statistics - Q3 2017
JLL Detroit Industrial Insight & Statistics - Q3 2017JLL Detroit Industrial Insight & Statistics - Q3 2017
JLL Detroit Industrial Insight & Statistics - Q3 2017
 
JLL Detroit Industrial Insight & Statistics - Q1 2019
JLL Detroit Industrial Insight & Statistics - Q1 2019JLL Detroit Industrial Insight & Statistics - Q1 2019
JLL Detroit Industrial Insight & Statistics - Q1 2019
 

Similar to JLL Pittsburgh Industrial Insight & Statistics - Q4 2019

JLL Pittsburgh Industrial Insight & Statistics - Q3 2018
JLL Pittsburgh Industrial Insight & Statistics - Q3 2018JLL Pittsburgh Industrial Insight & Statistics - Q3 2018
JLL Pittsburgh Industrial Insight & Statistics - Q3 2018Tobiah Bilski
 
JLL Pittsburgh Industrial Insight & Statistics - Q2 2018
JLL Pittsburgh Industrial Insight & Statistics - Q2 2018JLL Pittsburgh Industrial Insight & Statistics - Q2 2018
JLL Pittsburgh Industrial Insight & Statistics - Q2 2018Tobiah Bilski
 
JLL Cleveland Industrial Outlook: Q4 2018
JLL Cleveland Industrial Outlook: Q4 2018JLL Cleveland Industrial Outlook: Q4 2018
JLL Cleveland Industrial Outlook: Q4 2018Andrew Batson
 
JLL Cleveland Industrial Outlook: Q4 2018
JLL Cleveland Industrial Outlook: Q4 2018JLL Cleveland Industrial Outlook: Q4 2018
JLL Cleveland Industrial Outlook: Q4 2018Andrew Batson
 
JLL Cleveland Industrial Outlook: Q3 2018
JLL Cleveland Industrial Outlook: Q3 2018JLL Cleveland Industrial Outlook: Q3 2018
JLL Cleveland Industrial Outlook: Q3 2018Andrew Batson
 
JLL Pittsburgh Industrial Insight & Statistics - Q4 2018
JLL Pittsburgh Industrial Insight & Statistics - Q4 2018JLL Pittsburgh Industrial Insight & Statistics - Q4 2018
JLL Pittsburgh Industrial Insight & Statistics - Q4 2018Tobiah Bilski
 
JLL Pittsburgh Industrial Insight & Statistics - Q4 2021
JLL Pittsburgh Industrial Insight & Statistics - Q4 2021JLL Pittsburgh Industrial Insight & Statistics - Q4 2021
JLL Pittsburgh Industrial Insight & Statistics - Q4 2021Tobiah Bilski
 
JLL Pittsburgh Industrial Insight & Statistics - Q1 2018
JLL Pittsburgh Industrial Insight & Statistics - Q1 2018JLL Pittsburgh Industrial Insight & Statistics - Q1 2018
JLL Pittsburgh Industrial Insight & Statistics - Q1 2018Tobiah Bilski
 
JLL Pittsburgh Industrial Insight & Statistics - Q4 2020
JLL Pittsburgh Industrial Insight & Statistics - Q4 2020JLL Pittsburgh Industrial Insight & Statistics - Q4 2020
JLL Pittsburgh Industrial Insight & Statistics - Q4 2020Tobiah Bilski
 
JLL Cleveland Industrial Outlook: Q1 2019
JLL Cleveland Industrial Outlook: Q1 2019JLL Cleveland Industrial Outlook: Q1 2019
JLL Cleveland Industrial Outlook: Q1 2019Andrew Batson
 
JLL Pittsburgh Industrial Insight & Statistics - Q3 2021
JLL Pittsburgh Industrial Insight & Statistics - Q3 2021JLL Pittsburgh Industrial Insight & Statistics - Q3 2021
JLL Pittsburgh Industrial Insight & Statistics - Q3 2021Tobiah Bilski
 
JLL Cincinnati Industrial Outlook Q3 2020
JLL Cincinnati Industrial Outlook Q3 2020JLL Cincinnati Industrial Outlook Q3 2020
JLL Cincinnati Industrial Outlook Q3 2020Abby Armbruster
 
JLL Pittsburgh Office Insight & Statistics - Q4 2019
JLL Pittsburgh Office Insight & Statistics - Q4 2019JLL Pittsburgh Office Insight & Statistics - Q4 2019
JLL Pittsburgh Office Insight & Statistics - Q4 2019Tobiah Bilski
 
JLL Cincinnati Industrial Outlook Q4 2020
JLL Cincinnati Industrial Outlook Q4 2020JLL Cincinnati Industrial Outlook Q4 2020
JLL Cincinnati Industrial Outlook Q4 2020Abby Armbruster
 
JLL Cincinnati Industrial Outlook Q1 2021
JLL Cincinnati Industrial Outlook Q1 2021JLL Cincinnati Industrial Outlook Q1 2021
JLL Cincinnati Industrial Outlook Q1 2021Abby Armbruster
 
JLL Detroit Industrial Insight & Statistics - Q4 2017
JLL Detroit Industrial Insight & Statistics - Q4 2017JLL Detroit Industrial Insight & Statistics - Q4 2017
JLL Detroit Industrial Insight & Statistics - Q4 2017Harrison West
 
Jll cincinnati industrial outlook q1 2017
Jll cincinnati industrial outlook   q1 2017Jll cincinnati industrial outlook   q1 2017
Jll cincinnati industrial outlook q1 2017Abby Armbruster
 
JLL Detroit Industrial Insight & Statistics - Q4 2018
JLL Detroit Industrial Insight & Statistics - Q4 2018JLL Detroit Industrial Insight & Statistics - Q4 2018
JLL Detroit Industrial Insight & Statistics - Q4 2018Harrison West
 
JLL Cleveland Industrial Outlook Q3 2019
JLL Cleveland Industrial Outlook   Q3 2019JLL Cleveland Industrial Outlook   Q3 2019
JLL Cleveland Industrial Outlook Q3 2019Johnathan Miller
 
JLL Cleveland Industrial Outlook: Q3 2019
JLL Cleveland Industrial Outlook: Q3 2019JLL Cleveland Industrial Outlook: Q3 2019
JLL Cleveland Industrial Outlook: Q3 2019Johnathan Miller
 

Similar to JLL Pittsburgh Industrial Insight & Statistics - Q4 2019 (20)

JLL Pittsburgh Industrial Insight & Statistics - Q3 2018
JLL Pittsburgh Industrial Insight & Statistics - Q3 2018JLL Pittsburgh Industrial Insight & Statistics - Q3 2018
JLL Pittsburgh Industrial Insight & Statistics - Q3 2018
 
JLL Pittsburgh Industrial Insight & Statistics - Q2 2018
JLL Pittsburgh Industrial Insight & Statistics - Q2 2018JLL Pittsburgh Industrial Insight & Statistics - Q2 2018
JLL Pittsburgh Industrial Insight & Statistics - Q2 2018
 
JLL Cleveland Industrial Outlook: Q4 2018
JLL Cleveland Industrial Outlook: Q4 2018JLL Cleveland Industrial Outlook: Q4 2018
JLL Cleveland Industrial Outlook: Q4 2018
 
JLL Cleveland Industrial Outlook: Q4 2018
JLL Cleveland Industrial Outlook: Q4 2018JLL Cleveland Industrial Outlook: Q4 2018
JLL Cleveland Industrial Outlook: Q4 2018
 
JLL Cleveland Industrial Outlook: Q3 2018
JLL Cleveland Industrial Outlook: Q3 2018JLL Cleveland Industrial Outlook: Q3 2018
JLL Cleveland Industrial Outlook: Q3 2018
 
JLL Pittsburgh Industrial Insight & Statistics - Q4 2018
JLL Pittsburgh Industrial Insight & Statistics - Q4 2018JLL Pittsburgh Industrial Insight & Statistics - Q4 2018
JLL Pittsburgh Industrial Insight & Statistics - Q4 2018
 
JLL Pittsburgh Industrial Insight & Statistics - Q4 2021
JLL Pittsburgh Industrial Insight & Statistics - Q4 2021JLL Pittsburgh Industrial Insight & Statistics - Q4 2021
JLL Pittsburgh Industrial Insight & Statistics - Q4 2021
 
JLL Pittsburgh Industrial Insight & Statistics - Q1 2018
JLL Pittsburgh Industrial Insight & Statistics - Q1 2018JLL Pittsburgh Industrial Insight & Statistics - Q1 2018
JLL Pittsburgh Industrial Insight & Statistics - Q1 2018
 
JLL Pittsburgh Industrial Insight & Statistics - Q4 2020
JLL Pittsburgh Industrial Insight & Statistics - Q4 2020JLL Pittsburgh Industrial Insight & Statistics - Q4 2020
JLL Pittsburgh Industrial Insight & Statistics - Q4 2020
 
JLL Cleveland Industrial Outlook: Q1 2019
JLL Cleveland Industrial Outlook: Q1 2019JLL Cleveland Industrial Outlook: Q1 2019
JLL Cleveland Industrial Outlook: Q1 2019
 
JLL Pittsburgh Industrial Insight & Statistics - Q3 2021
JLL Pittsburgh Industrial Insight & Statistics - Q3 2021JLL Pittsburgh Industrial Insight & Statistics - Q3 2021
JLL Pittsburgh Industrial Insight & Statistics - Q3 2021
 
JLL Cincinnati Industrial Outlook Q3 2020
JLL Cincinnati Industrial Outlook Q3 2020JLL Cincinnati Industrial Outlook Q3 2020
JLL Cincinnati Industrial Outlook Q3 2020
 
JLL Pittsburgh Office Insight & Statistics - Q4 2019
JLL Pittsburgh Office Insight & Statistics - Q4 2019JLL Pittsburgh Office Insight & Statistics - Q4 2019
JLL Pittsburgh Office Insight & Statistics - Q4 2019
 
JLL Cincinnati Industrial Outlook Q4 2020
JLL Cincinnati Industrial Outlook Q4 2020JLL Cincinnati Industrial Outlook Q4 2020
JLL Cincinnati Industrial Outlook Q4 2020
 
JLL Cincinnati Industrial Outlook Q1 2021
JLL Cincinnati Industrial Outlook Q1 2021JLL Cincinnati Industrial Outlook Q1 2021
JLL Cincinnati Industrial Outlook Q1 2021
 
JLL Detroit Industrial Insight & Statistics - Q4 2017
JLL Detroit Industrial Insight & Statistics - Q4 2017JLL Detroit Industrial Insight & Statistics - Q4 2017
JLL Detroit Industrial Insight & Statistics - Q4 2017
 
Jll cincinnati industrial outlook q1 2017
Jll cincinnati industrial outlook   q1 2017Jll cincinnati industrial outlook   q1 2017
Jll cincinnati industrial outlook q1 2017
 
JLL Detroit Industrial Insight & Statistics - Q4 2018
JLL Detroit Industrial Insight & Statistics - Q4 2018JLL Detroit Industrial Insight & Statistics - Q4 2018
JLL Detroit Industrial Insight & Statistics - Q4 2018
 
JLL Cleveland Industrial Outlook Q3 2019
JLL Cleveland Industrial Outlook   Q3 2019JLL Cleveland Industrial Outlook   Q3 2019
JLL Cleveland Industrial Outlook Q3 2019
 
JLL Cleveland Industrial Outlook: Q3 2019
JLL Cleveland Industrial Outlook: Q3 2019JLL Cleveland Industrial Outlook: Q3 2019
JLL Cleveland Industrial Outlook: Q3 2019
 

More from Tobiah Bilski

Pittsburgh Office Insight & Stats Q1 2022
Pittsburgh Office Insight & Stats Q1 2022Pittsburgh Office Insight & Stats Q1 2022
Pittsburgh Office Insight & Stats Q1 2022Tobiah Bilski
 
Pittsburgh Office Insight & Stats Q4 2021
Pittsburgh Office Insight & Stats Q4 2021Pittsburgh Office Insight & Stats Q4 2021
Pittsburgh Office Insight & Stats Q4 2021Tobiah Bilski
 
JLL Pittsburgh Office Insight & Statistics - Q1 2021
JLL Pittsburgh Office Insight & Statistics - Q1 2021JLL Pittsburgh Office Insight & Statistics - Q1 2021
JLL Pittsburgh Office Insight & Statistics - Q1 2021Tobiah Bilski
 
JLL Pittsburgh Office Insight & Statistics - Q2 2020
JLL Pittsburgh Office Insight & Statistics - Q2 2020JLL Pittsburgh Office Insight & Statistics - Q2 2020
JLL Pittsburgh Office Insight & Statistics - Q2 2020Tobiah Bilski
 
JLL Pittsburgh Office Insight & Statistics - Q1 2020
JLL Pittsburgh Office Insight & Statistics - Q1 2020JLL Pittsburgh Office Insight & Statistics - Q1 2020
JLL Pittsburgh Office Insight & Statistics - Q1 2020Tobiah Bilski
 
JLL Pittsburgh Office Insight & Statistics - Q3 2019
 JLL Pittsburgh Office Insight & Statistics - Q3 2019 JLL Pittsburgh Office Insight & Statistics - Q3 2019
JLL Pittsburgh Office Insight & Statistics - Q3 2019Tobiah Bilski
 
JLL Pittsburgh Office Insight & Statistics - Q2 2019
JLL Pittsburgh Office Insight & Statistics - Q2 2019JLL Pittsburgh Office Insight & Statistics - Q2 2019
JLL Pittsburgh Office Insight & Statistics - Q2 2019Tobiah Bilski
 
JLL Pittsburgh Office Insight & Statistics - Q1 2019
JLL Pittsburgh Office Insight & Statistics - Q1 2019JLL Pittsburgh Office Insight & Statistics - Q1 2019
JLL Pittsburgh Office Insight & Statistics - Q1 2019Tobiah Bilski
 
JLL Pittsburgh Office Insight & Statistics - Q4 2018
JLL Pittsburgh Office Insight & Statistics - Q4 2018JLL Pittsburgh Office Insight & Statistics - Q4 2018
JLL Pittsburgh Office Insight & Statistics - Q4 2018Tobiah Bilski
 
JLL Pittsburgh Office Insight & Statistics - Q3 2018
JLL Pittsburgh Office Insight & Statistics - Q3 2018JLL Pittsburgh Office Insight & Statistics - Q3 2018
JLL Pittsburgh Office Insight & Statistics - Q3 2018Tobiah Bilski
 
JLL Pittsburgh Office Insight & Statistics - Q2 2018
JLL Pittsburgh Office Insight & Statistics - Q2 2018 JLL Pittsburgh Office Insight & Statistics - Q2 2018
JLL Pittsburgh Office Insight & Statistics - Q2 2018 Tobiah Bilski
 
JLL Pittsburgh Office Insight & Statistics - Q1 2018
JLL Pittsburgh Office Insight & Statistics - Q1 2018JLL Pittsburgh Office Insight & Statistics - Q1 2018
JLL Pittsburgh Office Insight & Statistics - Q1 2018Tobiah Bilski
 

More from Tobiah Bilski (12)

Pittsburgh Office Insight & Stats Q1 2022
Pittsburgh Office Insight & Stats Q1 2022Pittsburgh Office Insight & Stats Q1 2022
Pittsburgh Office Insight & Stats Q1 2022
 
Pittsburgh Office Insight & Stats Q4 2021
Pittsburgh Office Insight & Stats Q4 2021Pittsburgh Office Insight & Stats Q4 2021
Pittsburgh Office Insight & Stats Q4 2021
 
JLL Pittsburgh Office Insight & Statistics - Q1 2021
JLL Pittsburgh Office Insight & Statistics - Q1 2021JLL Pittsburgh Office Insight & Statistics - Q1 2021
JLL Pittsburgh Office Insight & Statistics - Q1 2021
 
JLL Pittsburgh Office Insight & Statistics - Q2 2020
JLL Pittsburgh Office Insight & Statistics - Q2 2020JLL Pittsburgh Office Insight & Statistics - Q2 2020
JLL Pittsburgh Office Insight & Statistics - Q2 2020
 
JLL Pittsburgh Office Insight & Statistics - Q1 2020
JLL Pittsburgh Office Insight & Statistics - Q1 2020JLL Pittsburgh Office Insight & Statistics - Q1 2020
JLL Pittsburgh Office Insight & Statistics - Q1 2020
 
JLL Pittsburgh Office Insight & Statistics - Q3 2019
 JLL Pittsburgh Office Insight & Statistics - Q3 2019 JLL Pittsburgh Office Insight & Statistics - Q3 2019
JLL Pittsburgh Office Insight & Statistics - Q3 2019
 
JLL Pittsburgh Office Insight & Statistics - Q2 2019
JLL Pittsburgh Office Insight & Statistics - Q2 2019JLL Pittsburgh Office Insight & Statistics - Q2 2019
JLL Pittsburgh Office Insight & Statistics - Q2 2019
 
JLL Pittsburgh Office Insight & Statistics - Q1 2019
JLL Pittsburgh Office Insight & Statistics - Q1 2019JLL Pittsburgh Office Insight & Statistics - Q1 2019
JLL Pittsburgh Office Insight & Statistics - Q1 2019
 
JLL Pittsburgh Office Insight & Statistics - Q4 2018
JLL Pittsburgh Office Insight & Statistics - Q4 2018JLL Pittsburgh Office Insight & Statistics - Q4 2018
JLL Pittsburgh Office Insight & Statistics - Q4 2018
 
JLL Pittsburgh Office Insight & Statistics - Q3 2018
JLL Pittsburgh Office Insight & Statistics - Q3 2018JLL Pittsburgh Office Insight & Statistics - Q3 2018
JLL Pittsburgh Office Insight & Statistics - Q3 2018
 
JLL Pittsburgh Office Insight & Statistics - Q2 2018
JLL Pittsburgh Office Insight & Statistics - Q2 2018 JLL Pittsburgh Office Insight & Statistics - Q2 2018
JLL Pittsburgh Office Insight & Statistics - Q2 2018
 
JLL Pittsburgh Office Insight & Statistics - Q1 2018
JLL Pittsburgh Office Insight & Statistics - Q1 2018JLL Pittsburgh Office Insight & Statistics - Q1 2018
JLL Pittsburgh Office Insight & Statistics - Q1 2018
 

Recently uploaded

Mahindra Happinest Tathawade Pune Brochure.pdf
Mahindra Happinest Tathawade Pune Brochure.pdfMahindra Happinest Tathawade Pune Brochure.pdf
Mahindra Happinest Tathawade Pune Brochure.pdfBabyrudram
 
2k Shots ≽ 9205541914 ≼ Call Girls In Sainik Farm (Delhi)
2k Shots ≽ 9205541914 ≼ Call Girls In Sainik Farm (Delhi)2k Shots ≽ 9205541914 ≼ Call Girls In Sainik Farm (Delhi)
2k Shots ≽ 9205541914 ≼ Call Girls In Sainik Farm (Delhi)Delhi Call girls
 
Kolte Patil Kharadi Pune E Brochure.pdf
Kolte Patil Kharadi Pune E  Brochure.pdfKolte Patil Kharadi Pune E  Brochure.pdf
Kolte Patil Kharadi Pune E Brochure.pdfabbu831446
 
9990771857 Call Girls in Dwarka Sector 137 Noida (Call Girls) Delhi
9990771857 Call Girls in Dwarka Sector 137 Noida (Call Girls) Delhi9990771857 Call Girls in Dwarka Sector 137 Noida (Call Girls) Delhi
9990771857 Call Girls in Dwarka Sector 137 Noida (Call Girls) Delhidelhimodel235
 
3D Architectural Rendering Company by Panoram CGI
3D Architectural Rendering Company by Panoram CGI3D Architectural Rendering Company by Panoram CGI
3D Architectural Rendering Company by Panoram CGIPanoram CGI
 
Magarpatta Nova Elegance Mundhwa Pune E-Brochure.pdf
Magarpatta Nova Elegance Mundhwa Pune  E-Brochure.pdfMagarpatta Nova Elegance Mundhwa Pune  E-Brochure.pdf
Magarpatta Nova Elegance Mundhwa Pune E-Brochure.pdfManishSaxena95
 
Call Girls In Mayur Vihar Delhi ☆↫8447779280 ❤Escorts Service In Delhi
Call Girls In Mayur Vihar Delhi ☆↫8447779280 ❤Escorts Service In DelhiCall Girls In Mayur Vihar Delhi ☆↫8447779280 ❤Escorts Service In Delhi
Call Girls In Mayur Vihar Delhi ☆↫8447779280 ❤Escorts Service In Delhiasmaqueen5
 
Majestique Viman Nagar Pune Brochure.pdf
Majestique Viman Nagar Pune Brochure.pdfMajestique Viman Nagar Pune Brochure.pdf
Majestique Viman Nagar Pune Brochure.pdfBabyrudram
 
Call Girls In Vasant Vihar Delhi 💯Call Us 🔝8264348440🔝
Call Girls In Vasant Vihar Delhi 💯Call Us 🔝8264348440🔝Call Girls In Vasant Vihar Delhi 💯Call Us 🔝8264348440🔝
Call Girls In Vasant Vihar Delhi 💯Call Us 🔝8264348440🔝soniya singh
 
Call Girls in shastri nagar Delhi 8264348440 ✅ call girls ❤️
Call Girls in shastri nagar Delhi 8264348440 ✅ call girls ❤️Call Girls in shastri nagar Delhi 8264348440 ✅ call girls ❤️
Call Girls in shastri nagar Delhi 8264348440 ✅ call girls ❤️soniya singh
 
Call Girls in Karkardooma Delhi +91 84487779280}Woman Seeking Man in Delhi NCR
Call Girls in Karkardooma Delhi +91 84487779280}Woman Seeking Man in Delhi NCRCall Girls in Karkardooma Delhi +91 84487779280}Woman Seeking Man in Delhi NCR
Call Girls in Karkardooma Delhi +91 84487779280}Woman Seeking Man in Delhi NCRasmaqueen5
 
Kohinoor Flats In Hinjewadi Phase 2 | Homes Built To Suit Your Needs
Kohinoor Flats In Hinjewadi Phase 2 | Homes Built To Suit Your NeedsKohinoor Flats In Hinjewadi Phase 2 | Homes Built To Suit Your Needs
Kohinoor Flats In Hinjewadi Phase 2 | Homes Built To Suit Your Needsaidasheikh47
 
9990771857 Call Girls in Dwarka Sector 1 Delhi (Call Girls) Delhi
9990771857 Call Girls in Dwarka Sector 1 Delhi (Call Girls) Delhi9990771857 Call Girls in Dwarka Sector 1 Delhi (Call Girls) Delhi
9990771857 Call Girls in Dwarka Sector 1 Delhi (Call Girls) Delhidelhimodel235
 
9990771857 Call Girls in Dwarka Sector 6 Delhi (Call Girls) Delhi
9990771857 Call Girls in Dwarka Sector 6 Delhi (Call Girls) Delhi9990771857 Call Girls in Dwarka Sector 6 Delhi (Call Girls) Delhi
9990771857 Call Girls in Dwarka Sector 6 Delhi (Call Girls) Delhidelhimodel235
 
Kohinoor Hinjewadi Phase 2 Pune E-Brochure.pdf
Kohinoor Hinjewadi Phase 2 Pune  E-Brochure.pdfKohinoor Hinjewadi Phase 2 Pune  E-Brochure.pdf
Kohinoor Hinjewadi Phase 2 Pune E-Brochure.pdfManishSaxena95
 
9990771857 Call Girls in Dwarka Sector 7 Delhi (Call Girls) Delhi
9990771857 Call Girls in Dwarka Sector 7 Delhi (Call Girls) Delhi9990771857 Call Girls in Dwarka Sector 7 Delhi (Call Girls) Delhi
9990771857 Call Girls in Dwarka Sector 7 Delhi (Call Girls) Delhidelhimodel235
 
Greater Vancouver Realtors Statistics Package April 2024
Greater Vancouver Realtors Statistics Package April 2024Greater Vancouver Realtors Statistics Package April 2024
Greater Vancouver Realtors Statistics Package April 2024VickyAulakh1
 
M3M 129 E Brochure Noida Expressway, Sector 129, Noida
M3M 129 E Brochure Noida Expressway, Sector 129, NoidaM3M 129 E Brochure Noida Expressway, Sector 129, Noida
M3M 129 E Brochure Noida Expressway, Sector 129, Noidasarak0han45400
 
Best Deal Virtual Space in Satya The Hive Tata Zudio 750 Sqft 1.89 Cr All inc...
Best Deal Virtual Space in Satya The Hive Tata Zudio 750 Sqft 1.89 Cr All inc...Best Deal Virtual Space in Satya The Hive Tata Zudio 750 Sqft 1.89 Cr All inc...
Best Deal Virtual Space in Satya The Hive Tata Zudio 750 Sqft 1.89 Cr All inc...ApartmentWala1
 
Maha Mauka Squarefeet Brochure |Maha Mauka Squarefeet PDF Brochure|
Maha Mauka Squarefeet Brochure |Maha Mauka Squarefeet PDF Brochure|Maha Mauka Squarefeet Brochure |Maha Mauka Squarefeet PDF Brochure|
Maha Mauka Squarefeet Brochure |Maha Mauka Squarefeet PDF Brochure|AkshayJoshi575980
 

Recently uploaded (20)

Mahindra Happinest Tathawade Pune Brochure.pdf
Mahindra Happinest Tathawade Pune Brochure.pdfMahindra Happinest Tathawade Pune Brochure.pdf
Mahindra Happinest Tathawade Pune Brochure.pdf
 
2k Shots ≽ 9205541914 ≼ Call Girls In Sainik Farm (Delhi)
2k Shots ≽ 9205541914 ≼ Call Girls In Sainik Farm (Delhi)2k Shots ≽ 9205541914 ≼ Call Girls In Sainik Farm (Delhi)
2k Shots ≽ 9205541914 ≼ Call Girls In Sainik Farm (Delhi)
 
Kolte Patil Kharadi Pune E Brochure.pdf
Kolte Patil Kharadi Pune E  Brochure.pdfKolte Patil Kharadi Pune E  Brochure.pdf
Kolte Patil Kharadi Pune E Brochure.pdf
 
9990771857 Call Girls in Dwarka Sector 137 Noida (Call Girls) Delhi
9990771857 Call Girls in Dwarka Sector 137 Noida (Call Girls) Delhi9990771857 Call Girls in Dwarka Sector 137 Noida (Call Girls) Delhi
9990771857 Call Girls in Dwarka Sector 137 Noida (Call Girls) Delhi
 
3D Architectural Rendering Company by Panoram CGI
3D Architectural Rendering Company by Panoram CGI3D Architectural Rendering Company by Panoram CGI
3D Architectural Rendering Company by Panoram CGI
 
Magarpatta Nova Elegance Mundhwa Pune E-Brochure.pdf
Magarpatta Nova Elegance Mundhwa Pune  E-Brochure.pdfMagarpatta Nova Elegance Mundhwa Pune  E-Brochure.pdf
Magarpatta Nova Elegance Mundhwa Pune E-Brochure.pdf
 
Call Girls In Mayur Vihar Delhi ☆↫8447779280 ❤Escorts Service In Delhi
Call Girls In Mayur Vihar Delhi ☆↫8447779280 ❤Escorts Service In DelhiCall Girls In Mayur Vihar Delhi ☆↫8447779280 ❤Escorts Service In Delhi
Call Girls In Mayur Vihar Delhi ☆↫8447779280 ❤Escorts Service In Delhi
 
Majestique Viman Nagar Pune Brochure.pdf
Majestique Viman Nagar Pune Brochure.pdfMajestique Viman Nagar Pune Brochure.pdf
Majestique Viman Nagar Pune Brochure.pdf
 
Call Girls In Vasant Vihar Delhi 💯Call Us 🔝8264348440🔝
Call Girls In Vasant Vihar Delhi 💯Call Us 🔝8264348440🔝Call Girls In Vasant Vihar Delhi 💯Call Us 🔝8264348440🔝
Call Girls In Vasant Vihar Delhi 💯Call Us 🔝8264348440🔝
 
Call Girls in shastri nagar Delhi 8264348440 ✅ call girls ❤️
Call Girls in shastri nagar Delhi 8264348440 ✅ call girls ❤️Call Girls in shastri nagar Delhi 8264348440 ✅ call girls ❤️
Call Girls in shastri nagar Delhi 8264348440 ✅ call girls ❤️
 
Call Girls in Karkardooma Delhi +91 84487779280}Woman Seeking Man in Delhi NCR
Call Girls in Karkardooma Delhi +91 84487779280}Woman Seeking Man in Delhi NCRCall Girls in Karkardooma Delhi +91 84487779280}Woman Seeking Man in Delhi NCR
Call Girls in Karkardooma Delhi +91 84487779280}Woman Seeking Man in Delhi NCR
 
Kohinoor Flats In Hinjewadi Phase 2 | Homes Built To Suit Your Needs
Kohinoor Flats In Hinjewadi Phase 2 | Homes Built To Suit Your NeedsKohinoor Flats In Hinjewadi Phase 2 | Homes Built To Suit Your Needs
Kohinoor Flats In Hinjewadi Phase 2 | Homes Built To Suit Your Needs
 
9990771857 Call Girls in Dwarka Sector 1 Delhi (Call Girls) Delhi
9990771857 Call Girls in Dwarka Sector 1 Delhi (Call Girls) Delhi9990771857 Call Girls in Dwarka Sector 1 Delhi (Call Girls) Delhi
9990771857 Call Girls in Dwarka Sector 1 Delhi (Call Girls) Delhi
 
9990771857 Call Girls in Dwarka Sector 6 Delhi (Call Girls) Delhi
9990771857 Call Girls in Dwarka Sector 6 Delhi (Call Girls) Delhi9990771857 Call Girls in Dwarka Sector 6 Delhi (Call Girls) Delhi
9990771857 Call Girls in Dwarka Sector 6 Delhi (Call Girls) Delhi
 
Kohinoor Hinjewadi Phase 2 Pune E-Brochure.pdf
Kohinoor Hinjewadi Phase 2 Pune  E-Brochure.pdfKohinoor Hinjewadi Phase 2 Pune  E-Brochure.pdf
Kohinoor Hinjewadi Phase 2 Pune E-Brochure.pdf
 
9990771857 Call Girls in Dwarka Sector 7 Delhi (Call Girls) Delhi
9990771857 Call Girls in Dwarka Sector 7 Delhi (Call Girls) Delhi9990771857 Call Girls in Dwarka Sector 7 Delhi (Call Girls) Delhi
9990771857 Call Girls in Dwarka Sector 7 Delhi (Call Girls) Delhi
 
Greater Vancouver Realtors Statistics Package April 2024
Greater Vancouver Realtors Statistics Package April 2024Greater Vancouver Realtors Statistics Package April 2024
Greater Vancouver Realtors Statistics Package April 2024
 
M3M 129 E Brochure Noida Expressway, Sector 129, Noida
M3M 129 E Brochure Noida Expressway, Sector 129, NoidaM3M 129 E Brochure Noida Expressway, Sector 129, Noida
M3M 129 E Brochure Noida Expressway, Sector 129, Noida
 
Best Deal Virtual Space in Satya The Hive Tata Zudio 750 Sqft 1.89 Cr All inc...
Best Deal Virtual Space in Satya The Hive Tata Zudio 750 Sqft 1.89 Cr All inc...Best Deal Virtual Space in Satya The Hive Tata Zudio 750 Sqft 1.89 Cr All inc...
Best Deal Virtual Space in Satya The Hive Tata Zudio 750 Sqft 1.89 Cr All inc...
 
Maha Mauka Squarefeet Brochure |Maha Mauka Squarefeet PDF Brochure|
Maha Mauka Squarefeet Brochure |Maha Mauka Squarefeet PDF Brochure|Maha Mauka Squarefeet Brochure |Maha Mauka Squarefeet PDF Brochure|
Maha Mauka Squarefeet Brochure |Maha Mauka Squarefeet PDF Brochure|
 

JLL Pittsburgh Industrial Insight & Statistics - Q4 2019

  • 1. © 2019 Jones Lang LaSalle IP, Inc. All rights reserved. All information contained herein is from sources deemed reliable; however, no representation or warranty is made to the accuracy thereof. Q4 2019 Industrial Insight As the decade closes, Amazon continues growing their industrial presence in Pittsburgh. Not long after Amazon began construction of the million-square- foot distribution center in Findlay township, news broke of Amazon looking for an additional 100,000 square feet to support last mile delivery demands. E- commerce sales are driving the growth in distribution centers and Pittsburgh’s advantageous location within a day’s drive of major markets on the East Coast and Midwest has made the region attractive to distributors. Ironically as e-commerce continues to grow, popular brands Peloton and Casper have opened up brick and mortar stores at the Ross Park Mall. Peloton has opened a distribution warehouse in Cranberry Township to support local and regional deliveries. Outlook Looking ahead into the new decade, Pittsburgh’s growth opportunity lies in the ability to successfully navigate new economies. Advanced manufacturing, robotics, life sciences and plastics are all strong drivers for Pittsburgh’s future. Prioritizing and allocating resources will determine the region’s success. Shell’s petrochemical facility in Beaver County has become a showcase for new approaches in construction management. While Shell’s presence in the region has created a positive economic gain for the area, Mayor Bill Peduto has publicly denounced further petrochemical development in Pittsburgh in an effort to conserve the environment and as an attempt to protect Pittsburgh’s attractive qualities. The direct and current impact from Shell’s project prior to completion has been the addition of thousands of jobs, the use of technology like drones and robots for inspections and the donation of $1.0 million to the Community College of Beaver County. According to CoStar News, in the four years since the Shell announcement, the amount of real estate investment in Beaver County has “skyrocketed” and has reached levels nearly equal to what was spent in the previous 20 years. Fundamentals Forecast YTD net absorption 818,417 s.f. ▲ QTD net absorption 165,292 s.f. ▲ Under construction 2,247,704 s.f. ▲ Total vacancy 6.1% ▼ Average asking rent (NNN) $5.30 p.s.f. ▲ Tenant improvements Stable ▶ -500,000 1,500,000 3,500,000 2015 2016 2017 2018 2019 Supply and demand (s.f.) Net absorption Deliveries Amazon is not finished growing in Southwestern Pennsylvania 11.8% 9.6% 8.4% 7.7% 6.1% 2015 2016 2017 2018 2019 Total vacancy For more information, contact: Tobiah Bilski | tobiah.bilski@am.jll.com • Peloton rides into Pittsburgh with a new distribution warehouse location in Cranberry Township. • Al. Neyer announces a 480,000-square-foot development in Westmoreland County. • Pittsburgh Mayor Bill Peduto rebukes further petrochemical development in the region. $0.00 $1.00 $2.00 $3.00 $4.00 $5.00 $6.00 2015 2016 2017 2018 2019 Average asking rents ($/s.f.) W&D Manufacturing
  • 2. © 2019 Jones Lang LaSalle IP, Inc. All rights reserved. All information contained herein is from sources deemed reliable; however, no representation or warranty is made to the accuracy thereof. Inventory (s.f.) Quarterly total net absorption (s.f.) YTD total net absorption (s.f.) YTD total net absorption (% of stock) Total vacancy (%) Total availability (%) Average total asking rent ($ p.s.f.) Quarterly Completions (s.f.) YTD Completions (s.f.) Under construction (s.f.) Pittsburgh total Warehouse & Distribution 88,637,537 47,243 816,837 0.9% 5.8% 7.9% $5.56 286,387 898,286 2,247,704 Manufacturing 53,869,017 118,049 1,580 0.0% 6.5% 7.7% $4.19 0 0 0 Totals 142,601,554 165,292 818,417 0.6% 6.1% 7.9% $5.30 286,387 898,286 2,247,704 Beaver County Warehouse & Distribution 5,497,234 -20,140 -184,287 -3.4% 10.8% 17.1% $4.84 0 0 651,000 Manufacturing 4,358,833 25,000 75,044 1.7% 10.5% 9.3% $3.50 0 0 0 Totals 9,856,067 4,860 -109,243 -1.1% 10.7% 13.9% $4.60 0 0 651,000 Butler County Warehouse & Distribution 4,136,199 90,592 -63,425 -1.5% 17.5% 20.6% $4.58 220,000 0 0 Manufacturing 3,561,575 0 509 0.0% 7.4% 10.1% $2.56 0 0 0 Totals 7,697,774 90,592 -62,916 -0.8% 12.8% 15.8% $3.95 220,000 0 0 Downtown Warehouse & Distribution 18,373,235 -6,234 -212,709 -1.2% 4.2% 4.7% $10.20 0 0 0 Manufacturing 4,643,481 -8,153 -10,009 -0.2% 1.3% 3.9% $0.00 0 0 0 Totals 23,031,716 -14,387 -222,718 -1.0% 3.6% 4.6% $10.20 0 0 0 East Warehouse & Distribution 5,969,910 59,518 117,239 2.0% 3.8% 5.9% $4.50 0 0 0 Manufacturing 3,637,199 29,000 11,500 0.3% 5.7% 5.7% $3.50 0 0 0 Totals 9,607,109 88,518 128,739 1.3% 4.5% 5.8% $4.09 0 0 0 Northeast Warehouse & Distribution 6,086,164 0 77,495 1.3% 2.3% 2.9% $6.08 0 0 0 Manufacturing 6,880,307 0 -231,000 -3.4% 5.3% 5.3% $0.00 0 0 0 Totals 12,966,471 0 -153,505 -1.2% 3.9% 4.1% $6.08 0 0 0 Northwest Warehouse & Distribution 10,525,275 -35,626 -42,216 -0.4% 3.2% 6.2% $8.52 0 0 0 Manufacturing 3,063,621 79,825 128,108 4.2% 0.3% 0.3% $0.00 0 0 0 Totals 13,588,896 44,199 85,892 0.6% 2.5% 4.9% $8.52 0 0 0 South Warehouse & Distribution 5,521,847 -21,500 -205,569 -3.7% 7.4% 9.0% $5.77 0 0 0 Manufacturing 7,892,472 4,000 -97,929 -1.2% 5.1% 5.1% $6.18 0 0 0 Totals 13,414,319 -17,500 -303,498 -2.3% 6.1% 6.7% $6.04 0 0 0 Washington County Warehouse & Distribution 6,589,531 17,786 571,061 8.7% 10.6% 16.5% $4.96 0 535,249 0 Manufacturing 4,736,380 -37,273 48,402 1.0% 2.4% 2.4% $3.90 0 0 0 Totals 11,325,911 -19,487 619,463 5.5% 7.2% 10.6% $4.86 0 535,249 0 West Warehouse & Distribution 11,518,528 16,727 670,496 5.8% 3.0% 4.6% $6.30 66,387 325,537 1,596,704 Manufacturing 2,706,639 -12,000 15,705 0.6% 2.5% 4.5% $0.00 0 0 0 Totals 14,225,167 4,727 686,201 4.8% 2.9% 4.6% $6.30 66,387 325,537 1,596,704 Westmoreland County Warehouse & Distribution 14,419,614 -53,880 88,752 0.6% 6.1% 7.2% $4.80 0 37,500 0 Manufacturing 12,388,510 37,650 61,250 0.5% 12.7% 16.1% $6.60 0 0 0 Totals 26,888,124 -16,230 150,002 0.6% 9.3% 11.4% $5.28 0 37,500 0 Q4 2019 Industrial Statistics For more information, contact: Tobiah Bilski | tobiah.bilski@am.jll.com