More Related Content
Similar to JLL Pittsburgh Office Insight & Statistics - Q4 2017 (20)
More from Tobiah Bilski (13)
JLL Pittsburgh Office Insight & Statistics - Q4 2017
- 1. © 2017 Jones Lang LaSalle IP, Inc. All rights reserved. All information contained herein is from sources deemed reliable; however, no representation or warranty is made to the accuracy thereof.
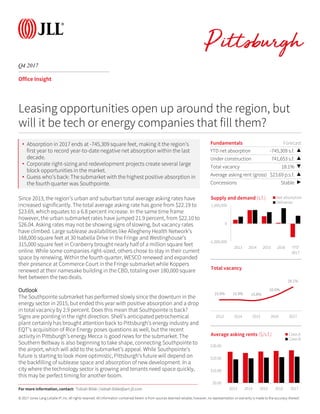
Fundamentals Forecast
YTD net absorption -745,309 s.f. ▲
Under construction 741,653 s.f. ▲
Total vacancy 18.1% ▼
Average asking rent (gross) $23.69 p.s.f. ▲
Concessions Stable ▶
Q4 2017
Office Insight
Since 2013, the region’s urban and suburban total average asking rates have
increased significantly. The total average asking rate has gone from $22.19 to
$23.69, which equates to a 6.8 percent increase. In the same time frame
however, the urban submarket rates have jumped 21.9 percent, from $22.10 to
$26.04. Asking rates may not be showing signs of slowing, but vacancy rates
have climbed. Large sublease availabilities like Allegheny Health Network’s
168,000 square feet at 30 Isabella Drive in the Fringe and Westinghouse’s
315,000 square feet in Cranberry brought nearly half of a million square feet
online. While some companies right-sized, others chose to stay in their current
space by renewing. Within the fourth quarter, WESCO renewed and expanded
their presence at Commerce Court in the Fringe submarket while Koppers
renewed at their namesake building in the CBD, totaling over 180,000 square
feet between the two deals.
Outlook
The Southpointe submarket has performed slowly since the downturn in the
energy sector in 2015, but ended this year with positive absorption and a drop
in total vacancy by 2.9 percent. Does this mean that Southpointe is back?
Signs are pointing in the right direction. Shell’s anticipated petrochemical
plant certainly has brought attention back to Pittsburgh’s energy industry and
EQT’s acquisition of Rice Energy poses questions as well, but the recent
activity in Pittsburgh’s energy Mecca is good news for the submarket. The
Southern Beltway is also beginning to take shape, connecting Southpointe to
the airport, which will add to the submarket’s appeal. While Southpointe’s
future is starting to look more optimistic, Pittsburgh’s future will depend on
the backfilling of sublease space and absorption of new development. In a
city where the technology sector is growing and tenants need space quickly,
this may be perfect timing for another boom.
-1,000,000
0
1,000,000
2013 2014 2015 2016 YTD
2017
Supply and demand (s.f.) Net absorption
Deliveries
Leasing opportunities open up around the region, but
will it be tech or energy companies that fill them?
15.9% 15.9% 15.8%
16.6%
18.1%
2013 2014 2015 2016 2017
Total vacancy
$0.00
$10.00
$20.00
$30.00
2013 2014 2015 2016 2017
Average asking rents ($/s.f.) Class A
Class B
For more information, contact: Tobiah Bilski | tobiah.bilski@am.jll.com
• Absorption in 2017 ends at -745,309 square feet, making it the region’s
first year to record year-to-date negative net absorption within the last
decade.
• Corporate right-sizing and redevelopment projects create several large
block opportunities in the market.
• Guess who’s back: The submarket with the highest positive absorption in
the fourth quarter was Southpointe.
- 2. © 2017 Jones Lang LaSalle IP, Inc. All rights reserved. All information contained herein is from sources deemed reliable; however, no representation or warranty is made to the accuracy thereof.
Q4 2017
Office Statistics
For more information, contact: Tobiah Bilski | tobiah.bilski@am.jll.com
Class
Inventory
(s.f.)
Total net
absorption
(s.f.)
YTD total net
absorption
(s.f.)
YTD total net
absorption
(%)
Direct
vacancy (%)
Total
vacancy (%)
Average
direct asking
rent ($ p.s.f.)
YTD
completions
(s.f.)
Under
construction
(s.f.)
CBD Totals 18,928,135 -122,450 -485,178 -2.6% 15.4% 16.6% $26.82 0 50,000
Fringe Totals 7,708,658 -10,568 -244,007 -3.2% 14.7% 17.7% $23.61 105,000 423,000
Oakland/East End Totals 2,057,856 -15,803 99,475 4.8% 6.2% 6.4% $29.80 64,500 93,953
Urban Totals 28,694,649 -148,821 -629,710 -2.2% 14.6% 16.1% $26.04 169,500 566,953
North Totals 3,672,995 25,604 -117,369 -3.2% 12.2% 12.7% $21.93 93,000 55,000
Northern I-79/Cranberry Totals 4,415,855 -358,082 -185,054 -4.2% 10.1% 18.0% $24.34 89,074 119,700
East Totals 3,045,135 -24,024 67,910 2.2% 31.9% 33.8% $20.33 0 0
South Totals 2,347,259 -33,926 -85,117 -3.6% 14.8% 17.1% $20.97 80,000 0
Southpointe Totals 2,972,107 86,582 64,151 2.2% 20.6% 24.1% $22.97 0 0
West Totals 7,002,426 42,805 139,880 2.0% 18.2% 19.8% $21.35 0 0
Suburban Totals 23,455,777 -261,041 -115,599 -0.5% 17.5% 20.5% $21.68 262,074 174,700
Pittsburgh Totals 52,150,426 -409,862 -745,309 -1.4% 15.9% 18.1% $23.69 431,574 741,653
CBD A 13,102,880 -270,262 -428,354 -3.3% 14.3% 15.2% $29.49 0 50,000
Fringe A 2,087,970 5,942 -76,716 -3.7% 3.8% 13.8% $24.72 105,000 235,500
Oakland/East End A 969,243 5,472 60,484 6.2% 7.4% 7.8% $33.93 64,500 93,953
Urban A 16,160,093 -258,848 -444,586 -2.8% 12.5% 14.6% $29.50 169,500 379,453
North A 834,608 9,803 -63,562 -7.6% 14.3% 15.6% $25.05 93,000 55,000
Northern I-79/Cranberry A 3,650,249 -340,106 -283,047 -7.8% 8.6% 18.1% $25.19 0 119,700
East A 1,580,784 -17,192 53,346 3.4% 29.5% 30.8% $22.12 0 0
South A 0 0 0 0.0% 0.0% 0.0% $0.00 0 0
Southpointe A 1,909,754 54,654 20,440 1.1% 13.9% 18.1% $23.65 0 0
West A 3,767,504 -7,965 8,004 0.2% 16.6% 19.4% $22.77 0 0
Suburban A 11,742,899 -300,806 -264,819 -2.3% 15.2% 20.0% $23.57 93,000 174,700
Pittsburgh A 27,902,992 -559,654 -709,405 -2.5% 13.7% 16.9% $26.48 262,500 554,153
CBD B 5,825,255 147,812 -56,824 -1.0% 17.9% 19.6% $21.95 0 0
Fringe B 5,620,688 -16,510 -167,291 -3.0% 18.8% 19.2% $23.53 0 187,500
Oakland/East End B 1,088,613 -21,275 38,991 3.6% 5.1% 5.1% $21.54 0 0
Urban B 12,534,556 110,027 -185,124 -1.5% 17.2% 18.2% $22.73 0 187,500
North B 2,838,387 15,801 -53,807 -1.9% 11.6% 11.9% $19.03 0 0
Northern I-79/Cranberry B 765,606 -17,976 97,993 12.8% 17.5% 17.5% $22.29 89,074 0
East B 1,464,351 -6,832 14,564 1.0% 34.4% 37.0% $18.69 0 0
South B 2,347,259 -33,926 -85,117 -3.6% 14.8% 17.1% $20.97 80,000 0
Southpointe B 1,062,353 31,928 43,711 4.1% 32.7% 34.8% $22.44 0 0
West B 3,234,922 50,770 131,876 4.1% 20.2% 20.4% $19.92 0 0
Suburban B 11,712,878 39,765 149,220 1.3% 19.8% 20.9% $20.23 169,074 0
Pittsburgh B 24,247,434 149,792 -35,904 -0.1% 18.4% 19.5% $21.32 169,074 187,500