More Related Content Similar to Q2 2023 Pittsburgh Office Insight & Stats (20) 1. © 2023 Jones Lang LaSalle IP, Inc. All rights reserved.
Pittsburgh
As more tenants respond to macroeconomic forces and refine their
workplace strategy, total sublease availability increased to 2.1 million s.f. in
Q2, the highest on record; about 77% of that space is physically vacant.
Sublease space makes up about 14% of all available space for lease in
Pittsburgh’s inventory and 32% of that total was added in 2023. Recent
sublease spaces added include two floors totaling 24,541 s.f. each at SAP’s
local headquarters (271 North Shore Dr.) and nearly 39,000 s.f. at The Tech
Forge (103-107 47th St.) most recently vacated by autonomous trucking
company, Locomation, Inc. which was formerly a subtenant of Aurora.
Q2 marked the 7th consecutive quarter of rising vacancy rates. The quarter
ended with 22.5% total vacancy, a record high for the Pittsburgh market. For
a comparative look back, total vacancy was just 14.9% in Q2 2019 before
hybrid work began notably influencing leasing trends. Some submarkets
are faring better than others. Year-to-date new leasing activity has been
equally divided among the CBD, Fringe, and Northern 1-79/ Cranberry
submarkets. These areas represent nearly 80% of all new deals signed
based on a square foot basis since the start of 2023.
The market remains bifurcated, with direct vacancy in Trophy buildings at
13.6%, Class A buildings at 20.3%, and Class B buildings at 21.1%. Flight to
quality will continue to place upward pressure on underperforming office
product. With the office market experiencing a noticeable contraction, the
need to reimagine what the future of Pittsburgh’s commercial corridors will
look like in the years to come has never been a more pressing topic.
Outlook
The impending threat of commercial loan defaults has recently become a
concern for not only tenants, but for the region at large. With some
landlords experiencing less rental income, the pressure to pay outstanding
debts will rise. Loan defaults can lead to uncertainty for affected tenants
and could ultimately impact property assessments, leading to decreased
tax revenue to fund municipal services in the long term.
Uncertainty looms as sublease space availability
and vacancy reach record highs
• Available sublease space has surpassed 2.1 million s.f., making up
about 14% of all available space for lease in Pittsburgh’s inventory.
• Q2 marked the 7th consecutive quarter of rising vacancy rates.
• The majority of year-to-date new leasing activity has been equally
divided among the highest performing submarkets: CBD, Fringe, and
Northern 1-79/ Cranberry.
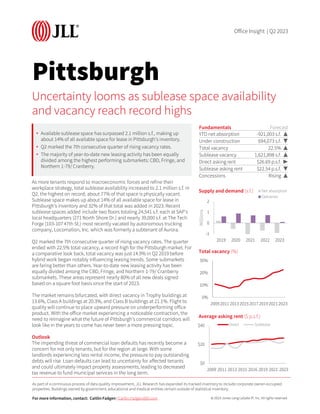
Fundamentals Forecast
YTD net absorption -921,003 s.f. ▲
Under construction 694,073 s.f. ▼
Total vacancy 22.5% ▲
Sublease vacancy 1,621,898 s.f. ▲
Direct asking rent $26.69 p.s.f. ▶
Sublease asking rent $22.54 p.s.f. ▼
Concessions Rising ▲
-1
0
1
2
2019 2020 2021 2022 2023
Millions
Supply and demand (s.f.) Net absorption
Deliveries
0%
10%
20%
30%
20092011201320152017201920212023
Total vacancy (%)
$0
$20
$40
2009 2011 2013 2015 2016 2019 2021 2023
Average asking rent ($ p.s.f.)
Direct Sublease
For more information, contact: Caitlin Fadgen | Caitlin.Fadgen@jll.com
Office Insight | Q2 2023
As part of a continuous process of data quality improvement, JLL Research has expanded its tracked inventory to include corporate owner-occupied
properties. Buildings owned by government, educational and medical entities remain outside of statistical inventory.
2. Pittsburgh | Q2 2023
JLL Research Report
Office Statistics
Class
Inventory
(s.f.)
Total net
absorption
(s.f.)
YTD total net
absorption
(s.f.)
YTD total net
absorption (%
of stock)
Direct vacancy
(%)
Total
vacancy (%)
Average
direct asking
rent ($ p.s.f.)
YTD
Completions
(s.f.)
Under
Development
(s.f.)
Northern I-79 / Cranberry Totals 4,632,441 -67,408 -15,628 -0.3% 18.0% 21.5% $24.53 0 0
East Totals 3,495,270 -45,198 -18,777 -0.5% 28.6% 28.8% $20.56 0 0
North Totals 3,437,870 37,901 27,917 0.8% 16.4% 16.8% $22.28 0 0
South Totals 2,635,470 2,894 1,124 -2.2% 13.6% 13.6% $20.36 0 0
Southpointe Totals 3,811,504 -49,867 -76,308 -2.0% 18.0% 22.4% $22.28 0 0
West Totals 8,878,461 -53,938 -135,902 -0.7% 21.8% 24.5% $22.66 0 180,621
Suburban Totals 26,891,016 -175,616 -217,574 -0.8% 20.0% 22.2% $22.31 0 180,621
CBD Totals 21,565,280 -184,126 -333,496 0.2% 18.3% 20.3% $28.95 0 469,452
Fringe Totals 10,167,017 -234,730 -234,819 -2.3% 18.1% 23.2% $28.27 0 0
Oakland / East End Totals 4,293,706 -126,820 -135,114 -3.1% 31.8% 33.8% $36.29 93,940 0
Urban Totals 36,026,003 -545,676 -703,429 -0.9% 19.9% 22.7% $30.01 93,940 469,452
Pittsburgh Totals 62,917,019 -721,292 -921,003 -0.9% 19.9% 22.5% $26.68 93,940 650,073
Northern I-79 / Cranberry A 3,796,883 -57,262 -6,164 -0.2% 17.4% 21.7% $25.02 0 0
East A 1,539,784 -37,701 -21,636 -1.4% 38.9% 38.9% $21.42 0 0
North A 1,066,854 21,721 21,196 2.0% 20.3% 20.3% $26.66 0 0
South A 220,000 0 0 0.0% 11.3% 11.3% $20.00 0 0
Southpointe A 2,729,151 -27,585 -54,261 -2.0% 15.3% 21.4% $22.87 0 0
West A 4,566,875 -51,316 -134,233 -2.9% 18.7% 23.2% $26.08 0 180,621
Suburban A 13,919,547 -152,143 -195,098 -1.4% 19.9% 23.8% $24.38 0 180,621
CBD A 15,489,946 -151,355 -309,197 -2.0% 16.0% 18.4% $32.51 0 469,452
Fringe A 3,967,553 -62,118 -80,370 -2.0% 15.1% 21.0% $36.83 0 0
Oakland / East End A 2,577,127 33,899 33,899 1.3% 38.9% 40.3% $39.81 93,940 0
Urban A 22,034,626 -179,574 -355,668 -1.6% 18.5% 21.4% $34.64 93,940 469,452
Pittsburgh A 35,954,173 -331,717 -550,766 -1.5% 19.1% 22.3% $30.38 93,940 650,073
Northern I-79 / Cranberry B 835,558 -10,146 -9,464 -1.1% 20.8% 20.8% $22.44 0 0
East B 1,955,486 -7,497 2,859 0.1% 20.6% 20.8% $19.27 0 0
North B 2,371,016 16,180 6,721 0.3% 14.7% 15.2% $19.05 0 0
South B 2,415,470 2,894 1,124 -2.4% 13.9% 13.9% $20.39 0 0
Southpointe B 1,082,353 -22,282 -22,047 -2.0% 24.8% 24.8% $21.27 0 0
West B 4,311,586 -2,622 -1,669 1.6% 25.1% 25.9% $19.60 0 0
Suburban B 12,971,469 -23,473 -22,476 -0.1% 20.1% 20.5% $19.95 0 0
CBD B 6,075,334 -32,771 -24,299 5.7% 24.2% 25.3% $22.25 0 0
Fringe B 6,199,464 -172,612 -154,449 -2.5% 20.0% 24.6% $24.60 0 0
Oakland / East End B 1,716,579 -160,719 -169,013 -9.8% 21.3% 24.0% $27.59 0 0
Urban B 13,991,377 -366,102 -347,761 0.2% 22.0% 24.8% $23.86 0 0
Pittsburgh B 26,962,846 -389,575 -370,237 0.0% 21.1% 22.8% $22.09 0 0
© 2023 Jones Lang LaSalle IP, Inc. All rights reserved. All information contained herein is from sources deemed reliable; however, no representation or warranty is made to the accuracy thereof.