SlideShare a Scribd company logo
1 of 2
Download to read offline
© 2019 Jones Lang LaSalle IP, Inc. All rights reserved. All information contained herein is from sources deemed reliable; however, no representation or warranty is made to the accuracy thereof.
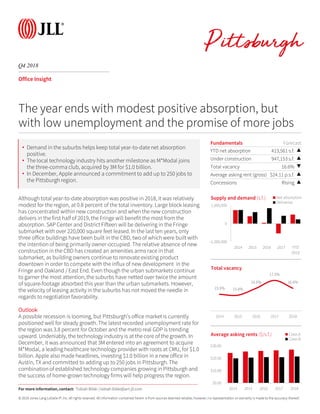
Fundamentals Forecast
YTD net absorption 413,561 s.f. ▲
Under construction 947,153 s.f. ▲
Total vacancy 16.6% ▼
Average asking rent (gross) $24.11 p.s.f. ▲
Concessions Rising ▲
Q4 2018
Office Insight
Although total year-to-date absorption was positive in 2018, it was relatively
modest for the region, at 0.8 percent of the total inventory. Large block leasing
has concentrated within new construction and when the new construction
delivers in the first half of 2019, the Fringe will benefit the most from the
absorption. SAP Center and District Fifteen will be delivering in the Fringe
submarket with over 220,000 square feet leased. In the last ten years, only
three office buildings have been built in the CBD, two of which were built with
the intention of being primarily owner-occupied. The relative absence of new
construction in the CBD has created an amenities arms race in that
submarket, as building owners continue to renovate existing product
downtown in order to compete with the influx of new development in the
Fringe and Oakland / East End. Even though the urban submarkets continue
to garner the most attention, the suburbs have netted over twice the amount
of square-footage absorbed this year than the urban submarkets. However,
the velocity of leasing activity in the suburbs has not moved the needle in
regards to negotiation favorability.
Outlook
A possible recession is looming, but Pittsburgh’s office market is currently
positioned well for steady growth. The latest recorded unemployment rate for
the region was 3.8 percent for October and the metro real GDP is trending
upward. Undeniably, the technology industry is at the core of the growth. In
December, it was announced that 3M entered into an agreement to acquire
M*Modal, a leading healthcare technology provider with roots at CMU, for $1.0
billion. Apple also made headlines, investing $1.0 billion in a new office in
Austin, TX and committed to adding up to 250 jobs in Pittsburgh. The
combination of established technology companies growing in Pittsburgh and
the success of home-grown technology firms will help progress the region.
-1,000,000
0
1,000,000
2014 2015 2016 2017 YTD
2018
Supply and demand (s.f.) Net absorption
Deliveries
The year ends with modest positive absorption, but
with low unemployment and the promise of more jobs
15.9% 15.8%
16.6%
17.5%
16.6%
2014 2015 2016 2017 2018
Total vacancy
$0.00
$10.00
$20.00
$30.00
2014 2015 2016 2017 2018
Average asking rents ($/s.f.) Class A
Class B
For more information, contact: Tobiah Bilski | tobiah.bilski@am.jll.com
• Demand in the suburbs helps keep total year-to-date net absorption
positive.
• The local technology industry hits another milestone as M*Modal joins
the three-comma club, acquired by 3M for $1.0 billion.
• In December, Apple announced a commitment to add up to 250 jobs to
the Pittsburgh region.
© 2019 Jones Lang LaSalle IP, Inc. All rights reserved. All information contained herein is from sources deemed reliable; however, no representation or warranty is made to the accuracy thereof.
Class
Inventory
(s.f.)
Total net
absorption
(s.f.)
YTD total net
absorption
(s.f.)
YTD total net
absorption (%
of stock)
Direct
vacancy (%)
Total
vacancy (%)
Average
direct asking
rent ($ p.s.f.)
YTD
Completions
(s.f.)
Under
Development
(s.f.)
Northern I-79 / Cranberry Totals 4,286,907 -42,008 -31,081 -0.7% 10.0% 18.2% $24.02 0 0
East Totals 3,046,536 -6,464 201 0.0% 26.7% 27.8% $19.59 0 0
North Totals 3,751,808 27,890 89,992 2.4% 10.9% 11.0% $20.23 103,000 0
South Totals 2,306,096 11,393 76,644 3.3% 10.7% 12.3% $19.95 0 0
Southpointe Totals 2,972,107 32,539 70,876 2.4% 14.2% 18.9% $23.01 0 0
West Totals 7,046,426 53,015 85,157 1.2% 17.8% 19.8% $21.72 0 0
Suburban Totals 23,409,880 76,365 291,789 1.2% 15.3% 18.3% $21.40 103,000 0
CBD Totals 18,969,985 -79,804 47,225 0.2% 14.3% 15.1% $27.11 0 50,000
Fringe Totals 8,230,380 -138,366 40,351 0.5% 13.4% 18.5% $24.94 130,500 614,700
Oakland / East End Totals 2,057,356 20,591 34,196 1.7% 2.9% 2.9% $23.94 0 282,453
Urban Totals 29,257,721 -197,579 121,772 0.3% 13.2% 15.1% $26.42 130,500 947,153
Pittsburgh Totals 52,667,601 -121,214 413,561 0.8% 14.2% 16.6% $24.11 233,500 947,153
Northern I-79 / Cranberry A 3,601,749 -23,913 -5,213 -0.1% 7.8% 17.6% $25.73 0 0
East A 1,580,784 -20,833 -17,620 -1.1% 31.6% 31.9% $20.62 0 0
North A 809,347 18,539 80,173 9.9% 10.6% 10.7% $24.84 103,000 0
Southpointe A 1,909,754 13,619 84,717 4.4% 5.9% 11.8% $23.36 0 0
West A 3,767,504 -6,214 67,566 1.8% 16.6% 19.7% $23.56 0 0
Suburban A 11,669,138 -18,802 209,623 1.8% 13.7% 18.8% $23.10 103,000 0
CBD A 13,498,998 -42,870 53,537 0.4% 12.1% 13.1% $30.12 0 50,000
Fringe A 2,388,470 9,672 102,459 4.3% 4.3% 14.1% $29.32 130,500 577,200
Oakland / East End A 969,243 4,291 11,796 1.2% 2.7% 2.7% $27.65 0 240,453
Urban A 16,856,711 -28,907 167,792 1.0% 10.5% 12.6% $29.98 130,500 867,653
Pittsburgh A 28,525,849 -47,709 377,415 1.3% 11.8% 15.1% $27.00 233,500 867,653
Northern I-79 / Cranberry B 685,158 -18,095 -25,868 -3.8% 21.6% 21.6% $20.66 0 0
East B 1,465,752 14,369 17,821 1.2% 21.4% 23.4% $17.95 0 0
North B 2,942,461 9,351 9,819 0.3% 11.0% 11.1% $19.00 0 0
South B 2,306,096 11,393 76,644 3.3% 10.7% 12.3% $19.95 0 0
Southpointe B 1,062,353 18,920 -13,841 -1.3% 29.2% 31.6% $22.85 0 0
West B 3,278,922 59,229 17,591 0.5% 19.3% 20.0% $19.91 0 0
Suburban B 11,740,742 95,167 82,166 0.7% 16.8% 17.8% $19.97 0 0
CBD B 5,470,987 -36,934 -6,312 -0.1% 19.8% 20.3% $22.05 0 0
Fringe B 5,841,910 -148,038 -62,108 -1.1% 17.2% 20.3% $23.69 0 37,500
Oakland / East End B 1,088,113 16,300 22,400 2.1% 3.0% 3.0% $21.04 0 42,000
Urban B 12,401,010 -168,672 -46,020 -0.6% 16.9% 18.7% $22.69 0 79,500
Pittsburgh B 24,141,752 -73,505 36,146 0.2% 17.0% 18.3% $21.44 0 79,500
Q4 2018
Office Statistics
For more information, contact: Tobiah Bilski | tobiah.bilski@am.jll.com

More Related Content

What's hot

JLL Cleveland Office Outlook: Q3 2020
JLL Cleveland Office Outlook: Q3 2020JLL Cleveland Office Outlook: Q3 2020
JLL Cleveland Office Outlook: Q3 2020Andrew Batson
 
Cushman & Wakefield Montreal Americas Marketbeat Office Q12019 #CRE #RealEstate
Cushman & Wakefield Montreal Americas Marketbeat Office Q12019  #CRE #RealEstateCushman & Wakefield Montreal Americas Marketbeat Office Q12019  #CRE #RealEstate
Cushman & Wakefield Montreal Americas Marketbeat Office Q12019 #CRE #RealEstateGuy Masse
 
JLL Pittsburgh Office Insight & Statistics - Q1 2021
JLL Pittsburgh Office Insight & Statistics - Q1 2021JLL Pittsburgh Office Insight & Statistics - Q1 2021
JLL Pittsburgh Office Insight & Statistics - Q1 2021Tobiah Bilski
 
JLL Detroit Office Insight & Statistics - Q1 2019
JLL Detroit Office Insight & Statistics - Q1 2019JLL Detroit Office Insight & Statistics - Q1 2019
JLL Detroit Office Insight & Statistics - Q1 2019Harrison West
 
JLL Cleveland Office Outlook: Q4 2018
JLL Cleveland Office Outlook: Q4 2018JLL Cleveland Office Outlook: Q4 2018
JLL Cleveland Office Outlook: Q4 2018Andrew Batson
 
JLL Detroit Office Insight & Statistics - Q1 2018
JLL Detroit Office Insight & Statistics - Q1 2018JLL Detroit Office Insight & Statistics - Q1 2018
JLL Detroit Office Insight & Statistics - Q1 2018Harrison West
 
JLL West Michigan Industrial Insight & Statistics - Q1 2020
JLL West Michigan Industrial Insight & Statistics - Q1 2020JLL West Michigan Industrial Insight & Statistics - Q1 2020
JLL West Michigan Industrial Insight & Statistics - Q1 2020Harrison West
 
JLL Detroit Office Insight & Statistics – Q2 2016
JLL Detroit Office Insight & Statistics – Q2 2016JLL Detroit Office Insight & Statistics – Q2 2016
JLL Detroit Office Insight & Statistics – Q2 2016Aaron Moore
 
JLL Detroit Office Insight & Statistics - Q4 2018
JLL Detroit Office Insight & Statistics - Q4 2018JLL Detroit Office Insight & Statistics - Q4 2018
JLL Detroit Office Insight & Statistics - Q4 2018Harrison West
 
JLL Cleveland Office Outlook: Q2 2018
JLL Cleveland Office Outlook: Q2 2018JLL Cleveland Office Outlook: Q2 2018
JLL Cleveland Office Outlook: Q2 2018Andrew Batson
 
Pittsburgh Office Insight & Stats Q1 2022
Pittsburgh Office Insight & Stats Q1 2022Pittsburgh Office Insight & Stats Q1 2022
Pittsburgh Office Insight & Stats Q1 2022Tobiah Bilski
 
JLL Detroit Office Insight & Statistics - Q3 2018
JLL Detroit Office Insight & Statistics - Q3 2018JLL Detroit Office Insight & Statistics - Q3 2018
JLL Detroit Office Insight & Statistics - Q3 2018Harrison West
 
JLL Detroit Office Insight & Statistics - Q2 2017
JLL Detroit Office Insight & Statistics - Q2 2017JLL Detroit Office Insight & Statistics - Q2 2017
JLL Detroit Office Insight & Statistics - Q2 2017Harrison West
 
JLL Cleveland Office Outlook: Q2 2018
JLL Cleveland Office Outlook: Q2 2018JLL Cleveland Office Outlook: Q2 2018
JLL Cleveland Office Outlook: Q2 2018Andrew Batson
 
St. Louis Office Outlook Q3 2016
St. Louis Office Outlook Q3 2016St. Louis Office Outlook Q3 2016
St. Louis Office Outlook Q3 2016Blaise Tomazic
 
JLL Grand Rapids Office Insight & Statistics - Q3 2017
JLL Grand Rapids Office Insight & Statistics - Q3 2017JLL Grand Rapids Office Insight & Statistics - Q3 2017
JLL Grand Rapids Office Insight & Statistics - Q3 2017Harrison West
 
JLL Cincinnati Office Outlook Q4 2020
JLL Cincinnati Office Outlook Q4 2020JLL Cincinnati Office Outlook Q4 2020
JLL Cincinnati Office Outlook Q4 2020Abby Armbruster
 
JLL Grand Rapids Office Insight & Statistics - Q1 2019
JLL Grand Rapids Office Insight & Statistics - Q1 2019JLL Grand Rapids Office Insight & Statistics - Q1 2019
JLL Grand Rapids Office Insight & Statistics - Q1 2019Harrison West
 
JLL Grand Rapids Office Insight & Statistics - Q1 2020
JLL Grand Rapids Office Insight & Statistics - Q1 2020JLL Grand Rapids Office Insight & Statistics - Q1 2020
JLL Grand Rapids Office Insight & Statistics - Q1 2020Harrison West
 

What's hot (20)

JLL Cleveland Office Outlook: Q3 2020
JLL Cleveland Office Outlook: Q3 2020JLL Cleveland Office Outlook: Q3 2020
JLL Cleveland Office Outlook: Q3 2020
 
Cushman & Wakefield Montreal Americas Marketbeat Office Q12019 #CRE #RealEstate
Cushman & Wakefield Montreal Americas Marketbeat Office Q12019  #CRE #RealEstateCushman & Wakefield Montreal Americas Marketbeat Office Q12019  #CRE #RealEstate
Cushman & Wakefield Montreal Americas Marketbeat Office Q12019 #CRE #RealEstate
 
JLL Pittsburgh Office Insight & Statistics - Q1 2021
JLL Pittsburgh Office Insight & Statistics - Q1 2021JLL Pittsburgh Office Insight & Statistics - Q1 2021
JLL Pittsburgh Office Insight & Statistics - Q1 2021
 
JLL Detroit Office Insight & Statistics - Q1 2019
JLL Detroit Office Insight & Statistics - Q1 2019JLL Detroit Office Insight & Statistics - Q1 2019
JLL Detroit Office Insight & Statistics - Q1 2019
 
JLL Cleveland Office Outlook: Q4 2018
JLL Cleveland Office Outlook: Q4 2018JLL Cleveland Office Outlook: Q4 2018
JLL Cleveland Office Outlook: Q4 2018
 
JLL Detroit Office Insight & Statistics - Q1 2018
JLL Detroit Office Insight & Statistics - Q1 2018JLL Detroit Office Insight & Statistics - Q1 2018
JLL Detroit Office Insight & Statistics - Q1 2018
 
JLL West Michigan Industrial Insight & Statistics - Q1 2020
JLL West Michigan Industrial Insight & Statistics - Q1 2020JLL West Michigan Industrial Insight & Statistics - Q1 2020
JLL West Michigan Industrial Insight & Statistics - Q1 2020
 
JLL Detroit Office Insight & Statistics – Q2 2016
JLL Detroit Office Insight & Statistics – Q2 2016JLL Detroit Office Insight & Statistics – Q2 2016
JLL Detroit Office Insight & Statistics – Q2 2016
 
JLL Detroit Office Insight & Statistics - Q4 2018
JLL Detroit Office Insight & Statistics - Q4 2018JLL Detroit Office Insight & Statistics - Q4 2018
JLL Detroit Office Insight & Statistics - Q4 2018
 
JLL Cleveland Office Outlook: Q2 2018
JLL Cleveland Office Outlook: Q2 2018JLL Cleveland Office Outlook: Q2 2018
JLL Cleveland Office Outlook: Q2 2018
 
Pittsburgh Office Insight & Stats Q1 2022
Pittsburgh Office Insight & Stats Q1 2022Pittsburgh Office Insight & Stats Q1 2022
Pittsburgh Office Insight & Stats Q1 2022
 
JLL Detroit Office Insight & Statistics - Q3 2018
JLL Detroit Office Insight & Statistics - Q3 2018JLL Detroit Office Insight & Statistics - Q3 2018
JLL Detroit Office Insight & Statistics - Q3 2018
 
JLL Detroit Office Insight & Statistics - Q2 2017
JLL Detroit Office Insight & Statistics - Q2 2017JLL Detroit Office Insight & Statistics - Q2 2017
JLL Detroit Office Insight & Statistics - Q2 2017
 
JLL Cleveland Office Outlook: Q2 2018
JLL Cleveland Office Outlook: Q2 2018JLL Cleveland Office Outlook: Q2 2018
JLL Cleveland Office Outlook: Q2 2018
 
St. Louis Office Outlook Q3 2016
St. Louis Office Outlook Q3 2016St. Louis Office Outlook Q3 2016
St. Louis Office Outlook Q3 2016
 
JLL Houston 2018 Q1 Office Market Report
JLL Houston 2018 Q1 Office Market ReportJLL Houston 2018 Q1 Office Market Report
JLL Houston 2018 Q1 Office Market Report
 
JLL Grand Rapids Office Insight & Statistics - Q3 2017
JLL Grand Rapids Office Insight & Statistics - Q3 2017JLL Grand Rapids Office Insight & Statistics - Q3 2017
JLL Grand Rapids Office Insight & Statistics - Q3 2017
 
JLL Cincinnati Office Outlook Q4 2020
JLL Cincinnati Office Outlook Q4 2020JLL Cincinnati Office Outlook Q4 2020
JLL Cincinnati Office Outlook Q4 2020
 
JLL Grand Rapids Office Insight & Statistics - Q1 2019
JLL Grand Rapids Office Insight & Statistics - Q1 2019JLL Grand Rapids Office Insight & Statistics - Q1 2019
JLL Grand Rapids Office Insight & Statistics - Q1 2019
 
JLL Grand Rapids Office Insight & Statistics - Q1 2020
JLL Grand Rapids Office Insight & Statistics - Q1 2020JLL Grand Rapids Office Insight & Statistics - Q1 2020
JLL Grand Rapids Office Insight & Statistics - Q1 2020
 

Similar to JLL Pittsburgh Office Insight & Statistics - Q4 2018

JLL Pittsburgh Office Insight & Statistics - Q1 2018
JLL Pittsburgh Office Insight & Statistics - Q1 2018JLL Pittsburgh Office Insight & Statistics - Q1 2018
JLL Pittsburgh Office Insight & Statistics - Q1 2018Tobiah Bilski
 
JLL Pittsburgh Office Insight & Statistics - Q4 2017
JLL Pittsburgh Office Insight & Statistics - Q4 2017JLL Pittsburgh Office Insight & Statistics - Q4 2017
JLL Pittsburgh Office Insight & Statistics - Q4 2017Tobiah Bilski
 
JLL Pittsburgh Office Insight & Statistics - Q1 2019
JLL Pittsburgh Office Insight & Statistics - Q1 2019JLL Pittsburgh Office Insight & Statistics - Q1 2019
JLL Pittsburgh Office Insight & Statistics - Q1 2019Tobiah Bilski
 
JLL Pittsburgh Office Insight & Statistics - Q3 2018
JLL Pittsburgh Office Insight & Statistics - Q3 2018JLL Pittsburgh Office Insight & Statistics - Q3 2018
JLL Pittsburgh Office Insight & Statistics - Q3 2018Tobiah Bilski
 
JLL Pittsburgh Office Insight & Statistics - Q3 2017
JLL Pittsburgh Office Insight & Statistics - Q3 2017JLL Pittsburgh Office Insight & Statistics - Q3 2017
JLL Pittsburgh Office Insight & Statistics - Q3 2017Tobiah Bilski
 
JLL Pittsburgh Office Insight & Statistics - Q3 2021
JLL Pittsburgh Office Insight & Statistics - Q3 2021JLL Pittsburgh Office Insight & Statistics - Q3 2021
JLL Pittsburgh Office Insight & Statistics - Q3 2021Tobiah Bilski
 
Pittsburgh Office Insight & Stats Q4 2021
Pittsburgh Office Insight & Stats Q4 2021Pittsburgh Office Insight & Stats Q4 2021
Pittsburgh Office Insight & Stats Q4 2021Tobiah Bilski
 
JLL Cleveland Office Outlook: Q1 2018
JLL Cleveland Office Outlook: Q1 2018JLL Cleveland Office Outlook: Q1 2018
JLL Cleveland Office Outlook: Q1 2018Andrew Batson
 
JLL Pittsburgh Industrial Insight & Statistics - Q3 2018
JLL Pittsburgh Industrial Insight & Statistics - Q3 2018JLL Pittsburgh Industrial Insight & Statistics - Q3 2018
JLL Pittsburgh Industrial Insight & Statistics - Q3 2018Tobiah Bilski
 
Q2 2023 Pittsburgh Office Insight & Stats
Q2 2023 Pittsburgh Office Insight & StatsQ2 2023 Pittsburgh Office Insight & Stats
Q2 2023 Pittsburgh Office Insight & StatsCaitlin Fadgen
 
JLL Pittsburgh Office Insight & Statistics - Q2 2021
JLL Pittsburgh Office Insight & Statistics - Q2 2021JLL Pittsburgh Office Insight & Statistics - Q2 2021
JLL Pittsburgh Office Insight & Statistics - Q2 2021Tobiah Bilski
 
JLL Cleveland Office Outlook: Q4 2020
JLL Cleveland Office Outlook: Q4 2020JLL Cleveland Office Outlook: Q4 2020
JLL Cleveland Office Outlook: Q4 2020Andrew Batson
 
JLL Pittsburgh Industrial Insight & Statistics - Q2 2018
JLL Pittsburgh Industrial Insight & Statistics - Q2 2018JLL Pittsburgh Industrial Insight & Statistics - Q2 2018
JLL Pittsburgh Industrial Insight & Statistics - Q2 2018Tobiah Bilski
 
JLL Louisville Office Outlook - Q3 2019
JLL Louisville Office Outlook - Q3 2019JLL Louisville Office Outlook - Q3 2019
JLL Louisville Office Outlook - Q3 2019Alex Westcott
 
JLL Pittsburgh Industrial Insight & Statistics - Q3 2019
JLL Pittsburgh Industrial Insight & Statistics - Q3 2019JLL Pittsburgh Industrial Insight & Statistics - Q3 2019
JLL Pittsburgh Industrial Insight & Statistics - Q3 2019Tobiah Bilski
 
JLL Cincinnati Industrial Outlook Q4 2020
JLL Cincinnati Industrial Outlook Q4 2020JLL Cincinnati Industrial Outlook Q4 2020
JLL Cincinnati Industrial Outlook Q4 2020Abby Armbruster
 
JLL Cleveland Office Outlook: Q1 2018
JLL Cleveland Office Outlook: Q1 2018JLL Cleveland Office Outlook: Q1 2018
JLL Cleveland Office Outlook: Q1 2018Andrew Batson
 
JLL Cleveland Office Outlook: Q1 2018
JLL Cleveland Office Outlook: Q1 2018JLL Cleveland Office Outlook: Q1 2018
JLL Cleveland Office Outlook: Q1 2018Andrew Batson
 

Similar to JLL Pittsburgh Office Insight & Statistics - Q4 2018 (18)

JLL Pittsburgh Office Insight & Statistics - Q1 2018
JLL Pittsburgh Office Insight & Statistics - Q1 2018JLL Pittsburgh Office Insight & Statistics - Q1 2018
JLL Pittsburgh Office Insight & Statistics - Q1 2018
 
JLL Pittsburgh Office Insight & Statistics - Q4 2017
JLL Pittsburgh Office Insight & Statistics - Q4 2017JLL Pittsburgh Office Insight & Statistics - Q4 2017
JLL Pittsburgh Office Insight & Statistics - Q4 2017
 
JLL Pittsburgh Office Insight & Statistics - Q1 2019
JLL Pittsburgh Office Insight & Statistics - Q1 2019JLL Pittsburgh Office Insight & Statistics - Q1 2019
JLL Pittsburgh Office Insight & Statistics - Q1 2019
 
JLL Pittsburgh Office Insight & Statistics - Q3 2018
JLL Pittsburgh Office Insight & Statistics - Q3 2018JLL Pittsburgh Office Insight & Statistics - Q3 2018
JLL Pittsburgh Office Insight & Statistics - Q3 2018
 
JLL Pittsburgh Office Insight & Statistics - Q3 2017
JLL Pittsburgh Office Insight & Statistics - Q3 2017JLL Pittsburgh Office Insight & Statistics - Q3 2017
JLL Pittsburgh Office Insight & Statistics - Q3 2017
 
JLL Pittsburgh Office Insight & Statistics - Q3 2021
JLL Pittsburgh Office Insight & Statistics - Q3 2021JLL Pittsburgh Office Insight & Statistics - Q3 2021
JLL Pittsburgh Office Insight & Statistics - Q3 2021
 
Pittsburgh Office Insight & Stats Q4 2021
Pittsburgh Office Insight & Stats Q4 2021Pittsburgh Office Insight & Stats Q4 2021
Pittsburgh Office Insight & Stats Q4 2021
 
JLL Cleveland Office Outlook: Q1 2018
JLL Cleveland Office Outlook: Q1 2018JLL Cleveland Office Outlook: Q1 2018
JLL Cleveland Office Outlook: Q1 2018
 
JLL Pittsburgh Industrial Insight & Statistics - Q3 2018
JLL Pittsburgh Industrial Insight & Statistics - Q3 2018JLL Pittsburgh Industrial Insight & Statistics - Q3 2018
JLL Pittsburgh Industrial Insight & Statistics - Q3 2018
 
Q2 2023 Pittsburgh Office Insight & Stats
Q2 2023 Pittsburgh Office Insight & StatsQ2 2023 Pittsburgh Office Insight & Stats
Q2 2023 Pittsburgh Office Insight & Stats
 
JLL Pittsburgh Office Insight & Statistics - Q2 2021
JLL Pittsburgh Office Insight & Statistics - Q2 2021JLL Pittsburgh Office Insight & Statistics - Q2 2021
JLL Pittsburgh Office Insight & Statistics - Q2 2021
 
JLL Cleveland Office Outlook: Q4 2020
JLL Cleveland Office Outlook: Q4 2020JLL Cleveland Office Outlook: Q4 2020
JLL Cleveland Office Outlook: Q4 2020
 
JLL Pittsburgh Industrial Insight & Statistics - Q2 2018
JLL Pittsburgh Industrial Insight & Statistics - Q2 2018JLL Pittsburgh Industrial Insight & Statistics - Q2 2018
JLL Pittsburgh Industrial Insight & Statistics - Q2 2018
 
JLL Louisville Office Outlook - Q3 2019
JLL Louisville Office Outlook - Q3 2019JLL Louisville Office Outlook - Q3 2019
JLL Louisville Office Outlook - Q3 2019
 
JLL Pittsburgh Industrial Insight & Statistics - Q3 2019
JLL Pittsburgh Industrial Insight & Statistics - Q3 2019JLL Pittsburgh Industrial Insight & Statistics - Q3 2019
JLL Pittsburgh Industrial Insight & Statistics - Q3 2019
 
JLL Cincinnati Industrial Outlook Q4 2020
JLL Cincinnati Industrial Outlook Q4 2020JLL Cincinnati Industrial Outlook Q4 2020
JLL Cincinnati Industrial Outlook Q4 2020
 
JLL Cleveland Office Outlook: Q1 2018
JLL Cleveland Office Outlook: Q1 2018JLL Cleveland Office Outlook: Q1 2018
JLL Cleveland Office Outlook: Q1 2018
 
JLL Cleveland Office Outlook: Q1 2018
JLL Cleveland Office Outlook: Q1 2018JLL Cleveland Office Outlook: Q1 2018
JLL Cleveland Office Outlook: Q1 2018
 

More from Tobiah Bilski

JLL Pittsburgh Industrial Insight & Statistics - Q4 2021
JLL Pittsburgh Industrial Insight & Statistics - Q4 2021JLL Pittsburgh Industrial Insight & Statistics - Q4 2021
JLL Pittsburgh Industrial Insight & Statistics - Q4 2021Tobiah Bilski
 
JLL Pittsburgh Industrial Insight & Statistics - Q3 2021
JLL Pittsburgh Industrial Insight & Statistics - Q3 2021JLL Pittsburgh Industrial Insight & Statistics - Q3 2021
JLL Pittsburgh Industrial Insight & Statistics - Q3 2021Tobiah Bilski
 
JLL Pittsburgh Industrial Insight & Statistics - Q2 2021
JLL Pittsburgh Industrial Insight & Statistics - Q2 2021JLL Pittsburgh Industrial Insight & Statistics - Q2 2021
JLL Pittsburgh Industrial Insight & Statistics - Q2 2021Tobiah Bilski
 
JLL Pittsburgh Industrial Insight & Statistics - Q1 2021
JLL Pittsburgh Industrial Insight & Statistics - Q1 2021JLL Pittsburgh Industrial Insight & Statistics - Q1 2021
JLL Pittsburgh Industrial Insight & Statistics - Q1 2021Tobiah Bilski
 
JLL Pittsburgh Industrial Insight & Statistics - Q4 2020
JLL Pittsburgh Industrial Insight & Statistics - Q4 2020JLL Pittsburgh Industrial Insight & Statistics - Q4 2020
JLL Pittsburgh Industrial Insight & Statistics - Q4 2020Tobiah Bilski
 
JLL Pittsburgh Industrial Insight & Statistics - Q3 2020
JLL Pittsburgh Industrial Insight & Statistics - Q3 2020JLL Pittsburgh Industrial Insight & Statistics - Q3 2020
JLL Pittsburgh Industrial Insight & Statistics - Q3 2020Tobiah Bilski
 
JLL Pittsburgh Industrial Insight & Statistics - Q2 2020
JLL Pittsburgh Industrial Insight & Statistics - Q2 2020JLL Pittsburgh Industrial Insight & Statistics - Q2 2020
JLL Pittsburgh Industrial Insight & Statistics - Q2 2020Tobiah Bilski
 
JLL Pittsburgh Industrial Insight & Statistics - Q1 2020
JLL Pittsburgh Industrial Insight & Statistics - Q1 2020JLL Pittsburgh Industrial Insight & Statistics - Q1 2020
JLL Pittsburgh Industrial Insight & Statistics - Q1 2020Tobiah Bilski
 
JLL Pittsburgh Industrial Insight & Statistics - Q4 2019
JLL Pittsburgh Industrial Insight & Statistics - Q4 2019JLL Pittsburgh Industrial Insight & Statistics - Q4 2019
JLL Pittsburgh Industrial Insight & Statistics - Q4 2019Tobiah Bilski
 
JLL Pittsburgh Industrial Insight & Statistics - Q2 2019
JLL Pittsburgh Industrial Insight & Statistics - Q2 2019JLL Pittsburgh Industrial Insight & Statistics - Q2 2019
JLL Pittsburgh Industrial Insight & Statistics - Q2 2019Tobiah Bilski
 
JLL Pittsburgh Industrial Insight & Statistics - Q1 2019
JLL Pittsburgh Industrial Insight & Statistics - Q1 2019JLL Pittsburgh Industrial Insight & Statistics - Q1 2019
JLL Pittsburgh Industrial Insight & Statistics - Q1 2019Tobiah Bilski
 
JLL Pittsburgh Industrial Insight & Statistics - Q4 2018
JLL Pittsburgh Industrial Insight & Statistics - Q4 2018JLL Pittsburgh Industrial Insight & Statistics - Q4 2018
JLL Pittsburgh Industrial Insight & Statistics - Q4 2018Tobiah Bilski
 
JLL Pittsburgh Industrial Insight & Statistics - Q1 2018
JLL Pittsburgh Industrial Insight & Statistics - Q1 2018JLL Pittsburgh Industrial Insight & Statistics - Q1 2018
JLL Pittsburgh Industrial Insight & Statistics - Q1 2018Tobiah Bilski
 

More from Tobiah Bilski (13)

JLL Pittsburgh Industrial Insight & Statistics - Q4 2021
JLL Pittsburgh Industrial Insight & Statistics - Q4 2021JLL Pittsburgh Industrial Insight & Statistics - Q4 2021
JLL Pittsburgh Industrial Insight & Statistics - Q4 2021
 
JLL Pittsburgh Industrial Insight & Statistics - Q3 2021
JLL Pittsburgh Industrial Insight & Statistics - Q3 2021JLL Pittsburgh Industrial Insight & Statistics - Q3 2021
JLL Pittsburgh Industrial Insight & Statistics - Q3 2021
 
JLL Pittsburgh Industrial Insight & Statistics - Q2 2021
JLL Pittsburgh Industrial Insight & Statistics - Q2 2021JLL Pittsburgh Industrial Insight & Statistics - Q2 2021
JLL Pittsburgh Industrial Insight & Statistics - Q2 2021
 
JLL Pittsburgh Industrial Insight & Statistics - Q1 2021
JLL Pittsburgh Industrial Insight & Statistics - Q1 2021JLL Pittsburgh Industrial Insight & Statistics - Q1 2021
JLL Pittsburgh Industrial Insight & Statistics - Q1 2021
 
JLL Pittsburgh Industrial Insight & Statistics - Q4 2020
JLL Pittsburgh Industrial Insight & Statistics - Q4 2020JLL Pittsburgh Industrial Insight & Statistics - Q4 2020
JLL Pittsburgh Industrial Insight & Statistics - Q4 2020
 
JLL Pittsburgh Industrial Insight & Statistics - Q3 2020
JLL Pittsburgh Industrial Insight & Statistics - Q3 2020JLL Pittsburgh Industrial Insight & Statistics - Q3 2020
JLL Pittsburgh Industrial Insight & Statistics - Q3 2020
 
JLL Pittsburgh Industrial Insight & Statistics - Q2 2020
JLL Pittsburgh Industrial Insight & Statistics - Q2 2020JLL Pittsburgh Industrial Insight & Statistics - Q2 2020
JLL Pittsburgh Industrial Insight & Statistics - Q2 2020
 
JLL Pittsburgh Industrial Insight & Statistics - Q1 2020
JLL Pittsburgh Industrial Insight & Statistics - Q1 2020JLL Pittsburgh Industrial Insight & Statistics - Q1 2020
JLL Pittsburgh Industrial Insight & Statistics - Q1 2020
 
JLL Pittsburgh Industrial Insight & Statistics - Q4 2019
JLL Pittsburgh Industrial Insight & Statistics - Q4 2019JLL Pittsburgh Industrial Insight & Statistics - Q4 2019
JLL Pittsburgh Industrial Insight & Statistics - Q4 2019
 
JLL Pittsburgh Industrial Insight & Statistics - Q2 2019
JLL Pittsburgh Industrial Insight & Statistics - Q2 2019JLL Pittsburgh Industrial Insight & Statistics - Q2 2019
JLL Pittsburgh Industrial Insight & Statistics - Q2 2019
 
JLL Pittsburgh Industrial Insight & Statistics - Q1 2019
JLL Pittsburgh Industrial Insight & Statistics - Q1 2019JLL Pittsburgh Industrial Insight & Statistics - Q1 2019
JLL Pittsburgh Industrial Insight & Statistics - Q1 2019
 
JLL Pittsburgh Industrial Insight & Statistics - Q4 2018
JLL Pittsburgh Industrial Insight & Statistics - Q4 2018JLL Pittsburgh Industrial Insight & Statistics - Q4 2018
JLL Pittsburgh Industrial Insight & Statistics - Q4 2018
 
JLL Pittsburgh Industrial Insight & Statistics - Q1 2018
JLL Pittsburgh Industrial Insight & Statistics - Q1 2018JLL Pittsburgh Industrial Insight & Statistics - Q1 2018
JLL Pittsburgh Industrial Insight & Statistics - Q1 2018
 

Recently uploaded

Escort—>Call GiRls In Mori Gate Delhi —>8447779280—Service Escorts In South D...
Escort—>Call GiRls In Mori Gate Delhi —>8447779280—Service Escorts In South D...Escort—>Call GiRls In Mori Gate Delhi —>8447779280—Service Escorts In South D...
Escort—>Call GiRls In Mori Gate Delhi —>8447779280—Service Escorts In South D...asmaqueen5
 
Nyati Elite NIBM Road Pune E Brochure.pdf
Nyati Elite NIBM Road Pune E Brochure.pdfNyati Elite NIBM Road Pune E Brochure.pdf
Nyati Elite NIBM Road Pune E Brochure.pdfabbu831446
 
Cheap Rate ✨➥9582086666▻✨Call Girls In Gurgaon Sector 34 (Gurgaon)
Cheap Rate ✨➥9582086666▻✨Call Girls In Gurgaon Sector 34 (Gurgaon)Cheap Rate ✨➥9582086666▻✨Call Girls In Gurgaon Sector 34 (Gurgaon)
Cheap Rate ✨➥9582086666▻✨Call Girls In Gurgaon Sector 34 (Gurgaon)delhi24hrs1
 
Rohan Harita Tathawade Pune Brochure.pdf
Rohan Harita Tathawade Pune Brochure.pdfRohan Harita Tathawade Pune Brochure.pdf
Rohan Harita Tathawade Pune Brochure.pdfabbu831446
 
Call Girls in Maurice Nagar (Delhi) ꧁8447779280꧂ Female Escorts Service in De...
Call Girls in Maurice Nagar (Delhi) ꧁8447779280꧂ Female Escorts Service in De...Call Girls in Maurice Nagar (Delhi) ꧁8447779280꧂ Female Escorts Service in De...
Call Girls in Maurice Nagar (Delhi) ꧁8447779280꧂ Female Escorts Service in De...asmaqueen5
 
Kohinoor Teiko Hinjewadi Phase 2 Pune E-Brochure.pdf
Kohinoor Teiko Hinjewadi Phase 2 Pune  E-Brochure.pdfKohinoor Teiko Hinjewadi Phase 2 Pune  E-Brochure.pdf
Kohinoor Teiko Hinjewadi Phase 2 Pune E-Brochure.pdfManishSaxena95
 
MEQ Mainstreet Equity Corp Q2 2024 Investor Presentation
MEQ Mainstreet Equity Corp Q2 2024 Investor PresentationMEQ Mainstreet Equity Corp Q2 2024 Investor Presentation
MEQ Mainstreet Equity Corp Q2 2024 Investor PresentationMEQ - Mainstreet Equity Corp.
 
Cheap Rate ✨➥9582086666▻✨Call Girls In Gurgaon Sector 11 (Gurgaon)
Cheap Rate ✨➥9582086666▻✨Call Girls In Gurgaon Sector 11 (Gurgaon)Cheap Rate ✨➥9582086666▻✨Call Girls In Gurgaon Sector 11 (Gurgaon)
Cheap Rate ✨➥9582086666▻✨Call Girls In Gurgaon Sector 11 (Gurgaon)delhi24hrs1
 
Ganga Platinum Kharadi Pune brochure.pdf
Ganga Platinum Kharadi Pune brochure.pdfGanga Platinum Kharadi Pune brochure.pdf
Ganga Platinum Kharadi Pune brochure.pdfsabhyara24
 
Bridge & Elliot Ladner Floor Plans May 2024.pdf
Bridge & Elliot Ladner Floor Plans May 2024.pdfBridge & Elliot Ladner Floor Plans May 2024.pdf
Bridge & Elliot Ladner Floor Plans May 2024.pdfVickyAulakh1
 
Acibadem Konaklari Uskudar - Listin Turkey
Acibadem Konaklari Uskudar - Listin TurkeyAcibadem Konaklari Uskudar - Listin Turkey
Acibadem Konaklari Uskudar - Listin TurkeyListing Turkey
 
Low Rate ✨➥9582086666▻✨Call Girls In Gurgaon Sector 23 (Gurgaon)
Low Rate ✨➥9582086666▻✨Call Girls In Gurgaon Sector 23 (Gurgaon)Low Rate ✨➥9582086666▻✨Call Girls In Gurgaon Sector 23 (Gurgaon)
Low Rate ✨➥9582086666▻✨Call Girls In Gurgaon Sector 23 (Gurgaon)delhi24hrs1
 
Low Rate ✨➥9582086666▻✨Call Girls In Gurgaon Sector 35 (Gurgaon)
Low Rate ✨➥9582086666▻✨Call Girls In Gurgaon Sector 35 (Gurgaon)Low Rate ✨➥9582086666▻✨Call Girls In Gurgaon Sector 35 (Gurgaon)
Low Rate ✨➥9582086666▻✨Call Girls In Gurgaon Sector 35 (Gurgaon)delhi24hrs1
 
SVN Live 5.13.24 Weekly Property Broadcast
SVN Live 5.13.24 Weekly Property BroadcastSVN Live 5.13.24 Weekly Property Broadcast
SVN Live 5.13.24 Weekly Property BroadcastSVN International Corp.
 
Housing Price Regulation Thesis Defense by Slidesgo.pptx
Housing Price Regulation Thesis Defense by Slidesgo.pptxHousing Price Regulation Thesis Defense by Slidesgo.pptx
Housing Price Regulation Thesis Defense by Slidesgo.pptxcosmo-soil
 
Low rate ↬Call girls in Sabzi Mandi Delhi | 8447779280}Escort Service In All ...
Low rate ↬Call girls in Sabzi Mandi Delhi | 8447779280}Escort Service In All ...Low rate ↬Call girls in Sabzi Mandi Delhi | 8447779280}Escort Service In All ...
Low rate ↬Call girls in Sabzi Mandi Delhi | 8447779280}Escort Service In All ...asmaqueen5
 
Low Rate Call girls in Sant Nagar{Delhi }8447779280} Service Escorts In South...
Low Rate Call girls in Sant Nagar{Delhi }8447779280} Service Escorts In South...Low Rate Call girls in Sant Nagar{Delhi }8447779280} Service Escorts In South...
Low Rate Call girls in Sant Nagar{Delhi }8447779280} Service Escorts In South...asmaqueen5
 
~Call Girls In Roop Nagar {8447779280}(Low Price) Escort Service In Delhi
~Call Girls In Roop Nagar {8447779280}(Low Price) Escort Service In Delhi~Call Girls In Roop Nagar {8447779280}(Low Price) Escort Service In Delhi
~Call Girls In Roop Nagar {8447779280}(Low Price) Escort Service In Delhiasmaqueen5
 
Low Rate ✨➥9711108085▻✨Call Girls In East Of Kailash (E.K) (Delhi)
Low Rate ✨➥9711108085▻✨Call Girls In East Of Kailash (E.K) (Delhi)Low Rate ✨➥9711108085▻✨Call Girls In East Of Kailash (E.K) (Delhi)
Low Rate ✨➥9711108085▻✨Call Girls In East Of Kailash (E.K) (Delhi)delhi24hrs1
 
Eldeco Dwarka Project In Delhi-brochure.pdf.pdf
Eldeco Dwarka Project In Delhi-brochure.pdf.pdfEldeco Dwarka Project In Delhi-brochure.pdf.pdf
Eldeco Dwarka Project In Delhi-brochure.pdf.pdfkratirudram
 

Recently uploaded (20)

Escort—>Call GiRls In Mori Gate Delhi —>8447779280—Service Escorts In South D...
Escort—>Call GiRls In Mori Gate Delhi —>8447779280—Service Escorts In South D...Escort—>Call GiRls In Mori Gate Delhi —>8447779280—Service Escorts In South D...
Escort—>Call GiRls In Mori Gate Delhi —>8447779280—Service Escorts In South D...
 
Nyati Elite NIBM Road Pune E Brochure.pdf
Nyati Elite NIBM Road Pune E Brochure.pdfNyati Elite NIBM Road Pune E Brochure.pdf
Nyati Elite NIBM Road Pune E Brochure.pdf
 
Cheap Rate ✨➥9582086666▻✨Call Girls In Gurgaon Sector 34 (Gurgaon)
Cheap Rate ✨➥9582086666▻✨Call Girls In Gurgaon Sector 34 (Gurgaon)Cheap Rate ✨➥9582086666▻✨Call Girls In Gurgaon Sector 34 (Gurgaon)
Cheap Rate ✨➥9582086666▻✨Call Girls In Gurgaon Sector 34 (Gurgaon)
 
Rohan Harita Tathawade Pune Brochure.pdf
Rohan Harita Tathawade Pune Brochure.pdfRohan Harita Tathawade Pune Brochure.pdf
Rohan Harita Tathawade Pune Brochure.pdf
 
Call Girls in Maurice Nagar (Delhi) ꧁8447779280꧂ Female Escorts Service in De...
Call Girls in Maurice Nagar (Delhi) ꧁8447779280꧂ Female Escorts Service in De...Call Girls in Maurice Nagar (Delhi) ꧁8447779280꧂ Female Escorts Service in De...
Call Girls in Maurice Nagar (Delhi) ꧁8447779280꧂ Female Escorts Service in De...
 
Kohinoor Teiko Hinjewadi Phase 2 Pune E-Brochure.pdf
Kohinoor Teiko Hinjewadi Phase 2 Pune  E-Brochure.pdfKohinoor Teiko Hinjewadi Phase 2 Pune  E-Brochure.pdf
Kohinoor Teiko Hinjewadi Phase 2 Pune E-Brochure.pdf
 
MEQ Mainstreet Equity Corp Q2 2024 Investor Presentation
MEQ Mainstreet Equity Corp Q2 2024 Investor PresentationMEQ Mainstreet Equity Corp Q2 2024 Investor Presentation
MEQ Mainstreet Equity Corp Q2 2024 Investor Presentation
 
Cheap Rate ✨➥9582086666▻✨Call Girls In Gurgaon Sector 11 (Gurgaon)
Cheap Rate ✨➥9582086666▻✨Call Girls In Gurgaon Sector 11 (Gurgaon)Cheap Rate ✨➥9582086666▻✨Call Girls In Gurgaon Sector 11 (Gurgaon)
Cheap Rate ✨➥9582086666▻✨Call Girls In Gurgaon Sector 11 (Gurgaon)
 
Ganga Platinum Kharadi Pune brochure.pdf
Ganga Platinum Kharadi Pune brochure.pdfGanga Platinum Kharadi Pune brochure.pdf
Ganga Platinum Kharadi Pune brochure.pdf
 
Bridge & Elliot Ladner Floor Plans May 2024.pdf
Bridge & Elliot Ladner Floor Plans May 2024.pdfBridge & Elliot Ladner Floor Plans May 2024.pdf
Bridge & Elliot Ladner Floor Plans May 2024.pdf
 
Acibadem Konaklari Uskudar - Listin Turkey
Acibadem Konaklari Uskudar - Listin TurkeyAcibadem Konaklari Uskudar - Listin Turkey
Acibadem Konaklari Uskudar - Listin Turkey
 
Low Rate ✨➥9582086666▻✨Call Girls In Gurgaon Sector 23 (Gurgaon)
Low Rate ✨➥9582086666▻✨Call Girls In Gurgaon Sector 23 (Gurgaon)Low Rate ✨➥9582086666▻✨Call Girls In Gurgaon Sector 23 (Gurgaon)
Low Rate ✨➥9582086666▻✨Call Girls In Gurgaon Sector 23 (Gurgaon)
 
Low Rate ✨➥9582086666▻✨Call Girls In Gurgaon Sector 35 (Gurgaon)
Low Rate ✨➥9582086666▻✨Call Girls In Gurgaon Sector 35 (Gurgaon)Low Rate ✨➥9582086666▻✨Call Girls In Gurgaon Sector 35 (Gurgaon)
Low Rate ✨➥9582086666▻✨Call Girls In Gurgaon Sector 35 (Gurgaon)
 
SVN Live 5.13.24 Weekly Property Broadcast
SVN Live 5.13.24 Weekly Property BroadcastSVN Live 5.13.24 Weekly Property Broadcast
SVN Live 5.13.24 Weekly Property Broadcast
 
Housing Price Regulation Thesis Defense by Slidesgo.pptx
Housing Price Regulation Thesis Defense by Slidesgo.pptxHousing Price Regulation Thesis Defense by Slidesgo.pptx
Housing Price Regulation Thesis Defense by Slidesgo.pptx
 
Low rate ↬Call girls in Sabzi Mandi Delhi | 8447779280}Escort Service In All ...
Low rate ↬Call girls in Sabzi Mandi Delhi | 8447779280}Escort Service In All ...Low rate ↬Call girls in Sabzi Mandi Delhi | 8447779280}Escort Service In All ...
Low rate ↬Call girls in Sabzi Mandi Delhi | 8447779280}Escort Service In All ...
 
Low Rate Call girls in Sant Nagar{Delhi }8447779280} Service Escorts In South...
Low Rate Call girls in Sant Nagar{Delhi }8447779280} Service Escorts In South...Low Rate Call girls in Sant Nagar{Delhi }8447779280} Service Escorts In South...
Low Rate Call girls in Sant Nagar{Delhi }8447779280} Service Escorts In South...
 
~Call Girls In Roop Nagar {8447779280}(Low Price) Escort Service In Delhi
~Call Girls In Roop Nagar {8447779280}(Low Price) Escort Service In Delhi~Call Girls In Roop Nagar {8447779280}(Low Price) Escort Service In Delhi
~Call Girls In Roop Nagar {8447779280}(Low Price) Escort Service In Delhi
 
Low Rate ✨➥9711108085▻✨Call Girls In East Of Kailash (E.K) (Delhi)
Low Rate ✨➥9711108085▻✨Call Girls In East Of Kailash (E.K) (Delhi)Low Rate ✨➥9711108085▻✨Call Girls In East Of Kailash (E.K) (Delhi)
Low Rate ✨➥9711108085▻✨Call Girls In East Of Kailash (E.K) (Delhi)
 
Eldeco Dwarka Project In Delhi-brochure.pdf.pdf
Eldeco Dwarka Project In Delhi-brochure.pdf.pdfEldeco Dwarka Project In Delhi-brochure.pdf.pdf
Eldeco Dwarka Project In Delhi-brochure.pdf.pdf
 

JLL Pittsburgh Office Insight & Statistics - Q4 2018

  • 1. © 2019 Jones Lang LaSalle IP, Inc. All rights reserved. All information contained herein is from sources deemed reliable; however, no representation or warranty is made to the accuracy thereof. Fundamentals Forecast YTD net absorption 413,561 s.f. ▲ Under construction 947,153 s.f. ▲ Total vacancy 16.6% ▼ Average asking rent (gross) $24.11 p.s.f. ▲ Concessions Rising ▲ Q4 2018 Office Insight Although total year-to-date absorption was positive in 2018, it was relatively modest for the region, at 0.8 percent of the total inventory. Large block leasing has concentrated within new construction and when the new construction delivers in the first half of 2019, the Fringe will benefit the most from the absorption. SAP Center and District Fifteen will be delivering in the Fringe submarket with over 220,000 square feet leased. In the last ten years, only three office buildings have been built in the CBD, two of which were built with the intention of being primarily owner-occupied. The relative absence of new construction in the CBD has created an amenities arms race in that submarket, as building owners continue to renovate existing product downtown in order to compete with the influx of new development in the Fringe and Oakland / East End. Even though the urban submarkets continue to garner the most attention, the suburbs have netted over twice the amount of square-footage absorbed this year than the urban submarkets. However, the velocity of leasing activity in the suburbs has not moved the needle in regards to negotiation favorability. Outlook A possible recession is looming, but Pittsburgh’s office market is currently positioned well for steady growth. The latest recorded unemployment rate for the region was 3.8 percent for October and the metro real GDP is trending upward. Undeniably, the technology industry is at the core of the growth. In December, it was announced that 3M entered into an agreement to acquire M*Modal, a leading healthcare technology provider with roots at CMU, for $1.0 billion. Apple also made headlines, investing $1.0 billion in a new office in Austin, TX and committed to adding up to 250 jobs in Pittsburgh. The combination of established technology companies growing in Pittsburgh and the success of home-grown technology firms will help progress the region. -1,000,000 0 1,000,000 2014 2015 2016 2017 YTD 2018 Supply and demand (s.f.) Net absorption Deliveries The year ends with modest positive absorption, but with low unemployment and the promise of more jobs 15.9% 15.8% 16.6% 17.5% 16.6% 2014 2015 2016 2017 2018 Total vacancy $0.00 $10.00 $20.00 $30.00 2014 2015 2016 2017 2018 Average asking rents ($/s.f.) Class A Class B For more information, contact: Tobiah Bilski | tobiah.bilski@am.jll.com • Demand in the suburbs helps keep total year-to-date net absorption positive. • The local technology industry hits another milestone as M*Modal joins the three-comma club, acquired by 3M for $1.0 billion. • In December, Apple announced a commitment to add up to 250 jobs to the Pittsburgh region.
  • 2. © 2019 Jones Lang LaSalle IP, Inc. All rights reserved. All information contained herein is from sources deemed reliable; however, no representation or warranty is made to the accuracy thereof. Class Inventory (s.f.) Total net absorption (s.f.) YTD total net absorption (s.f.) YTD total net absorption (% of stock) Direct vacancy (%) Total vacancy (%) Average direct asking rent ($ p.s.f.) YTD Completions (s.f.) Under Development (s.f.) Northern I-79 / Cranberry Totals 4,286,907 -42,008 -31,081 -0.7% 10.0% 18.2% $24.02 0 0 East Totals 3,046,536 -6,464 201 0.0% 26.7% 27.8% $19.59 0 0 North Totals 3,751,808 27,890 89,992 2.4% 10.9% 11.0% $20.23 103,000 0 South Totals 2,306,096 11,393 76,644 3.3% 10.7% 12.3% $19.95 0 0 Southpointe Totals 2,972,107 32,539 70,876 2.4% 14.2% 18.9% $23.01 0 0 West Totals 7,046,426 53,015 85,157 1.2% 17.8% 19.8% $21.72 0 0 Suburban Totals 23,409,880 76,365 291,789 1.2% 15.3% 18.3% $21.40 103,000 0 CBD Totals 18,969,985 -79,804 47,225 0.2% 14.3% 15.1% $27.11 0 50,000 Fringe Totals 8,230,380 -138,366 40,351 0.5% 13.4% 18.5% $24.94 130,500 614,700 Oakland / East End Totals 2,057,356 20,591 34,196 1.7% 2.9% 2.9% $23.94 0 282,453 Urban Totals 29,257,721 -197,579 121,772 0.3% 13.2% 15.1% $26.42 130,500 947,153 Pittsburgh Totals 52,667,601 -121,214 413,561 0.8% 14.2% 16.6% $24.11 233,500 947,153 Northern I-79 / Cranberry A 3,601,749 -23,913 -5,213 -0.1% 7.8% 17.6% $25.73 0 0 East A 1,580,784 -20,833 -17,620 -1.1% 31.6% 31.9% $20.62 0 0 North A 809,347 18,539 80,173 9.9% 10.6% 10.7% $24.84 103,000 0 Southpointe A 1,909,754 13,619 84,717 4.4% 5.9% 11.8% $23.36 0 0 West A 3,767,504 -6,214 67,566 1.8% 16.6% 19.7% $23.56 0 0 Suburban A 11,669,138 -18,802 209,623 1.8% 13.7% 18.8% $23.10 103,000 0 CBD A 13,498,998 -42,870 53,537 0.4% 12.1% 13.1% $30.12 0 50,000 Fringe A 2,388,470 9,672 102,459 4.3% 4.3% 14.1% $29.32 130,500 577,200 Oakland / East End A 969,243 4,291 11,796 1.2% 2.7% 2.7% $27.65 0 240,453 Urban A 16,856,711 -28,907 167,792 1.0% 10.5% 12.6% $29.98 130,500 867,653 Pittsburgh A 28,525,849 -47,709 377,415 1.3% 11.8% 15.1% $27.00 233,500 867,653 Northern I-79 / Cranberry B 685,158 -18,095 -25,868 -3.8% 21.6% 21.6% $20.66 0 0 East B 1,465,752 14,369 17,821 1.2% 21.4% 23.4% $17.95 0 0 North B 2,942,461 9,351 9,819 0.3% 11.0% 11.1% $19.00 0 0 South B 2,306,096 11,393 76,644 3.3% 10.7% 12.3% $19.95 0 0 Southpointe B 1,062,353 18,920 -13,841 -1.3% 29.2% 31.6% $22.85 0 0 West B 3,278,922 59,229 17,591 0.5% 19.3% 20.0% $19.91 0 0 Suburban B 11,740,742 95,167 82,166 0.7% 16.8% 17.8% $19.97 0 0 CBD B 5,470,987 -36,934 -6,312 -0.1% 19.8% 20.3% $22.05 0 0 Fringe B 5,841,910 -148,038 -62,108 -1.1% 17.2% 20.3% $23.69 0 37,500 Oakland / East End B 1,088,113 16,300 22,400 2.1% 3.0% 3.0% $21.04 0 42,000 Urban B 12,401,010 -168,672 -46,020 -0.6% 16.9% 18.7% $22.69 0 79,500 Pittsburgh B 24,141,752 -73,505 36,146 0.2% 17.0% 18.3% $21.44 0 79,500 Q4 2018 Office Statistics For more information, contact: Tobiah Bilski | tobiah.bilski@am.jll.com