Submit Search
Upload
JLL Pittsburgh Office Insight & Statistics - Q3 2021
•
0 likes
•
25 views
T
Tobiah Bilski
Follow
The third quarter experienced positive absorption as leasing slowly recovers.
Read less
Read more
Real Estate
Report
Share
Report
Share
1 of 2
Download now
Download to read offline
Recommended
JLL Pittsburgh Industrial Insight & Statistics - Q3 2017
Tobiah Bilski
JLL Pittsburgh Office Insight & Statistics - Q2 2021
Tobiah Bilski
JLL Pittsburgh Office Outlook - Q4 2015
Andrew Batson
JLL Pittsburgh Industrial Insight & Statistics - Q2 2021
Tobiah Bilski
JLL Pittsburgh Industrial Insight & Statistics - Q3 2021
Tobiah Bilski
JLL Pittsburgh Industrial Insight & Statistics - Q1 2021
Tobiah Bilski
JLL Pittsburgh Industrial Insight & Statistics - Q4 2021
Tobiah Bilski
JLL West Michigan Industrial Insight & Statistics - Q1 2020
Harrison West
JLL Cleveland Industrial Outlook: Q3 2018
Andrew Batson
JLL Pittsburgh Industrial Insight & Statistics - Q2 2020
Tobiah Bilski
JLL Pittsburgh Office Insight & Statistics - Q3 2017
Tobiah Bilski
JLL - Tampa Bay 2018 Q2 Industrial Outlook
Kyle Koller
JLL Pittsburgh Office Insight & Statistics - Q1 2020
Tobiah Bilski
JLL Pittsburgh Industrial Insight & Statistics - Q3 2018
Tobiah Bilski
JLL Detroit Industrial Insight & Statistics - Q2 2017
Harrison West
JLL West Michigan Industrial Insight & Statistics - Q1 2019
Harrison West
JLL Pittsburgh Industrial Insight & Statistics - Q3 2019
Tobiah Bilski
JLL Pittsburgh Industrial Insight & Statistics - Q3 2020
Tobiah Bilski
JLL Cincinnati Industrial Outlook Q1 2021
Abby Armbruster
JLL Pittsburgh Industrial Insight & Statistics - Q4 201itt
Tobiah Bilski
JLL Pittsburgh Industrial Insight & Statistics - Q1 2020
Tobiah Bilski
JLL Pittsburgh Office Insight & Statistics - Q1 2018
Tobiah Bilski
JLL - Tampa Bay 2018 Q1 Industrial Outlook
Kyle Koller
JLL West Michigan Industrial Insight & Statistics - Q2 2019
Harrison West
JLL Pittsburgh Industrial Insight & Statistics - Q4 2019
Tobiah Bilski
JLL Cleveland Industrial Outlook: Q4 2018
Andrew Batson
JLL Cleveland Industrial Outlook: Q4 2018
Andrew Batson
JLL Pittsburgh Industrial Insight & Statistics - Q2 2018
Tobiah Bilski
JLL Pittsburgh Office Insight & Statistics - Q1 2021
Tobiah Bilski
JLL Pittsburgh Office Insight & Statistics - Q3 2018
Tobiah Bilski
More Related Content
What's hot
JLL Cleveland Industrial Outlook: Q3 2018
Andrew Batson
JLL Pittsburgh Industrial Insight & Statistics - Q2 2020
Tobiah Bilski
JLL Pittsburgh Office Insight & Statistics - Q3 2017
Tobiah Bilski
JLL - Tampa Bay 2018 Q2 Industrial Outlook
Kyle Koller
JLL Pittsburgh Office Insight & Statistics - Q1 2020
Tobiah Bilski
JLL Pittsburgh Industrial Insight & Statistics - Q3 2018
Tobiah Bilski
JLL Detroit Industrial Insight & Statistics - Q2 2017
Harrison West
JLL West Michigan Industrial Insight & Statistics - Q1 2019
Harrison West
JLL Pittsburgh Industrial Insight & Statistics - Q3 2019
Tobiah Bilski
JLL Pittsburgh Industrial Insight & Statistics - Q3 2020
Tobiah Bilski
JLL Cincinnati Industrial Outlook Q1 2021
Abby Armbruster
JLL Pittsburgh Industrial Insight & Statistics - Q4 201itt
Tobiah Bilski
JLL Pittsburgh Industrial Insight & Statistics - Q1 2020
Tobiah Bilski
JLL Pittsburgh Office Insight & Statistics - Q1 2018
Tobiah Bilski
JLL - Tampa Bay 2018 Q1 Industrial Outlook
Kyle Koller
JLL West Michigan Industrial Insight & Statistics - Q2 2019
Harrison West
JLL Pittsburgh Industrial Insight & Statistics - Q4 2019
Tobiah Bilski
JLL Cleveland Industrial Outlook: Q4 2018
Andrew Batson
JLL Cleveland Industrial Outlook: Q4 2018
Andrew Batson
JLL Pittsburgh Industrial Insight & Statistics - Q2 2018
Tobiah Bilski
What's hot
(20)
JLL Cleveland Industrial Outlook: Q3 2018
JLL Pittsburgh Industrial Insight & Statistics - Q2 2020
JLL Pittsburgh Office Insight & Statistics - Q3 2017
JLL - Tampa Bay 2018 Q2 Industrial Outlook
JLL Pittsburgh Office Insight & Statistics - Q1 2020
JLL Pittsburgh Industrial Insight & Statistics - Q3 2018
JLL Detroit Industrial Insight & Statistics - Q2 2017
JLL West Michigan Industrial Insight & Statistics - Q1 2019
JLL Pittsburgh Industrial Insight & Statistics - Q3 2019
JLL Pittsburgh Industrial Insight & Statistics - Q3 2020
JLL Cincinnati Industrial Outlook Q1 2021
JLL Pittsburgh Industrial Insight & Statistics - Q4 201itt
JLL Pittsburgh Industrial Insight & Statistics - Q1 2020
JLL Pittsburgh Office Insight & Statistics - Q1 2018
JLL - Tampa Bay 2018 Q1 Industrial Outlook
JLL West Michigan Industrial Insight & Statistics - Q2 2019
JLL Pittsburgh Industrial Insight & Statistics - Q4 2019
JLL Cleveland Industrial Outlook: Q4 2018
JLL Pittsburgh Industrial Insight & Statistics - Q2 2018
Similar to JLL Pittsburgh Office Insight & Statistics - Q3 2021
JLL Pittsburgh Office Insight & Statistics - Q1 2021
Tobiah Bilski
JLL Pittsburgh Office Insight & Statistics - Q3 2018
Tobiah Bilski
JLL Pittsburgh Office Insight & Statistics - Q4 2018
Tobiah Bilski
JLL Pittsburgh Office Insight & Statistics - Q4 2017
Tobiah Bilski
Pittsburgh Office Insight & Stats Q4 2021
Tobiah Bilski
JLL Pittsburgh Office Insight & Statistics - Q4 2019
Tobiah Bilski
JLL Pittsburgh Office Insight & Statistics - Q2 2019
Tobiah Bilski
Pittsburgh Office Insight & Stats Q1 2022
Tobiah Bilski
JLL Pittsburgh Office Insight & Statistics - Q2 2018
Tobiah Bilski
JLL Pittsburgh Office Insight & Statistics - Q3 2019
Tobiah Bilski
JLL Cleveland Office Outlook: Q4 2020
Andrew Batson
JLL Pittsburgh Office Insight & Statistics - Q2 2020
Tobiah Bilski
JLL Detroit Office Insight & Statistics – Q2 2016
Aaron Moore
JLL Pittsburgh Office Insight & Statistics - Q1 2019
Tobiah Bilski
Q2 2023 Pittsburgh Office Insight & Stats
Caitlin Fadgen
JLL Cleveland Office Outlook: Q4 2018
Andrew Batson
JLL Detroit Office Insight & Statistics - Q3 2018
Harrison West
JLL Cincinnati Office Insight & Statistics - Q2 2016
Ross Bratcher
JLL Detroit Office Insight & Statistics - Q1 2019
Harrison West
JLL Pittsburgh Industrial Insight & Statistics - Q4 2018
Tobiah Bilski
Similar to JLL Pittsburgh Office Insight & Statistics - Q3 2021
(20)
JLL Pittsburgh Office Insight & Statistics - Q1 2021
JLL Pittsburgh Office Insight & Statistics - Q3 2018
JLL Pittsburgh Office Insight & Statistics - Q4 2018
JLL Pittsburgh Office Insight & Statistics - Q4 2017
Pittsburgh Office Insight & Stats Q4 2021
JLL Pittsburgh Office Insight & Statistics - Q4 2019
JLL Pittsburgh Office Insight & Statistics - Q2 2019
Pittsburgh Office Insight & Stats Q1 2022
JLL Pittsburgh Office Insight & Statistics - Q2 2018
JLL Pittsburgh Office Insight & Statistics - Q3 2019
JLL Cleveland Office Outlook: Q4 2020
JLL Pittsburgh Office Insight & Statistics - Q2 2020
JLL Detroit Office Insight & Statistics – Q2 2016
JLL Pittsburgh Office Insight & Statistics - Q1 2019
Q2 2023 Pittsburgh Office Insight & Stats
JLL Cleveland Office Outlook: Q4 2018
JLL Detroit Office Insight & Statistics - Q3 2018
JLL Cincinnati Office Insight & Statistics - Q2 2016
JLL Detroit Office Insight & Statistics - Q1 2019
JLL Pittsburgh Industrial Insight & Statistics - Q4 2018
Recently uploaded
Dynamic Netsoft A leader In Property management Software
Dynamic Netsoft
Eco-Efficient Living: Redefining Sustainability through Leech's Green Design ...
Newman George Leech
Low Rate Call Girls in Triveni Complex Delhi Call 9990771857
delhimodel235
How to Build Multifamily and Laneway Suites in Toronto!! (feat. Expert Archi...
Volition Properties
Cashpay_Call Girls In Gaur City Mall Noida ❤️8860477959 Escorts Service In 24...
lizamodels9
Namrata 7 Plumeria Drive Pimpri Chinchwad Pune Brochure.pdf
PrachiRudram
Call Girls in Model Town Delhi 💯Call Us 🔝8264348440🔝
soniya singh
Call Girls in Kashmiri Gate Delhi 💯Call Us 🔝8264348440🔝
soniya singh
9990771857 Call Girls in Noida Sector 1 Noida (Call Girls) Delhi
delhimodel235
8 Key Elements for Comfortable Farmland Living
Farmland Bazaar
Ajmera Prive at Juhu, Mumbai E-Brochure.pdf
ManishSaxena95
9990771857 Call Girls in Noida Sector 06 Noida (Call Girls) Delhi
delhimodel235
Low Rate Call Girls in Triveni Complex Delhi Call 9873940964
Call Girls In Delhi Whatsup 9873940964 Enjoy Unlimited Pleasure
Sobha Aranya Sector 80 Gurgaon E- Brochure.pdf
faheemali990101
Hot call girls in Moti Bagh🔝 9953056974 🔝 escort Service
9953056974 Low Rate Call Girls In Saket, Delhi NCR
9990771857 Call Girls in Noida Sector 11 Noida (Call Girls) Delhi
delhimodel235
Call Girls In Mayur Vihar-1 Delhi ❤️8860477959 Good Looking Escorts In 24/7 D...
lizamodels9
call girls in Shahdara (DELHI) 🔝 >༒9953330565🔝 genuine Escort Service 🔝✔️✔️
9953056974 Low Rate Call Girls In Saket, Delhi NCR
young call girls in Lajpat Nagar,🔝 9953056974 🔝 escort Service
9953056974 Low Rate Call Girls In Saket, Delhi NCR
Purva Palm Hills Devanahalli, Bangalore E- Brochure.pdf
faheemali990101
Recently uploaded
(20)
Dynamic Netsoft A leader In Property management Software
Eco-Efficient Living: Redefining Sustainability through Leech's Green Design ...
Low Rate Call Girls in Triveni Complex Delhi Call 9990771857
How to Build Multifamily and Laneway Suites in Toronto!! (feat. Expert Archi...
Cashpay_Call Girls In Gaur City Mall Noida ❤️8860477959 Escorts Service In 24...
Namrata 7 Plumeria Drive Pimpri Chinchwad Pune Brochure.pdf
Call Girls in Model Town Delhi 💯Call Us 🔝8264348440🔝
Call Girls in Kashmiri Gate Delhi 💯Call Us 🔝8264348440🔝
9990771857 Call Girls in Noida Sector 1 Noida (Call Girls) Delhi
8 Key Elements for Comfortable Farmland Living
Ajmera Prive at Juhu, Mumbai E-Brochure.pdf
9990771857 Call Girls in Noida Sector 06 Noida (Call Girls) Delhi
Low Rate Call Girls in Triveni Complex Delhi Call 9873940964
Sobha Aranya Sector 80 Gurgaon E- Brochure.pdf
Hot call girls in Moti Bagh🔝 9953056974 🔝 escort Service
9990771857 Call Girls in Noida Sector 11 Noida (Call Girls) Delhi
Call Girls In Mayur Vihar-1 Delhi ❤️8860477959 Good Looking Escorts In 24/7 D...
call girls in Shahdara (DELHI) 🔝 >༒9953330565🔝 genuine Escort Service 🔝✔️✔️
young call girls in Lajpat Nagar,🔝 9953056974 🔝 escort Service
Purva Palm Hills Devanahalli, Bangalore E- Brochure.pdf
JLL Pittsburgh Office Insight & Statistics - Q3 2021
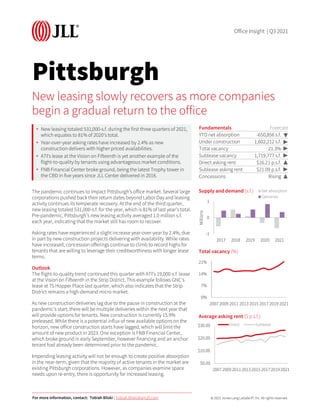
1.
© 2021 Jones
Lang LaSalle IP, Inc. All rights reserved. Pittsburgh The pandemic continues to impact Pittsburgh’s office market. Several large corporations pushed back their return dates beyond Labor Day and leasing activity continues its temperate recovery. At the end of the third quarter, new leasing totaled 531,000-s.f. for the year, which is 81% of last year’s total. Pre-pandemic, Pittsburgh’s new leasing activity averaged 1.0 million s.f. each year, indicating that the market still has room to recover. Asking rates have experienced a slight increase year-over-year by 2.4%, due in part by new construction projects delivering with availability. While rates have increased, concession offerings continue to climb to record highs for tenants that are willing to leverage their creditworthiness with longer lease terms. Outlook The flight-to-quality trend continued this quarter with ATI’s 19,000-s.f. lease at the Vision on Fifteenth in the Strip District. This example follows GNC’s lease at 75 Hopper Place last quarter, which also indicates that the Strip District remains a high-demand micro market. As new construction deliveries lag due to the pause in construction at the pandemic’s start, there will be multiple deliveries within the next year that will provide options for tenants. New construction is currently 15.9% preleased. While there is a potential influx of new available options on the horizon, new office construction starts have lagged, which will limit the amount of new product in 2023. One exception is FNB Financial Center, which broke ground in early September, however financing and an anchor tenant had already been determined prior to the pandemic. Impending leasing activity will not be enough to create positive absorption in the near-term, given that the majority of active tenants in the market are existing Pittsburgh corporations. However, as companies examine space needs upon re-entry, there is opportunity for increased leasing. New leasing slowly recovers as more companies begin a gradual return to the office • New leasing totaled 531,000-s.f. during the first three quarters of 2021, which equates to 81% of 2020’s total. • Year-over-year asking rates have increased by 2.4% as new construction delivers with higher priced availabilities. • ATI’s lease at the Vision on Fifteenth is yet another example of the flight-to-quality by tenants using advantageous market conditions. • FNB Financial Center broke ground, being the latest Trophy tower in the CBD in five years since JLL Center delivered in 2016. Fundamentals Forecast YTD net absorption -650,856 s.f. Under construction 1,602,212 s.f. Total vacancy 21.3% Sublease vacancy 1,719,777 s.f. ▶ Direct asking rent $26.21 p.s.f. ▲ Sublease asking rent $21.09 p.s.f. ▶ Concessions Rising ▲ -1 0 1 2017 2018 2019 2020 2021 Millions Supply and demand (s.f.) Net absorption Deliveries 0% 7% 14% 21% 2007 2009 2011 2013 2015 2017 2019 2021 Total vacancy (%) $0.00 $10.00 $20.00 $30.00 20072009201120132015201720192021 Average asking rent ($ p.s.f.) Direct Sublease For more information, contact: Tobiah Bilski | Tobiah.Bilski@am.jll.com Office Insight | Q3 2021 ▶ ▶ ▶
2.
Pittsburgh | Q3
2021 JLL Research Report Office Statistics Class Inventory (s.f.) Total net absorption (s.f.) YTD total net absorption (s.f.) YTD total net absorption (% of stock) Direct vacancy (%) Total vacancy (%) Average direct asking rent ($ p.s.f.) YTD Completions (s.f.) Under Development (s.f.) Northern I-79 / Cranberry Totals 4,376,907 11,767 6,249 0.1% 15.8% 22.1% $25.13 0 0 East Totals 3,008,814 15,879 3,441 0.1% 29.8% 30.3% $20.17 0 0 North Totals 2,818,655 -26,684 -121,302 -4.3% 16.0% 16.8% $22.88 0 100,000 South Totals 2,451,420 3,027 20,800 0.8% 13.0% 13.0% $20.29 0 0 Southpointe Totals 3,532,244 39,756 -99,167 -2.8% 15.7% 26.3% $21.51 0 0 West Totals 7,449,393 113,856 -188,238 -2.5% 21.9% 23.5% $22.16 0 0 Suburban Totals 23,637,433 157,601 -378,217 -1.6% 19.2% 22.6% $22.07 0 100,000 CBD Totals 18,972,607 -10,359 -366,283 -1.9% 17.9% 21.0% $26.88 0 0 Fringe Totals 8,420,722 35,225 69,499 0.8% 15.7% 19.3% $29.32 120,000 1,064,563 Oakland / East End Totals 2,999,896 88,045 24,145 0.8% 17.4% 18.2% $38.65 224,813 437,649 Urban Totals 30,393,225 112,911 -272,639 -0.9% 17.2% 20.2% $29.38 344,813 1,502,212 Pittsburgh Totals 54,030,658 270,512 -650,856 -1.2% 18.1% 21.3% $26.21 344,813 1,602,212 Northern I-79 / Cranberry A 3,691,749 5,764 -8,823 -0.2% 15.2% 22.6% $25.59 0 0 East A 1,535,784 15,530 -1,305 -0.1% 39.4% 39.8% $21.29 0 0 North A 855,815 -3,613 -42,038 -4.9% 18.4% 18.6% $26.80 0 100,000 South A 220,000 367 367 0.2% 12.5% 12.5% $20.00 0 0 Southpointe A 2,449,891 34,891 -88,590 -3.6% 10.4% 24.9% $22.60 0 0 West A 4,162,490 78,581 -136,789 -3.3% 19.0% 20.8% $24.04 0 0 Suburban A 12,915,729 131,520 -277,178 -2.1% 18.5% 24.1% $23.76 0 100,000 CBD A 13,512,018 30,476 -19,637 -0.1% 14.5% 18.1% $30.32 0 0 Fringe A 2,616,526 37,917 154,023 5.9% 7.2% 12.1% $37.28 120,000 1,006,063 Oakland / East End A 1,683,709 59,244 21,412 1.3% 22.9% 23.8% $41.19 224,813 437,649 Urban A 17,812,253 127,637 155,798 0.9% 14.3% 17.7% $34.19 344,813 1,443,712 Pittsburgh A 30,727,982 259,157 -121,380 -0.4% 16.0% 20.4% $29.84 344,813 1,543,712 Northern I-79 / Cranberry B 685,158 6,003 15,072 2.2% 19.0% 19.7% $23.31 0 0 East B 1,473,030 349 4,746 0.3% 19.8% 20.4% $17.87 0 0 North B 1,962,840 -23,071 -79,264 -4.0% 15.0% 16.0% $19.77 0 0 South B 2,231,420 2,660 20,433 0.9% 13.0% 13.0% $20.32 0 0 Southpointe B 1,082,353 4,865 -10,577 -1.0% 27.7% 29.4% $20.54 0 0 West B 3,286,903 35,275 -51,449 -1.6% 25.5% 26.8% $20.54 0 0 Suburban B 10,721,704 26,081 -101,039 -0.9% 20.0% 20.9% $20.22 0 0 CBD B 5,460,589 -40,835 -346,646 -6.3% 26.2% 28.1% $22.09 0 0 Fringe B 5,804,196 -2,692 -84,524 -1.5% 19.5% 22.5% $24.57 0 58,500 Oakland / East End B 1,316,187 28,801 2,733 0.2% 10.3% 10.9% $24.46 0 0 Urban B 12,580,972 -14,726 -428,437 -3.4% 21.4% 23.7% $23.27 0 58,500 Pittsburgh B 23,302,676 11,355 -529,476 -2.3% 20.8% 22.4% $21.89 0 58,500 © 2021 Jones Lang LaSalle IP, Inc. All rights reserved. All information contained herein is from sources deemed reliable; however, no representation or warranty is made to the accuracy thereof.
Download now