SlideShare a Scribd company logo
1 of 2
Download to read offline
© 2021 Jones Lang LaSalle IP, Inc. All rights reserved.
Pittsburgh
Pittsburgh’s office market experienced approximately 600,000 s.f. of
negative absorption in the first quarter of 2021 as several of Pittsburgh’s
headquarter companies placed large blocks on the market. CNX added over
110,000 s.f. of its Southpointe headquarters for sublease while Giant Eagle
chose not to renew their 76,000-s.f. headquarters lease at 701 Alpha Drive.
Although sublease availabilities have put upward pressure on total vacancy,
which ended Q1 at 20.6%, tenant interest has begun to increase and there is
an overall sense that activity is starting to return.
Outlook
While activity has been stagnant the past 12 months, office re-entry is
anticipated to return to approximately 80% by the end of the year as
vaccines are distributed across the region. The return to the office may
cause further footprint corrections to account for new ways of working and
this will be the driving factor for real estate decisions in the foreseeable
future.
In addition to new strategies from tenants, new construction deliveries that
have not been preleased may push vacancy higher in the short-term,
putting downward pressure on asking rates. However, with emphasis on
employee health, amenities and overall quality of work-life, there is
opportunity for buildings positioned to optimize employee well-being to
capture leasing activity during this period of footprint correction.
Remote work and hybrid work will have an impact as well on leasing
demand. COVID-19 has proven to companies that there can be a successful
implementation of remote-work for employees. However, with remote work
comes with the cost of lost culture and collaboration. Without in-person
collaboration, the affinity distance between coworkers grows and attrition
becomes a higher threat.
Leasing activity slowly begins to rise; however,
new sublease availabilities negate absorption
• Total vacancy surpasses 20.5% as sublease availabilities continue to
drive negative absorption across the market.
• Direct asking rental rates saw a slight decrease in Q1 and will likely
continue on a downward trend in 2021 due to softened demand.
• Tenants are still planning for future growth as Gecko Robotics signed
a 67,897-s.f. lease for its new headquarters at Nova Place and Google
expanded by two floors at Bakery Square.
• As a result from slower leasing demand in 2020, free rent concessions
have doubled since prior to COVID-19.
Fundamentals Forecast
YTD net absorption -602,907 s.f.
Under construction 1,685,187 s.f.
Total vacancy 20.6%
Sublease vacancy 1,828,501 s.f. ▶
Direct asking rent $26.01 p.s.f.
Sublease asking rent $24.23 p.s.f. ▶
Concessions Rising ▲
-1
0
1
2
2017 2018 2019 2020 2021
Millions
Supply and demand (s.f.) Net absorption
Deliveries
14%
16%
18%
20%
22%
2007 2009 2011 2013 2015 2017 2019 2021
Total vacancy (%)
$10.00
$15.00
$20.00
$25.00
$30.00
20072009201120132015201720192021
Average asking rent ($ p.s.f.)
Direct Sublease
For more information, contact: Tobiah Bilski | Tobiah.Bilski@am.jll.com
Office Insight | Q1 2021
▲
▶
▶
▶
Pittsburgh | Q1 2021
JLL Research Report
Office Statistics
Class
Inventory
(s.f.)
Total net
absorption
(s.f.)
YTD total net
absorption
(s.f.)
YTD total net
absorption (%
of stock)
Direct vacancy
(%)
Total vacancy
(%)
Average
direct asking
rent ($ p.s.f.)
YTD
Completions
(s.f.)
Under
Development
(s.f.)
Northern I-79 / Cranberry Totals 4,376,907 16,901 16,901 0.4% 15.5% 21.9% $25.01 0 0
East Totals 3,053,814 -21,187 -21,187 -0.7% 30.2% 30.7% $20.07 0 0
North Totals 3,777,851 -75,295 -75,295 -2.0% 14.5% 15.1% $20.63 0 0
South Totals 2,311,420 12,408 12,408 0.5% 14.1% 14.1% $20.31 0 140,000
Southpointe Totals 3,529,607 -150,596 -150,596 -4.3% 16.6% 27.7% $21.92 0 0
West Totals 7,445,828 -210,905 -210,905 -2.8% 20.5% 23.8% $22.00 0 0
Suburban Totals 24,495,427 -428,674 -428,674 -1.8% 18.7% 22.6% $21.78 0 140,000
CBD Totals 18,972,607 -101,263 -101,263 -0.5% 16.5% 19.6% $27.28 0 0
Fringe Totals 8,801,410 -38,758 -38,758 -0.4% 17.0% 20.1% $28.75 0 649,367
Oakland / East End Totals 2,699,409 -34,212 -34,212 -1.3% 10.3% 11.4% $41.31 0 895,820
Urban Totals 30,473,426 -174,233 -174,233 -0.6% 16.1% 19.0% $29.42 0 1,545,187
Pittsburgh Totals 54,968,853 -602,907 -602,907 -1.1% 17.3% 20.6% $26.01 0 1,685,187
Northern I-79 / Cranberry A 3,691,749 16,740 16,740 0.5% 14.3% 21.9% $25.48 0 0
East A 1,580,784 -16,075 -16,075 -1.0% 39.2% 39.6% $21.19 0 0
North A 855,815 4,293 4,293 0.5% 13.0% 13.2% $24.88 0 0
South A 80,000 0 0 0.0% 34.9% 34.9% $20.00 0 140,000
Southpointe A 2,447,254 -143,801 -143,801 -5.9% 11.6% 27.2% $23.25 0 0
West A 4,160,571 -133,735 -133,735 -3.2% 16.3% 20.8% $23.82 0 0
Suburban A 12,816,173 -272,578 -272,578 -2.1% 17.6% 24.2% $23.47 0 140,000
CBD A 13,512,018 -22,800 -22,800 -0.2% 14.8% 18.1% $30.27 0 0
Fringe A 3,003,967 -15,194 -15,194 -0.5% 12.0% 17.3% $36.95 0 590,867
Oakland / East End A 1,457,896 -41,447 -41,447 -2.8% 14.8% 16.4% $42.58 0 895,820
Urban A 17,973,881 -79,441 -79,441 -0.4% 14.3% 17.8% $33.89 0 1,486,687
Pittsburgh A 30,790,054 -352,019 -352,019 -1.1% 15.7% 20.5% $29.59 0 1,626,687
Northern I-79 / Cranberry B 685,158 161 161 0.0% 21.8% 21.8% $23.16 0 0
East B 1,473,030 -5,112 -5,112 -0.3% 20.5% 21.1% $17.82 0 0
North B 2,922,036 -79,588 -79,588 -2.7% 15.0% 15.7% $18.84 0 0
South B 2,231,420 12,408 12,408 0.6% 13.4% 13.4% $20.34 0 0
Southpointe B 1,082,353 -6,795 -6,795 -0.6% 27.9% 29.0% $20.73 0 0
West B 3,285,257 -77,170 -77,170 -2.3% 25.9% 27.6% $20.49 0 0
Suburban B 11,679,254 -156,096 -156,096 -1.3% 20.0% 20.9% $20.04 0 0
CBD B 5,460,589 -78,463 -78,463 -1.4% 20.9% 23.2% $22.18 0 0
Fringe B 5,797,443 -23,564 -23,564 -0.4% 19.6% 21.5% $24.40 0 58,500
Oakland / East End B 1,241,513 7,235 7,235 0.6% 5.0% 5.6% $24.13 0 0
Urban B 12,499,545 -94,792 -94,792 -0.8% 18.7% 20.7% $23.29 0 58,500
Pittsburgh B 24,178,799 -250,888 -250,888 -1.0% 19.4% 20.8% $21.71 0 58,500
© 2021 Jones Lang LaSalle IP, Inc. All rights reserved. All information contained herein is from sources deemed reliable; however, no representation or warranty is made to the accuracy thereof.

More Related Content

What's hot

JLL Grand Rapids Office Insight & Statistics - Q2 2019
JLL Grand Rapids Office Insight & Statistics - Q2 2019JLL Grand Rapids Office Insight & Statistics - Q2 2019
JLL Grand Rapids Office Insight & Statistics - Q2 2019Harrison West
 
JLL Cincinnati Office Insight & Statistics - Q2 2016
JLL Cincinnati Office Insight & Statistics - Q2 2016JLL Cincinnati Office Insight & Statistics - Q2 2016
JLL Cincinnati Office Insight & Statistics - Q2 2016Ross Bratcher
 
JLL Pittsburgh Office Insight & Statistics - Q3 2019
 JLL Pittsburgh Office Insight & Statistics - Q3 2019 JLL Pittsburgh Office Insight & Statistics - Q3 2019
JLL Pittsburgh Office Insight & Statistics - Q3 2019Tobiah Bilski
 
JLL Pittsburgh Office Insight & Statistics - Q4 2017
JLL Pittsburgh Office Insight & Statistics - Q4 2017JLL Pittsburgh Office Insight & Statistics - Q4 2017
JLL Pittsburgh Office Insight & Statistics - Q4 2017Tobiah Bilski
 
JLL Detroit Office Insight & Statistics - Q4 2017
JLL Detroit Office Insight & Statistics - Q4 2017JLL Detroit Office Insight & Statistics - Q4 2017
JLL Detroit Office Insight & Statistics - Q4 2017Harrison West
 
JLL Houston Office Market Report - Q4 2018
JLL Houston Office Market Report - Q4 2018JLL Houston Office Market Report - Q4 2018
JLL Houston Office Market Report - Q4 2018DavidDominy1
 
JLL Detroit Office Insight & Statistics - Q3 2018
JLL Detroit Office Insight & Statistics - Q3 2018JLL Detroit Office Insight & Statistics - Q3 2018
JLL Detroit Office Insight & Statistics - Q3 2018Harrison West
 
JLL Pittsburgh Office Insight & Statistics - Q4 2019
JLL Pittsburgh Office Insight & Statistics - Q4 2019JLL Pittsburgh Office Insight & Statistics - Q4 2019
JLL Pittsburgh Office Insight & Statistics - Q4 2019Tobiah Bilski
 
JLL Pittsburgh Office Insight & Statistics - Q2 2018
JLL Pittsburgh Office Insight & Statistics - Q2 2018 JLL Pittsburgh Office Insight & Statistics - Q2 2018
JLL Pittsburgh Office Insight & Statistics - Q2 2018 Tobiah Bilski
 
JLL Pittsburgh Office Insight & Statistics - Q4 2018
JLL Pittsburgh Office Insight & Statistics - Q4 2018JLL Pittsburgh Office Insight & Statistics - Q4 2018
JLL Pittsburgh Office Insight & Statistics - Q4 2018Tobiah Bilski
 
JLL Cincinnati Office Insight & Statistics - Q3 2016
JLL Cincinnati Office Insight & Statistics - Q3 2016JLL Cincinnati Office Insight & Statistics - Q3 2016
JLL Cincinnati Office Insight & Statistics - Q3 2016Ross Bratcher
 
JLL Pittsburgh Office Insight & Statistics - Q1 2018
JLL Pittsburgh Office Insight & Statistics - Q1 2018JLL Pittsburgh Office Insight & Statistics - Q1 2018
JLL Pittsburgh Office Insight & Statistics - Q1 2018Tobiah Bilski
 
JLL Detroit Office Insight & Statistics - Q4 2019
JLL Detroit Office Insight & Statistics - Q4 2019JLL Detroit Office Insight & Statistics - Q4 2019
JLL Detroit Office Insight & Statistics - Q4 2019Harrison West
 
JLL Detroit Office Insight & Statistics - Q2 2019
JLL Detroit Office Insight & Statistics - Q2 2019JLL Detroit Office Insight & Statistics - Q2 2019
JLL Detroit Office Insight & Statistics - Q2 2019Harrison West
 
JLL Detroit Office Insight & Statistics - Q1 2019
JLL Detroit Office Insight & Statistics - Q1 2019JLL Detroit Office Insight & Statistics - Q1 2019
JLL Detroit Office Insight & Statistics - Q1 2019Harrison West
 
JLL Pittsburgh Industrial Insight & Statistics - Q4 2018
JLL Pittsburgh Industrial Insight & Statistics - Q4 2018JLL Pittsburgh Industrial Insight & Statistics - Q4 2018
JLL Pittsburgh Industrial Insight & Statistics - Q4 2018Tobiah Bilski
 
JLL Detroit Office Insight & Statistics - Q1 2018
JLL Detroit Office Insight & Statistics - Q1 2018JLL Detroit Office Insight & Statistics - Q1 2018
JLL Detroit Office Insight & Statistics - Q1 2018Harrison West
 

What's hot (20)

JLL Grand Rapids Office Insight & Statistics - Q2 2019
JLL Grand Rapids Office Insight & Statistics - Q2 2019JLL Grand Rapids Office Insight & Statistics - Q2 2019
JLL Grand Rapids Office Insight & Statistics - Q2 2019
 
JLL Cincinnati Office Insight & Statistics - Q2 2016
JLL Cincinnati Office Insight & Statistics - Q2 2016JLL Cincinnati Office Insight & Statistics - Q2 2016
JLL Cincinnati Office Insight & Statistics - Q2 2016
 
JLL Pittsburgh Office Insight & Statistics - Q3 2019
 JLL Pittsburgh Office Insight & Statistics - Q3 2019 JLL Pittsburgh Office Insight & Statistics - Q3 2019
JLL Pittsburgh Office Insight & Statistics - Q3 2019
 
JLL Pittsburgh Office Insight & Statistics - Q4 2017
JLL Pittsburgh Office Insight & Statistics - Q4 2017JLL Pittsburgh Office Insight & Statistics - Q4 2017
JLL Pittsburgh Office Insight & Statistics - Q4 2017
 
JLL Detroit Office Insight & Statistics - Q4 2017
JLL Detroit Office Insight & Statistics - Q4 2017JLL Detroit Office Insight & Statistics - Q4 2017
JLL Detroit Office Insight & Statistics - Q4 2017
 
JLL Houston Office Market Report - Q4 2018
JLL Houston Office Market Report - Q4 2018JLL Houston Office Market Report - Q4 2018
JLL Houston Office Market Report - Q4 2018
 
JLL Houston Office Report Q4
JLL Houston Office Report Q4JLL Houston Office Report Q4
JLL Houston Office Report Q4
 
JLL Detroit Office Insight & Statistics - Q3 2018
JLL Detroit Office Insight & Statistics - Q3 2018JLL Detroit Office Insight & Statistics - Q3 2018
JLL Detroit Office Insight & Statistics - Q3 2018
 
JLL Pittsburgh Office Insight & Statistics - Q4 2019
JLL Pittsburgh Office Insight & Statistics - Q4 2019JLL Pittsburgh Office Insight & Statistics - Q4 2019
JLL Pittsburgh Office Insight & Statistics - Q4 2019
 
JLL Pittsburgh Office Insight & Statistics - Q2 2018
JLL Pittsburgh Office Insight & Statistics - Q2 2018 JLL Pittsburgh Office Insight & Statistics - Q2 2018
JLL Pittsburgh Office Insight & Statistics - Q2 2018
 
JLL Pittsburgh Office Insight & Statistics - Q4 2018
JLL Pittsburgh Office Insight & Statistics - Q4 2018JLL Pittsburgh Office Insight & Statistics - Q4 2018
JLL Pittsburgh Office Insight & Statistics - Q4 2018
 
JLL Cincinnati Office Insight & Statistics - Q3 2016
JLL Cincinnati Office Insight & Statistics - Q3 2016JLL Cincinnati Office Insight & Statistics - Q3 2016
JLL Cincinnati Office Insight & Statistics - Q3 2016
 
JLL Pittsburgh Office Insight & Statistics - Q1 2018
JLL Pittsburgh Office Insight & Statistics - Q1 2018JLL Pittsburgh Office Insight & Statistics - Q1 2018
JLL Pittsburgh Office Insight & Statistics - Q1 2018
 
SVNR Office Market Report Q116
SVNR Office Market Report Q116SVNR Office Market Report Q116
SVNR Office Market Report Q116
 
JLL Detroit Office Insight & Statistics - Q4 2019
JLL Detroit Office Insight & Statistics - Q4 2019JLL Detroit Office Insight & Statistics - Q4 2019
JLL Detroit Office Insight & Statistics - Q4 2019
 
JLL Detroit Office Insight & Statistics - Q2 2019
JLL Detroit Office Insight & Statistics - Q2 2019JLL Detroit Office Insight & Statistics - Q2 2019
JLL Detroit Office Insight & Statistics - Q2 2019
 
JLL Detroit Office Insight & Statistics - Q1 2019
JLL Detroit Office Insight & Statistics - Q1 2019JLL Detroit Office Insight & Statistics - Q1 2019
JLL Detroit Office Insight & Statistics - Q1 2019
 
JLL Houston 2018 Q1 Office Market Report
JLL Houston 2018 Q1 Office Market ReportJLL Houston 2018 Q1 Office Market Report
JLL Houston 2018 Q1 Office Market Report
 
JLL Pittsburgh Industrial Insight & Statistics - Q4 2018
JLL Pittsburgh Industrial Insight & Statistics - Q4 2018JLL Pittsburgh Industrial Insight & Statistics - Q4 2018
JLL Pittsburgh Industrial Insight & Statistics - Q4 2018
 
JLL Detroit Office Insight & Statistics - Q1 2018
JLL Detroit Office Insight & Statistics - Q1 2018JLL Detroit Office Insight & Statistics - Q1 2018
JLL Detroit Office Insight & Statistics - Q1 2018
 

Similar to JLL Pittsburgh Office Insight & Statistics - Q1 2021

JLL Pittsburgh Office Insight & Statistics - Q1 2020
JLL Pittsburgh Office Insight & Statistics - Q1 2020JLL Pittsburgh Office Insight & Statistics - Q1 2020
JLL Pittsburgh Office Insight & Statistics - Q1 2020Tobiah Bilski
 
JLL Pittsburgh Office Insight & Statistics - Q1 2019
JLL Pittsburgh Office Insight & Statistics - Q1 2019JLL Pittsburgh Office Insight & Statistics - Q1 2019
JLL Pittsburgh Office Insight & Statistics - Q1 2019Tobiah Bilski
 
JLL Cleveland Office Outlook: Q4 2020
JLL Cleveland Office Outlook: Q4 2020JLL Cleveland Office Outlook: Q4 2020
JLL Cleveland Office Outlook: Q4 2020Andrew Batson
 
Pittsburgh Office Insight & Stats Q1 2022
Pittsburgh Office Insight & Stats Q1 2022Pittsburgh Office Insight & Stats Q1 2022
Pittsburgh Office Insight & Stats Q1 2022Tobiah Bilski
 
JLL Detroit Office Insight & Statistics – Q2 2016
JLL Detroit Office Insight & Statistics – Q2 2016JLL Detroit Office Insight & Statistics – Q2 2016
JLL Detroit Office Insight & Statistics – Q2 2016Aaron Moore
 
JLL Pittsburgh Industrial Insight & Statistics - Q3 2018
JLL Pittsburgh Industrial Insight & Statistics - Q3 2018JLL Pittsburgh Industrial Insight & Statistics - Q3 2018
JLL Pittsburgh Industrial Insight & Statistics - Q3 2018Tobiah Bilski
 
Pittsburgh Office Insight & Stats Q4 2021
Pittsburgh Office Insight & Stats Q4 2021Pittsburgh Office Insight & Stats Q4 2021
Pittsburgh Office Insight & Stats Q4 2021Tobiah Bilski
 
JLL Columbus Office Outlook - Q4 2020
JLL Columbus Office Outlook - Q4 2020JLL Columbus Office Outlook - Q4 2020
JLL Columbus Office Outlook - Q4 2020Emma Gresky
 
Q1 2017 - Chicago Suburbs Office Reports
Q1 2017 - Chicago Suburbs Office ReportsQ1 2017 - Chicago Suburbs Office Reports
Q1 2017 - Chicago Suburbs Office ReportsHailey Harrington
 
JLL Pittsburgh Office Insight & Statistics - Q3 2018
JLL Pittsburgh Office Insight & Statistics - Q3 2018JLL Pittsburgh Office Insight & Statistics - Q3 2018
JLL Pittsburgh Office Insight & Statistics - Q3 2018Tobiah Bilski
 
JLL Pittsburgh Industrial Insight & Statistics - Q2 2018
JLL Pittsburgh Industrial Insight & Statistics - Q2 2018JLL Pittsburgh Industrial Insight & Statistics - Q2 2018
JLL Pittsburgh Industrial Insight & Statistics - Q2 2018Tobiah Bilski
 
JLL Pittsburgh Industrial Insight & Statistics - Q1 2018
JLL Pittsburgh Industrial Insight & Statistics - Q1 2018JLL Pittsburgh Industrial Insight & Statistics - Q1 2018
JLL Pittsburgh Industrial Insight & Statistics - Q1 2018Tobiah Bilski
 
JLL Cincinnati Office Outlook Q4 2020
JLL Cincinnati Office Outlook Q4 2020JLL Cincinnati Office Outlook Q4 2020
JLL Cincinnati Office Outlook Q4 2020Abby Armbruster
 
JLL Louisville Office Outlook - Q4 2018
JLL Louisville Office Outlook - Q4 2018JLL Louisville Office Outlook - Q4 2018
JLL Louisville Office Outlook - Q4 2018Alex Westcott
 
Jll cincinnati office outlook q2 2017
Jll cincinnati office outlook   q2 2017Jll cincinnati office outlook   q2 2017
Jll cincinnati office outlook q2 2017Abby Armbruster
 
Q2 2023 Pittsburgh Office Insight & Stats
Q2 2023 Pittsburgh Office Insight & StatsQ2 2023 Pittsburgh Office Insight & Stats
Q2 2023 Pittsburgh Office Insight & StatsCaitlin Fadgen
 
JLL Columbus Office Outlook: Q2 2016
JLL Columbus Office Outlook: Q2 2016JLL Columbus Office Outlook: Q2 2016
JLL Columbus Office Outlook: Q2 2016Peter McStravick
 
JLL Pittsburgh Office Insight & Statistics - Q3 2017
JLL Pittsburgh Office Insight & Statistics - Q3 2017JLL Pittsburgh Office Insight & Statistics - Q3 2017
JLL Pittsburgh Office Insight & Statistics - Q3 2017Tobiah Bilski
 
JLL Pittsburgh Industrial Insight & Statistics - Q2 2020
JLL Pittsburgh Industrial Insight & Statistics - Q2 2020JLL Pittsburgh Industrial Insight & Statistics - Q2 2020
JLL Pittsburgh Industrial Insight & Statistics - Q2 2020Tobiah Bilski
 
JLL Pittsburgh Industrial Insight & Statistics - Q4 2021
JLL Pittsburgh Industrial Insight & Statistics - Q4 2021JLL Pittsburgh Industrial Insight & Statistics - Q4 2021
JLL Pittsburgh Industrial Insight & Statistics - Q4 2021Tobiah Bilski
 

Similar to JLL Pittsburgh Office Insight & Statistics - Q1 2021 (20)

JLL Pittsburgh Office Insight & Statistics - Q1 2020
JLL Pittsburgh Office Insight & Statistics - Q1 2020JLL Pittsburgh Office Insight & Statistics - Q1 2020
JLL Pittsburgh Office Insight & Statistics - Q1 2020
 
JLL Pittsburgh Office Insight & Statistics - Q1 2019
JLL Pittsburgh Office Insight & Statistics - Q1 2019JLL Pittsburgh Office Insight & Statistics - Q1 2019
JLL Pittsburgh Office Insight & Statistics - Q1 2019
 
JLL Cleveland Office Outlook: Q4 2020
JLL Cleveland Office Outlook: Q4 2020JLL Cleveland Office Outlook: Q4 2020
JLL Cleveland Office Outlook: Q4 2020
 
Pittsburgh Office Insight & Stats Q1 2022
Pittsburgh Office Insight & Stats Q1 2022Pittsburgh Office Insight & Stats Q1 2022
Pittsburgh Office Insight & Stats Q1 2022
 
JLL Detroit Office Insight & Statistics – Q2 2016
JLL Detroit Office Insight & Statistics – Q2 2016JLL Detroit Office Insight & Statistics – Q2 2016
JLL Detroit Office Insight & Statistics – Q2 2016
 
JLL Pittsburgh Industrial Insight & Statistics - Q3 2018
JLL Pittsburgh Industrial Insight & Statistics - Q3 2018JLL Pittsburgh Industrial Insight & Statistics - Q3 2018
JLL Pittsburgh Industrial Insight & Statistics - Q3 2018
 
Pittsburgh Office Insight & Stats Q4 2021
Pittsburgh Office Insight & Stats Q4 2021Pittsburgh Office Insight & Stats Q4 2021
Pittsburgh Office Insight & Stats Q4 2021
 
JLL Columbus Office Outlook - Q4 2020
JLL Columbus Office Outlook - Q4 2020JLL Columbus Office Outlook - Q4 2020
JLL Columbus Office Outlook - Q4 2020
 
Q1 2017 - Chicago Suburbs Office Reports
Q1 2017 - Chicago Suburbs Office ReportsQ1 2017 - Chicago Suburbs Office Reports
Q1 2017 - Chicago Suburbs Office Reports
 
JLL Pittsburgh Office Insight & Statistics - Q3 2018
JLL Pittsburgh Office Insight & Statistics - Q3 2018JLL Pittsburgh Office Insight & Statistics - Q3 2018
JLL Pittsburgh Office Insight & Statistics - Q3 2018
 
JLL Pittsburgh Industrial Insight & Statistics - Q2 2018
JLL Pittsburgh Industrial Insight & Statistics - Q2 2018JLL Pittsburgh Industrial Insight & Statistics - Q2 2018
JLL Pittsburgh Industrial Insight & Statistics - Q2 2018
 
JLL Pittsburgh Industrial Insight & Statistics - Q1 2018
JLL Pittsburgh Industrial Insight & Statistics - Q1 2018JLL Pittsburgh Industrial Insight & Statistics - Q1 2018
JLL Pittsburgh Industrial Insight & Statistics - Q1 2018
 
JLL Cincinnati Office Outlook Q4 2020
JLL Cincinnati Office Outlook Q4 2020JLL Cincinnati Office Outlook Q4 2020
JLL Cincinnati Office Outlook Q4 2020
 
JLL Louisville Office Outlook - Q4 2018
JLL Louisville Office Outlook - Q4 2018JLL Louisville Office Outlook - Q4 2018
JLL Louisville Office Outlook - Q4 2018
 
Jll cincinnati office outlook q2 2017
Jll cincinnati office outlook   q2 2017Jll cincinnati office outlook   q2 2017
Jll cincinnati office outlook q2 2017
 
Q2 2023 Pittsburgh Office Insight & Stats
Q2 2023 Pittsburgh Office Insight & StatsQ2 2023 Pittsburgh Office Insight & Stats
Q2 2023 Pittsburgh Office Insight & Stats
 
JLL Columbus Office Outlook: Q2 2016
JLL Columbus Office Outlook: Q2 2016JLL Columbus Office Outlook: Q2 2016
JLL Columbus Office Outlook: Q2 2016
 
JLL Pittsburgh Office Insight & Statistics - Q3 2017
JLL Pittsburgh Office Insight & Statistics - Q3 2017JLL Pittsburgh Office Insight & Statistics - Q3 2017
JLL Pittsburgh Office Insight & Statistics - Q3 2017
 
JLL Pittsburgh Industrial Insight & Statistics - Q2 2020
JLL Pittsburgh Industrial Insight & Statistics - Q2 2020JLL Pittsburgh Industrial Insight & Statistics - Q2 2020
JLL Pittsburgh Industrial Insight & Statistics - Q2 2020
 
JLL Pittsburgh Industrial Insight & Statistics - Q4 2021
JLL Pittsburgh Industrial Insight & Statistics - Q4 2021JLL Pittsburgh Industrial Insight & Statistics - Q4 2021
JLL Pittsburgh Industrial Insight & Statistics - Q4 2021
 

More from Tobiah Bilski

JLL Pittsburgh Industrial Insight & Statistics - Q3 2021
JLL Pittsburgh Industrial Insight & Statistics - Q3 2021JLL Pittsburgh Industrial Insight & Statistics - Q3 2021
JLL Pittsburgh Industrial Insight & Statistics - Q3 2021Tobiah Bilski
 
JLL Pittsburgh Industrial Insight & Statistics - Q2 2021
JLL Pittsburgh Industrial Insight & Statistics - Q2 2021JLL Pittsburgh Industrial Insight & Statistics - Q2 2021
JLL Pittsburgh Industrial Insight & Statistics - Q2 2021Tobiah Bilski
 
JLL Pittsburgh Industrial Insight & Statistics - Q1 2021
JLL Pittsburgh Industrial Insight & Statistics - Q1 2021JLL Pittsburgh Industrial Insight & Statistics - Q1 2021
JLL Pittsburgh Industrial Insight & Statistics - Q1 2021Tobiah Bilski
 
JLL Pittsburgh Industrial Insight & Statistics - Q4 2020
JLL Pittsburgh Industrial Insight & Statistics - Q4 2020JLL Pittsburgh Industrial Insight & Statistics - Q4 2020
JLL Pittsburgh Industrial Insight & Statistics - Q4 2020Tobiah Bilski
 
JLL Pittsburgh Industrial Insight & Statistics - Q3 2020
JLL Pittsburgh Industrial Insight & Statistics - Q3 2020JLL Pittsburgh Industrial Insight & Statistics - Q3 2020
JLL Pittsburgh Industrial Insight & Statistics - Q3 2020Tobiah Bilski
 
JLL Pittsburgh Industrial Insight & Statistics - Q1 2020
JLL Pittsburgh Industrial Insight & Statistics - Q1 2020JLL Pittsburgh Industrial Insight & Statistics - Q1 2020
JLL Pittsburgh Industrial Insight & Statistics - Q1 2020Tobiah Bilski
 
JLL Pittsburgh Industrial Insight & Statistics - Q4 2019
JLL Pittsburgh Industrial Insight & Statistics - Q4 2019JLL Pittsburgh Industrial Insight & Statistics - Q4 2019
JLL Pittsburgh Industrial Insight & Statistics - Q4 2019Tobiah Bilski
 
JLL Pittsburgh Industrial Insight & Statistics - Q3 2019
JLL Pittsburgh Industrial Insight & Statistics - Q3 2019JLL Pittsburgh Industrial Insight & Statistics - Q3 2019
JLL Pittsburgh Industrial Insight & Statistics - Q3 2019Tobiah Bilski
 
JLL Pittsburgh Industrial Insight & Statistics - Q2 2019
JLL Pittsburgh Industrial Insight & Statistics - Q2 2019JLL Pittsburgh Industrial Insight & Statistics - Q2 2019
JLL Pittsburgh Industrial Insight & Statistics - Q2 2019Tobiah Bilski
 
JLL Pittsburgh Industrial Insight & Statistics - Q1 2019
JLL Pittsburgh Industrial Insight & Statistics - Q1 2019JLL Pittsburgh Industrial Insight & Statistics - Q1 2019
JLL Pittsburgh Industrial Insight & Statistics - Q1 2019Tobiah Bilski
 

More from Tobiah Bilski (10)

JLL Pittsburgh Industrial Insight & Statistics - Q3 2021
JLL Pittsburgh Industrial Insight & Statistics - Q3 2021JLL Pittsburgh Industrial Insight & Statistics - Q3 2021
JLL Pittsburgh Industrial Insight & Statistics - Q3 2021
 
JLL Pittsburgh Industrial Insight & Statistics - Q2 2021
JLL Pittsburgh Industrial Insight & Statistics - Q2 2021JLL Pittsburgh Industrial Insight & Statistics - Q2 2021
JLL Pittsburgh Industrial Insight & Statistics - Q2 2021
 
JLL Pittsburgh Industrial Insight & Statistics - Q1 2021
JLL Pittsburgh Industrial Insight & Statistics - Q1 2021JLL Pittsburgh Industrial Insight & Statistics - Q1 2021
JLL Pittsburgh Industrial Insight & Statistics - Q1 2021
 
JLL Pittsburgh Industrial Insight & Statistics - Q4 2020
JLL Pittsburgh Industrial Insight & Statistics - Q4 2020JLL Pittsburgh Industrial Insight & Statistics - Q4 2020
JLL Pittsburgh Industrial Insight & Statistics - Q4 2020
 
JLL Pittsburgh Industrial Insight & Statistics - Q3 2020
JLL Pittsburgh Industrial Insight & Statistics - Q3 2020JLL Pittsburgh Industrial Insight & Statistics - Q3 2020
JLL Pittsburgh Industrial Insight & Statistics - Q3 2020
 
JLL Pittsburgh Industrial Insight & Statistics - Q1 2020
JLL Pittsburgh Industrial Insight & Statistics - Q1 2020JLL Pittsburgh Industrial Insight & Statistics - Q1 2020
JLL Pittsburgh Industrial Insight & Statistics - Q1 2020
 
JLL Pittsburgh Industrial Insight & Statistics - Q4 2019
JLL Pittsburgh Industrial Insight & Statistics - Q4 2019JLL Pittsburgh Industrial Insight & Statistics - Q4 2019
JLL Pittsburgh Industrial Insight & Statistics - Q4 2019
 
JLL Pittsburgh Industrial Insight & Statistics - Q3 2019
JLL Pittsburgh Industrial Insight & Statistics - Q3 2019JLL Pittsburgh Industrial Insight & Statistics - Q3 2019
JLL Pittsburgh Industrial Insight & Statistics - Q3 2019
 
JLL Pittsburgh Industrial Insight & Statistics - Q2 2019
JLL Pittsburgh Industrial Insight & Statistics - Q2 2019JLL Pittsburgh Industrial Insight & Statistics - Q2 2019
JLL Pittsburgh Industrial Insight & Statistics - Q2 2019
 
JLL Pittsburgh Industrial Insight & Statistics - Q1 2019
JLL Pittsburgh Industrial Insight & Statistics - Q1 2019JLL Pittsburgh Industrial Insight & Statistics - Q1 2019
JLL Pittsburgh Industrial Insight & Statistics - Q1 2019
 

Recently uploaded

How to Build Multifamily and Laneway Suites in Toronto!! (feat. Expert Archi...
How to Build Multifamily and Laneway Suites  in Toronto!! (feat. Expert Archi...How to Build Multifamily and Laneway Suites  in Toronto!! (feat. Expert Archi...
How to Build Multifamily and Laneway Suites in Toronto!! (feat. Expert Archi...Volition Properties
 
9990771857 Call Girls in Noida Sector 03 Noida (Call Girls) Delhi
9990771857 Call Girls in Noida Sector 03 Noida (Call Girls) Delhi9990771857 Call Girls in Noida Sector 03 Noida (Call Girls) Delhi
9990771857 Call Girls in Noida Sector 03 Noida (Call Girls) Delhidelhimodel235
 
Call Girls In Vasundhara Ghaziabad ❤️8860477959 Low Rate Escorts Service In 2...
Call Girls In Vasundhara Ghaziabad ❤️8860477959 Low Rate Escorts Service In 2...Call Girls In Vasundhara Ghaziabad ❤️8860477959 Low Rate Escorts Service In 2...
Call Girls In Vasundhara Ghaziabad ❤️8860477959 Low Rate Escorts Service In 2...lizamodels9
 
Model Call Girl in Shastri Nagar Delhi reach out to us at 🔝8264348440🔝
Model Call Girl in Shastri Nagar Delhi reach out to us at 🔝8264348440🔝Model Call Girl in Shastri Nagar Delhi reach out to us at 🔝8264348440🔝
Model Call Girl in Shastri Nagar Delhi reach out to us at 🔝8264348440🔝soniya singh
 
Call girls in Jeewan Park .Delhi↫8447779280↬ ꧂Escorts Service In Delhi Ncr
Call girls in Jeewan Park .Delhi↫8447779280↬ ꧂Escorts Service In Delhi NcrCall girls in Jeewan Park .Delhi↫8447779280↬ ꧂Escorts Service In Delhi Ncr
Call girls in Jeewan Park .Delhi↫8447779280↬ ꧂Escorts Service In Delhi Ncrasmaqueen5
 
Call Girls in Sarai Kale Khan Delhi 💯Call Us 🔝8264348440🔝
Call Girls in Sarai Kale Khan Delhi 💯Call Us 🔝8264348440🔝Call Girls in Sarai Kale Khan Delhi 💯Call Us 🔝8264348440🔝
Call Girls in Sarai Kale Khan Delhi 💯Call Us 🔝8264348440🔝soniya singh
 
Call Girls in Inderpuri Delhi 💯Call Us 🔝8264348440🔝
Call Girls in Inderpuri Delhi 💯Call Us 🔝8264348440🔝Call Girls in Inderpuri Delhi 💯Call Us 🔝8264348440🔝
Call Girls in Inderpuri Delhi 💯Call Us 🔝8264348440🔝soniya singh
 
9990771857 Call Girls in Noida Sector 06 Noida (Call Girls) Delhi
9990771857 Call Girls in Noida Sector 06 Noida (Call Girls) Delhi9990771857 Call Girls in Noida Sector 06 Noida (Call Girls) Delhi
9990771857 Call Girls in Noida Sector 06 Noida (Call Girls) Delhidelhimodel235
 
Low Rate Call Girls in Akshardham Delhi Call 9990771857
Low Rate Call Girls in Akshardham   Delhi Call 9990771857Low Rate Call Girls in Akshardham   Delhi Call 9990771857
Low Rate Call Girls in Akshardham Delhi Call 9990771857delhimodel235
 
Rustomjee The Panorama At Pali Hill, Bandra West, Mumbai - Brochure.pdf
Rustomjee The Panorama At Pali Hill, Bandra West, Mumbai - Brochure.pdfRustomjee The Panorama At Pali Hill, Bandra West, Mumbai - Brochure.pdf
Rustomjee The Panorama At Pali Hill, Bandra West, Mumbai - Brochure.pdfmonikasharma630
 
Call Girls in shastri nagar Delhi 8264348440 ✅ call girls ❤️
Call Girls in shastri nagar Delhi 8264348440 ✅ call girls ❤️Call Girls in shastri nagar Delhi 8264348440 ✅ call girls ❤️
Call Girls in shastri nagar Delhi 8264348440 ✅ call girls ❤️soniya singh
 
Eco-Efficient Living: Redefining Sustainability through Leech's Green Design ...
Eco-Efficient Living: Redefining Sustainability through Leech's Green Design ...Eco-Efficient Living: Redefining Sustainability through Leech's Green Design ...
Eco-Efficient Living: Redefining Sustainability through Leech's Green Design ...Newman George Leech
 
Call Girls In Sahibabad Ghaziabad ❤️8860477959 Low Rate Escorts Service In 24...
Call Girls In Sahibabad Ghaziabad ❤️8860477959 Low Rate Escorts Service In 24...Call Girls In Sahibabad Ghaziabad ❤️8860477959 Low Rate Escorts Service In 24...
Call Girls In Sahibabad Ghaziabad ❤️8860477959 Low Rate Escorts Service In 24...lizamodels9
 
Call Girls in Kashmiri Gate Delhi 💯Call Us 🔝8264348440🔝
Call Girls in Kashmiri Gate Delhi 💯Call Us 🔝8264348440🔝Call Girls in Kashmiri Gate Delhi 💯Call Us 🔝8264348440🔝
Call Girls in Kashmiri Gate Delhi 💯Call Us 🔝8264348440🔝soniya singh
 
Call Girls in Nehru Place Delhi 💯Call Us 🔝8264348440🔝
Call Girls in Nehru Place Delhi 💯Call Us 🔝8264348440🔝Call Girls in Nehru Place Delhi 💯Call Us 🔝8264348440🔝
Call Girls in Nehru Place Delhi 💯Call Us 🔝8264348440🔝soniya singh
 
Cashpay_Call Girls In Gaur City Mall Noida ❤️8860477959 Escorts Service In 24...
Cashpay_Call Girls In Gaur City Mall Noida ❤️8860477959 Escorts Service In 24...Cashpay_Call Girls In Gaur City Mall Noida ❤️8860477959 Escorts Service In 24...
Cashpay_Call Girls In Gaur City Mall Noida ❤️8860477959 Escorts Service In 24...lizamodels9
 
9990771857 Call Girls in Noida Sector 1 Noida (Call Girls) Delhi
9990771857 Call Girls in Noida Sector 1 Noida (Call Girls) Delhi9990771857 Call Girls in Noida Sector 1 Noida (Call Girls) Delhi
9990771857 Call Girls in Noida Sector 1 Noida (Call Girls) Delhidelhimodel235
 
8 Key Elements for Comfortable Farmland Living
8 Key Elements for Comfortable Farmland Living 8 Key Elements for Comfortable Farmland Living
8 Key Elements for Comfortable Farmland Living Farmland Bazaar
 
Call Girls in Pitampura Delhi 💯Call Us 🔝8264348440🔝
Call Girls in Pitampura Delhi 💯Call Us 🔝8264348440🔝Call Girls in Pitampura Delhi 💯Call Us 🔝8264348440🔝
Call Girls in Pitampura Delhi 💯Call Us 🔝8264348440🔝soniya singh
 
Call Girls in laxmi Nagar Delhi 💯Call Us 🔝 9582086666🔝 South Delhi Escorts Se...
Call Girls in laxmi Nagar Delhi 💯Call Us 🔝 9582086666🔝 South Delhi Escorts Se...Call Girls in laxmi Nagar Delhi 💯Call Us 🔝 9582086666🔝 South Delhi Escorts Se...
Call Girls in laxmi Nagar Delhi 💯Call Us 🔝 9582086666🔝 South Delhi Escorts Se...delhimodel235
 

Recently uploaded (20)

How to Build Multifamily and Laneway Suites in Toronto!! (feat. Expert Archi...
How to Build Multifamily and Laneway Suites  in Toronto!! (feat. Expert Archi...How to Build Multifamily and Laneway Suites  in Toronto!! (feat. Expert Archi...
How to Build Multifamily and Laneway Suites in Toronto!! (feat. Expert Archi...
 
9990771857 Call Girls in Noida Sector 03 Noida (Call Girls) Delhi
9990771857 Call Girls in Noida Sector 03 Noida (Call Girls) Delhi9990771857 Call Girls in Noida Sector 03 Noida (Call Girls) Delhi
9990771857 Call Girls in Noida Sector 03 Noida (Call Girls) Delhi
 
Call Girls In Vasundhara Ghaziabad ❤️8860477959 Low Rate Escorts Service In 2...
Call Girls In Vasundhara Ghaziabad ❤️8860477959 Low Rate Escorts Service In 2...Call Girls In Vasundhara Ghaziabad ❤️8860477959 Low Rate Escorts Service In 2...
Call Girls In Vasundhara Ghaziabad ❤️8860477959 Low Rate Escorts Service In 2...
 
Model Call Girl in Shastri Nagar Delhi reach out to us at 🔝8264348440🔝
Model Call Girl in Shastri Nagar Delhi reach out to us at 🔝8264348440🔝Model Call Girl in Shastri Nagar Delhi reach out to us at 🔝8264348440🔝
Model Call Girl in Shastri Nagar Delhi reach out to us at 🔝8264348440🔝
 
Call girls in Jeewan Park .Delhi↫8447779280↬ ꧂Escorts Service In Delhi Ncr
Call girls in Jeewan Park .Delhi↫8447779280↬ ꧂Escorts Service In Delhi NcrCall girls in Jeewan Park .Delhi↫8447779280↬ ꧂Escorts Service In Delhi Ncr
Call girls in Jeewan Park .Delhi↫8447779280↬ ꧂Escorts Service In Delhi Ncr
 
Call Girls in Sarai Kale Khan Delhi 💯Call Us 🔝8264348440🔝
Call Girls in Sarai Kale Khan Delhi 💯Call Us 🔝8264348440🔝Call Girls in Sarai Kale Khan Delhi 💯Call Us 🔝8264348440🔝
Call Girls in Sarai Kale Khan Delhi 💯Call Us 🔝8264348440🔝
 
Call Girls in Inderpuri Delhi 💯Call Us 🔝8264348440🔝
Call Girls in Inderpuri Delhi 💯Call Us 🔝8264348440🔝Call Girls in Inderpuri Delhi 💯Call Us 🔝8264348440🔝
Call Girls in Inderpuri Delhi 💯Call Us 🔝8264348440🔝
 
9990771857 Call Girls in Noida Sector 06 Noida (Call Girls) Delhi
9990771857 Call Girls in Noida Sector 06 Noida (Call Girls) Delhi9990771857 Call Girls in Noida Sector 06 Noida (Call Girls) Delhi
9990771857 Call Girls in Noida Sector 06 Noida (Call Girls) Delhi
 
Low Rate Call Girls in Akshardham Delhi Call 9990771857
Low Rate Call Girls in Akshardham   Delhi Call 9990771857Low Rate Call Girls in Akshardham   Delhi Call 9990771857
Low Rate Call Girls in Akshardham Delhi Call 9990771857
 
Rustomjee The Panorama At Pali Hill, Bandra West, Mumbai - Brochure.pdf
Rustomjee The Panorama At Pali Hill, Bandra West, Mumbai - Brochure.pdfRustomjee The Panorama At Pali Hill, Bandra West, Mumbai - Brochure.pdf
Rustomjee The Panorama At Pali Hill, Bandra West, Mumbai - Brochure.pdf
 
Call Girls in shastri nagar Delhi 8264348440 ✅ call girls ❤️
Call Girls in shastri nagar Delhi 8264348440 ✅ call girls ❤️Call Girls in shastri nagar Delhi 8264348440 ✅ call girls ❤️
Call Girls in shastri nagar Delhi 8264348440 ✅ call girls ❤️
 
Eco-Efficient Living: Redefining Sustainability through Leech's Green Design ...
Eco-Efficient Living: Redefining Sustainability through Leech's Green Design ...Eco-Efficient Living: Redefining Sustainability through Leech's Green Design ...
Eco-Efficient Living: Redefining Sustainability through Leech's Green Design ...
 
Call Girls In Sahibabad Ghaziabad ❤️8860477959 Low Rate Escorts Service In 24...
Call Girls In Sahibabad Ghaziabad ❤️8860477959 Low Rate Escorts Service In 24...Call Girls In Sahibabad Ghaziabad ❤️8860477959 Low Rate Escorts Service In 24...
Call Girls In Sahibabad Ghaziabad ❤️8860477959 Low Rate Escorts Service In 24...
 
Call Girls in Kashmiri Gate Delhi 💯Call Us 🔝8264348440🔝
Call Girls in Kashmiri Gate Delhi 💯Call Us 🔝8264348440🔝Call Girls in Kashmiri Gate Delhi 💯Call Us 🔝8264348440🔝
Call Girls in Kashmiri Gate Delhi 💯Call Us 🔝8264348440🔝
 
Call Girls in Nehru Place Delhi 💯Call Us 🔝8264348440🔝
Call Girls in Nehru Place Delhi 💯Call Us 🔝8264348440🔝Call Girls in Nehru Place Delhi 💯Call Us 🔝8264348440🔝
Call Girls in Nehru Place Delhi 💯Call Us 🔝8264348440🔝
 
Cashpay_Call Girls In Gaur City Mall Noida ❤️8860477959 Escorts Service In 24...
Cashpay_Call Girls In Gaur City Mall Noida ❤️8860477959 Escorts Service In 24...Cashpay_Call Girls In Gaur City Mall Noida ❤️8860477959 Escorts Service In 24...
Cashpay_Call Girls In Gaur City Mall Noida ❤️8860477959 Escorts Service In 24...
 
9990771857 Call Girls in Noida Sector 1 Noida (Call Girls) Delhi
9990771857 Call Girls in Noida Sector 1 Noida (Call Girls) Delhi9990771857 Call Girls in Noida Sector 1 Noida (Call Girls) Delhi
9990771857 Call Girls in Noida Sector 1 Noida (Call Girls) Delhi
 
8 Key Elements for Comfortable Farmland Living
8 Key Elements for Comfortable Farmland Living 8 Key Elements for Comfortable Farmland Living
8 Key Elements for Comfortable Farmland Living
 
Call Girls in Pitampura Delhi 💯Call Us 🔝8264348440🔝
Call Girls in Pitampura Delhi 💯Call Us 🔝8264348440🔝Call Girls in Pitampura Delhi 💯Call Us 🔝8264348440🔝
Call Girls in Pitampura Delhi 💯Call Us 🔝8264348440🔝
 
Call Girls in laxmi Nagar Delhi 💯Call Us 🔝 9582086666🔝 South Delhi Escorts Se...
Call Girls in laxmi Nagar Delhi 💯Call Us 🔝 9582086666🔝 South Delhi Escorts Se...Call Girls in laxmi Nagar Delhi 💯Call Us 🔝 9582086666🔝 South Delhi Escorts Se...
Call Girls in laxmi Nagar Delhi 💯Call Us 🔝 9582086666🔝 South Delhi Escorts Se...
 

JLL Pittsburgh Office Insight & Statistics - Q1 2021

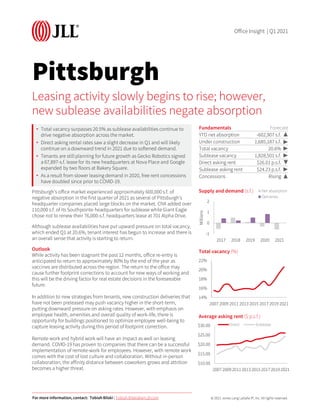
  • 1. © 2021 Jones Lang LaSalle IP, Inc. All rights reserved. Pittsburgh Pittsburgh’s office market experienced approximately 600,000 s.f. of negative absorption in the first quarter of 2021 as several of Pittsburgh’s headquarter companies placed large blocks on the market. CNX added over 110,000 s.f. of its Southpointe headquarters for sublease while Giant Eagle chose not to renew their 76,000-s.f. headquarters lease at 701 Alpha Drive. Although sublease availabilities have put upward pressure on total vacancy, which ended Q1 at 20.6%, tenant interest has begun to increase and there is an overall sense that activity is starting to return. Outlook While activity has been stagnant the past 12 months, office re-entry is anticipated to return to approximately 80% by the end of the year as vaccines are distributed across the region. The return to the office may cause further footprint corrections to account for new ways of working and this will be the driving factor for real estate decisions in the foreseeable future. In addition to new strategies from tenants, new construction deliveries that have not been preleased may push vacancy higher in the short-term, putting downward pressure on asking rates. However, with emphasis on employee health, amenities and overall quality of work-life, there is opportunity for buildings positioned to optimize employee well-being to capture leasing activity during this period of footprint correction. Remote work and hybrid work will have an impact as well on leasing demand. COVID-19 has proven to companies that there can be a successful implementation of remote-work for employees. However, with remote work comes with the cost of lost culture and collaboration. Without in-person collaboration, the affinity distance between coworkers grows and attrition becomes a higher threat. Leasing activity slowly begins to rise; however, new sublease availabilities negate absorption • Total vacancy surpasses 20.5% as sublease availabilities continue to drive negative absorption across the market. • Direct asking rental rates saw a slight decrease in Q1 and will likely continue on a downward trend in 2021 due to softened demand. • Tenants are still planning for future growth as Gecko Robotics signed a 67,897-s.f. lease for its new headquarters at Nova Place and Google expanded by two floors at Bakery Square. • As a result from slower leasing demand in 2020, free rent concessions have doubled since prior to COVID-19. Fundamentals Forecast YTD net absorption -602,907 s.f. Under construction 1,685,187 s.f. Total vacancy 20.6% Sublease vacancy 1,828,501 s.f. ▶ Direct asking rent $26.01 p.s.f. Sublease asking rent $24.23 p.s.f. ▶ Concessions Rising ▲ -1 0 1 2 2017 2018 2019 2020 2021 Millions Supply and demand (s.f.) Net absorption Deliveries 14% 16% 18% 20% 22% 2007 2009 2011 2013 2015 2017 2019 2021 Total vacancy (%) $10.00 $15.00 $20.00 $25.00 $30.00 20072009201120132015201720192021 Average asking rent ($ p.s.f.) Direct Sublease For more information, contact: Tobiah Bilski | Tobiah.Bilski@am.jll.com Office Insight | Q1 2021 ▲ ▶ ▶ ▶
  • 2. Pittsburgh | Q1 2021 JLL Research Report Office Statistics Class Inventory (s.f.) Total net absorption (s.f.) YTD total net absorption (s.f.) YTD total net absorption (% of stock) Direct vacancy (%) Total vacancy (%) Average direct asking rent ($ p.s.f.) YTD Completions (s.f.) Under Development (s.f.) Northern I-79 / Cranberry Totals 4,376,907 16,901 16,901 0.4% 15.5% 21.9% $25.01 0 0 East Totals 3,053,814 -21,187 -21,187 -0.7% 30.2% 30.7% $20.07 0 0 North Totals 3,777,851 -75,295 -75,295 -2.0% 14.5% 15.1% $20.63 0 0 South Totals 2,311,420 12,408 12,408 0.5% 14.1% 14.1% $20.31 0 140,000 Southpointe Totals 3,529,607 -150,596 -150,596 -4.3% 16.6% 27.7% $21.92 0 0 West Totals 7,445,828 -210,905 -210,905 -2.8% 20.5% 23.8% $22.00 0 0 Suburban Totals 24,495,427 -428,674 -428,674 -1.8% 18.7% 22.6% $21.78 0 140,000 CBD Totals 18,972,607 -101,263 -101,263 -0.5% 16.5% 19.6% $27.28 0 0 Fringe Totals 8,801,410 -38,758 -38,758 -0.4% 17.0% 20.1% $28.75 0 649,367 Oakland / East End Totals 2,699,409 -34,212 -34,212 -1.3% 10.3% 11.4% $41.31 0 895,820 Urban Totals 30,473,426 -174,233 -174,233 -0.6% 16.1% 19.0% $29.42 0 1,545,187 Pittsburgh Totals 54,968,853 -602,907 -602,907 -1.1% 17.3% 20.6% $26.01 0 1,685,187 Northern I-79 / Cranberry A 3,691,749 16,740 16,740 0.5% 14.3% 21.9% $25.48 0 0 East A 1,580,784 -16,075 -16,075 -1.0% 39.2% 39.6% $21.19 0 0 North A 855,815 4,293 4,293 0.5% 13.0% 13.2% $24.88 0 0 South A 80,000 0 0 0.0% 34.9% 34.9% $20.00 0 140,000 Southpointe A 2,447,254 -143,801 -143,801 -5.9% 11.6% 27.2% $23.25 0 0 West A 4,160,571 -133,735 -133,735 -3.2% 16.3% 20.8% $23.82 0 0 Suburban A 12,816,173 -272,578 -272,578 -2.1% 17.6% 24.2% $23.47 0 140,000 CBD A 13,512,018 -22,800 -22,800 -0.2% 14.8% 18.1% $30.27 0 0 Fringe A 3,003,967 -15,194 -15,194 -0.5% 12.0% 17.3% $36.95 0 590,867 Oakland / East End A 1,457,896 -41,447 -41,447 -2.8% 14.8% 16.4% $42.58 0 895,820 Urban A 17,973,881 -79,441 -79,441 -0.4% 14.3% 17.8% $33.89 0 1,486,687 Pittsburgh A 30,790,054 -352,019 -352,019 -1.1% 15.7% 20.5% $29.59 0 1,626,687 Northern I-79 / Cranberry B 685,158 161 161 0.0% 21.8% 21.8% $23.16 0 0 East B 1,473,030 -5,112 -5,112 -0.3% 20.5% 21.1% $17.82 0 0 North B 2,922,036 -79,588 -79,588 -2.7% 15.0% 15.7% $18.84 0 0 South B 2,231,420 12,408 12,408 0.6% 13.4% 13.4% $20.34 0 0 Southpointe B 1,082,353 -6,795 -6,795 -0.6% 27.9% 29.0% $20.73 0 0 West B 3,285,257 -77,170 -77,170 -2.3% 25.9% 27.6% $20.49 0 0 Suburban B 11,679,254 -156,096 -156,096 -1.3% 20.0% 20.9% $20.04 0 0 CBD B 5,460,589 -78,463 -78,463 -1.4% 20.9% 23.2% $22.18 0 0 Fringe B 5,797,443 -23,564 -23,564 -0.4% 19.6% 21.5% $24.40 0 58,500 Oakland / East End B 1,241,513 7,235 7,235 0.6% 5.0% 5.6% $24.13 0 0 Urban B 12,499,545 -94,792 -94,792 -0.8% 18.7% 20.7% $23.29 0 58,500 Pittsburgh B 24,178,799 -250,888 -250,888 -1.0% 19.4% 20.8% $21.71 0 58,500 © 2021 Jones Lang LaSalle IP, Inc. All rights reserved. All information contained herein is from sources deemed reliable; however, no representation or warranty is made to the accuracy thereof.