
Recommended
Recommended
More Related Content
What's hot
What's hot (20)
Similar to JLL Pittsburgh Industrial Insight & Statistics - Q3 2020
Similar to JLL Pittsburgh Industrial Insight & Statistics - Q3 2020 (20)
More from Tobiah Bilski
More from Tobiah Bilski (13)
Recently uploaded
Recently uploaded (20)
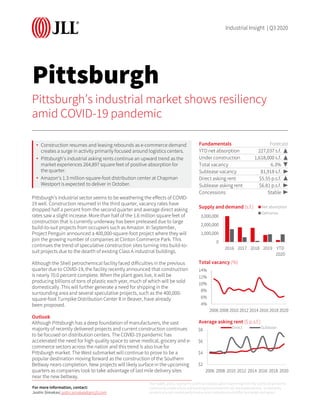
JLL Pittsburgh Industrial Insight & Statistics - Q3 2020
- 1. Pittsburgh Pittsburgh’s industrial sector seems to be weathering the effects of COVID- 19 well. Construction resumed in the third quarter, vacancy rates have dropped half a percent from the second quarter and average direct asking rates saw a slight increase. More than half of the 1.6 million square feet of construction that is currently underway has been preleased due to large build-to-suit projects from occupiers such as Amazon. In September, Project Penguin announced a 400,000-square-foot project where they will join the growing number of companies at Clinton Commerce Park. This continues the trend of speculative construction sites turning into build-to- suit projects due to the dearth of existing Class A industrial buildings. Although the Shell petrochemical facility faced difficulties in the previous quarter due to COVID-19, the facility recently announced that construction is nearly 70.0 percent complete. When the plant goes live, it will be producing billions of tons of plastic each year, much of which will be sold domestically. This will further generate a need for shipping in the surrounding area and several speculative projects, such as the 400,000- square-foot Turnpike Distribution Center II in Beaver, have already been proposed. Outlook Although Pittsburgh has a deep foundation of manufacturers, the vast majority of recently delivered projects and current construction continues to be focused on distribution centers. The COVID-19 pandemic has accelerated the need for high quality space to serve medical, grocery and e- commerce sectors across the nation and this trend is also true for Pittsburgh market. The West submarket will continue to prove to be a popular destination moving forward as the construction of the Southern Beltway nears completion. New projects will likely surface in the upcoming quarters as companies look to take advantage of last mile delivery sites near the new beltway. Pittsburgh’s industrial market shows resiliency amid COVID-19 pandemic • Construction resumes and leasing rebounds as e-commerce demand creates a surge in activity primarily focused around logistics centers. • Pittsburgh’s industrial asking rents continue an upward trend as the market experiences 264,897 square feet of positive absorption for the quarter. • Amazon’s 1.3 million-square-foot distribution center at Chapman Westport is expected to deliver in October. Fundamentals Forecast YTD net absorption 227,037 s.f. ▶ Under construction 1,618,000 s.f. ▼ Total vacancy 6.3% ▲ Sublease vacancy 81,918 s.f. ▲ Direct asking rent $5.55 p.s.f. ▶ Sublease asking rent $6.81 p.s.f. ▼ Concessions Stable ▲ 0 1,000,000 2,000,000 3,000,000 2016 2017 2018 2019 YTD 2020 Supply and demand (s.f.) Net absorption Deliveries 4% 6% 8% 10% 12% 14% 2006 2008 2010 2012 2014 2016 2018 2020 Total vacancy (%) $2 $4 $6 $8 2006 2008 2010 2012 2014 2016 2018 2020 Average asking rent ($ p.s.f.) Direct Sublease For more information, contact: Justin Simakas| justin.simakas@am.jll.com Industrial Insight | Q3 2020 The health, policy, economic and financial disruption stemming from the COVID-19 pandemic continue to create a fluid and evolving environment for all real estate sectors. Uncertainty remains around market performance and implications will differ by market and sector.
- 2. Pittsburgh | Q3 2020 Industrial Statistics Inventory (s.f.) Quarterly total net absorption (s.f.) YTD total net absorption (s.f.) YTD total net absorption (% of stock) Total vacancy (%) Total availability (%) Average total asking rent ($ p.s.f.) Quarterly Completions (s.f.) YTD Completions (s.f.) Under construction (s.f.) Pittsburgh total Warehouse & Distribution 89,884,953 142,558 71,895 0.1% 6.3% 7.3% $6.33 165,000 891,704 1,618,000 Manufacturing 53,883,017 122,339 155,142 0.3% 6.4% 6.4% $4.53 0 0 70,873 Overall Total 143,767,970 264,897 227,037 0.2% 6.3% 7.0% $5.56 165,000 891,704 1,688,873 Beaver County Warehouse & Distribution 5,627,234 -1,225 -18,025 -0.3% 7.7% 10.3% $5.09 0 130,000 105,000 Manufacturing 4,358,833 14,125 20,856 0.5% 10.0% 8.8% $4.14 0 0 0 Overall Total 9,986,067 12,900 2,831 0.0% 8.7% 9.7% $4.60 0 130,000 105,000 Butler County Warehouse & Distribution 4,136,199 177,750 218,690 5.3% 12.2% 12.5% $5.21 0 0 0 Manufacturing 3,561,575 0 0 0.0% 7.4% 8.5% $2.73 0 0 0 Overall Total 7,697,774 177,750 218,690 2.8% 9.9% 10.6% $4.18 0 0 0 Downtown Warehouse & Distribution 18,388,235 -96,124 -156,290 -0.9% 5.0% 7.3% $11.08 0 0 0 Manufacturing 4,643,481 138,500 7,000 0.2% 1.1% 1.7% $6.01 0 0 0 Overall Total 23,031,716 42,376 -149,290 -0.6% 4.2% 6.2% $10.82 0 0 0 East Warehouse & Distribution 5,981,690 -1,683 -54,076 -0.9% 4.9% 6.1% $7.07 0 0 0 Manufacturing 3,637,199 18,936 7,936 0.2% 5.4% 5.4% $3.32 0 0 0 Overall Total 9,618,889 17,253 -46,140 -0.5% 5.1% 5.9% $4.10 0 0 0 Northeast Warehouse & Distribution 6,086,164 30,000 -9,500 -0.2% 3.0% 2.8% $5.84 0 0 0 Manufacturing 6,880,307 200,000 178,750 2.6% 2.7% 3.0% $4.58 0 0 0 Overall Total 12,966,471 230,000 169,250 1.3% 2.9% 2.9% $5.11 0 0 0 Northwest Warehouse & Distribution 10,626,198 23,722 -428,322 -4.0% 7.2% 8.7% $6.67 0 0 0 Manufacturing 3,063,621 0 0 0.0% 0.3% 0.3% $0.00 0 0 0 Overall Total 13,689,819 23,722 -428,322 -3.1% 5.7% 6.8% $6.67 0 0 0 South Warehouse & Distribution 5,525,042 1,512 -7,139 -0.1% 7.6% 9.1% $5.92 0 0 0 Manufacturing 7,892,472 88,600 88,600 1.1% 4.0% 4.0% $5.89 0 0 0 Overall Total 13,417,514 90,112 81,461 0.6% 5.5% 6.1% $5.91 0 0 0 Washington County Warehouse & Distribution 6,588,577 41,011 73,144 1.1% 12.2% 12.7% $5.50 165,000 165,000 250,000 Manufacturing 4,736,380 0 -50 0.0% 2.4% 2.4% $4.52 0 0 0 Overall Total 11,324,957 41,011 73,094 0.6% 8.1% 8.5% $5.41 165,000 165,000 250,000 West Warehouse & Distribution 12,426,000 -33,455 325,571 2.6% 5.0% 4.6% $6.48 0 596,704 1,100,000 Manufacturing 2,706,639 -53,837 -52,553 -1.9% 4.4% 4.3% $5.15 0 0 70,873 Overall Total 15,132,639 -87,292 273,018 1.8% 4.9% 4.5% $6.36 0 596,704 1,170,873 Westmoreland County Warehouse & Distribution 14,499,614 1,050 127,842 0.9% 4.8% 5.3% $4.77 0 0 163,000 Manufacturing 12,402,510 -283,985 -95,397 -0.8% 14.0% 14.0% $4.76 0 0 0 Overall Total 26,902,124 -282,935 32,445 0.1% 9.1% 9.3% $4.76 0 0 163,000 © 2020 Jones Lang LaSalle IP, Inc. All rights reserved. All information contained herein is from sources deemed reliable; however, no representation or warranty is made to the accuracy thereof.