SlideShare a Scribd company logo
1 of 2
Download to read offline
© 2021 Jones Lang LaSalle IP, Inc. All rights reserved.
Pittsburgh
Pittsburgh’s industrial market started 2021 strong with 796,085 s.f. of
positive absorption and nearly 1.7 million s.f. under construction. Krystal
Biotech’s 100,000-s.f. facility at International Drive was the only delivery of
the quarter, however several new construction projects were recently
announced. SunCap Property Group recently purchased a 67-acre site at
Westport Woods and broke ground on a new 280,000-s.f. distribution facility
for Amazon as they continue their rapid expansion in Pittsburgh.
While build-to-suit projects have dominated new construction in the past
year, developers are optimistic about speculative projects in 2021 due to
the limited supply and quick lease-up timeframes being experienced in the
Pittsburgh market. Northpoint Development recently closed on a 26-acre
site in Findlay and has already begun site work for a new 276,000-s.f
speculative distribution warehouse, which it plans to complete by year-end.
Several significant lease transactions were signed in Q1, which contributed
to an overall decline in vacancy to 6.1%. McCollister’s Transportation Group
committed to over 230,000 s.f. at Amcel Center Two in Westmoreland,
Intervala signed a 5-year lease for 217,863 s.f. at 1001 Technology Drive and
Curology executed a nearly 83,000-s.f. lease at Buncher’s speculative
warehouse development located at 155 Solar Drive in Findlay.
Outlook
Pittsburgh’s industrial market is well positioned to excel throughout the
remainder of 2021, as vaccines continue to be deployed across the U.S. and
the economy continues to regain its footing. New development is expected
to continue over the upcoming quarters as the Shell petrochemical facility
becomes fully operational in 2022 and developers attempt to match the
unprecedented industrial occupier demand in Pittsburgh. While initially the
COVID-19 pandemic created a pause in national real estate development,
the impact has further generated a need for high-quality industrial space to
accommodate the changes in consumer behavior caused by the virus.
Industrial development continues to surge as
developers attempt to meet market demand
• Northpoint Development began site work on a new 276,000-s.f.
speculative warehouse project in Findlay Township.
• Investor optimism remains strong as several speculative and build-to-
suit projects broke ground in Q1.
• McCollister’s Transportation Group’s 233,376-s.f. lease at Amcel
Center Two in Westmoreland was the largest lease in Q1.
• The total vacancy rate decreased to 6.1% and is expected to continue
on a downward trend throughout 2021.
Fundamentals Forecast
YTD net absorption 796,085 s.f.
Under construction 1,684,922 s.f. ▲
Total vacancy 6.1%
Sublease vacancy 192,540 s.f. ▶
Direct asking rent $5.51 p.s.f.
Sublease asking rent $4.68 p.s.f. ▶
Concessions Stable
0
2
4
2017 2018 2019 2020 2021
Millions
Supply and demand (s.f.) Net absorption
Deliveries
0%
4%
8%
12%
16%
2007 2009 2011 2013 2015 2017 2019 2021
Total vacancy (%)
$0.00
$3.00
$6.00
$9.00
2007 2009 2011 2013 2015 2017 2019 2021
Average asking rent ($ p.s.f.)
Direct Sublease
For more information, contact: Tobiah Bilski | Tobiah.Bilski@am.jll.com
Industrial Insight | Q1 2021
▶
▲
▲
▲
© 2021 Jones Lang LaSalle IP, Inc. All rights reserved.
Inventory (s.f.)
Quarterly total
net absorption
(s.f.)
YTD total net
absorption (s.f.)
YTD total net
absorption (%
of stock)
Total vacancy
(%)
Total
availability
(%)
Average
total asking
rent ($
p.s.f.)
Quarterly
Completions
(s.f.)
YTD
Completions
(s.f.)
Under
construction (s.f.)
Pittsburgh total
Warehouse & Distribution 91,451,141 575,925 575,925 0.6% 6.2% 6.9% $6.12 100,000 100,000 1,614,049
Manufacturing 54,020,037 220,160 220,160 0.4% 5.9% 6.2% $4.67 0 0 70,873
Overall Total 145,471,178 796,085 796,085 0.5% 6.1% 6.6% $5.51 100,000 100,000 1,684,922
Beaver County
Warehouse & Distribution 5,627,234 -78,120 -78,120 -1.4% 12.4% 14.3% $5.34 0 0 105,000
Manufacturing 4,358,833 0 0 0.0% 8.8% 8.8% $4.14 0 0 0
Total 9,986,067 -78,120 -78,120 -0.8% 10.8% 11.9% $4.79 0 0 105,000
Butler County
Warehouse & Distribution 4,136,199 0 0 0.0% 12.2% 12.2% $5.14 0 0 0
Manufacturing 3,561,575 0 0 0.0% 8.5% 8.5% $3.61 0 0 0
Total 7,697,774 0 0 0.0% 10.5% 10.5% $4.51 0 0 0
Downtown
Warehouse & Distribution 18,369,849 -9,058 -9,058 0.0% 4.7% 5.3% $9.25 0 0 0
Manufacturing 4,643,481 0 0 0.0% 1.0% 1.0% $6.24 0 0 0
Total 23,013,330 -9,058 -9,058 0.0% 4.0% 4.4% $9.06 0 0 0
East
Warehouse & Distribution 6,006,450 -47,816 -47,816 -0.8% 6.2% 6.2% $5.43 0 0 0
Manufacturing 3,637,644 -7,500 -7,500 -0.2% 5.7% 5.7% $3.56 0 0 0
Total 9,644,094 -55,316 -55,316 -0.6% 6.0% 6.0% $4.09 0 0 0
Northeast
Warehouse & Distribution 6,086,164 -14,030 -14,030 -0.2% 1.4% 1.7% $5.88 0 0 0
Manufacturing 6,880,307 -21,260 -21,260 -0.3% 2.7% 2.7% $4.98 0 0 0
Total 12,966,471 -35,290 -35,290 -0.3% 2.1% 2.2% $5.21 0 0 0
Northwest
Warehouse & Distribution 10,461,189 103,167 103,167 1.0% 5.0% 6.0% $6.59 0 0 0
Manufacturing 3,153,030 0 0 0.0% 1.5% 1.5% $0.00 0 0 0
Total 13,614,219 103,167 103,167 0.8% 4.2% 5.0% $6.59 0 0 0
South
Warehouse & Distribution 5,565,702 -118,242 -118,242 -2.1% 8.1% 8.1% $5.91 0 0 0
Manufacturing 7,927,472 0 0 0.0% 4.0% 5.1% $5.89 0 0 0
Total 13,493,174 -118,242 -118,242 -0.9% 5.7% 6.3% $5.90 0 0 0
Washington County
Warehouse & Distribution 6,613,888 55,341 55,341 0.8% 10.3% 12.0% $5.50 0 0 250,000
Manufacturing 4,736,380 7,450 7,450 0.2% 1.4% 1.4% $5.20 0 0 0
Total 11,350,268 62,791 62,791 0.6% 6.6% 7.7% $5.47 0 0 250,000
West
Warehouse & Distribution 14,015,237 252,009 252,009 1.8% 3.9% 3.9% $7.16 100,000 100,000 758,817
Manufacturing 2,706,639 8,750 8,750 0.3% 4.1% 6.5% $5.71 0 0 70,873
Total 16,721,876 260,759 260,759 1.6% 4.0% 4.4% $7.00 100,000 100,000 829,690
Westmoreland County
Warehouse & Distribution 14,569,229 432,674 432,674 3.0% 6.7% 7.5% $5.38 0 0 500,232
Manufacturing 12,414,676 232,720 232,720 1.9% 12.1% 12.1% $4.78 0 0 0
Total 26,983,905 665,394 665,394 2.5% 9.2% 9.6% $4.99 0 0 500,232
For more information, contact: Tobiah Bilski| tobiah.bilski@am.jll.com
Pittsburgh
Industrial Statistics | Q1 2021

More Related Content

What's hot

JLL West Michigan Industrial Insight & Statistics - Q1 2019
JLL West Michigan Industrial Insight & Statistics - Q1 2019JLL West Michigan Industrial Insight & Statistics - Q1 2019
JLL West Michigan Industrial Insight & Statistics - Q1 2019Harrison West
 
JLL West Michigan Industrial Insight & Statistics - Q1 2020
JLL West Michigan Industrial Insight & Statistics - Q1 2020JLL West Michigan Industrial Insight & Statistics - Q1 2020
JLL West Michigan Industrial Insight & Statistics - Q1 2020Harrison West
 
JLL Cleveland Industrial Outlook: Q3 2018
JLL Cleveland Industrial Outlook: Q3 2018JLL Cleveland Industrial Outlook: Q3 2018
JLL Cleveland Industrial Outlook: Q3 2018Andrew Batson
 
JLL Pittsburgh Office Insight & Statistics - Q2 2021
JLL Pittsburgh Office Insight & Statistics - Q2 2021JLL Pittsburgh Office Insight & Statistics - Q2 2021
JLL Pittsburgh Office Insight & Statistics - Q2 2021Tobiah Bilski
 
JLL Pittsburgh Industrial Insight & Statistics - Q4 2020
JLL Pittsburgh Industrial Insight & Statistics - Q4 2020JLL Pittsburgh Industrial Insight & Statistics - Q4 2020
JLL Pittsburgh Industrial Insight & Statistics - Q4 2020Tobiah Bilski
 
JLL Cleveland Industrial Outlook: Q4 2018
JLL Cleveland Industrial Outlook: Q4 2018JLL Cleveland Industrial Outlook: Q4 2018
JLL Cleveland Industrial Outlook: Q4 2018Andrew Batson
 
JLL Cleveland Industrial Outlook: Q4 2018
JLL Cleveland Industrial Outlook: Q4 2018JLL Cleveland Industrial Outlook: Q4 2018
JLL Cleveland Industrial Outlook: Q4 2018Andrew Batson
 
JLL Pittsburgh Industrial Insight & Statistics - Q2 2019
JLL Pittsburgh Industrial Insight & Statistics - Q2 2019JLL Pittsburgh Industrial Insight & Statistics - Q2 2019
JLL Pittsburgh Industrial Insight & Statistics - Q2 2019Tobiah Bilski
 
JLL Pittsburgh Industrial Insight & Statistics - Q3 2018
JLL Pittsburgh Industrial Insight & Statistics - Q3 2018JLL Pittsburgh Industrial Insight & Statistics - Q3 2018
JLL Pittsburgh Industrial Insight & Statistics - Q3 2018Tobiah Bilski
 
JLL Cincinnati Industrial Outlook Q1 2021
JLL Cincinnati Industrial Outlook Q1 2021JLL Cincinnati Industrial Outlook Q1 2021
JLL Cincinnati Industrial Outlook Q1 2021Abby Armbruster
 
JLL Pittsburgh Industrial Insight & Statistics - Q3 2019
JLL Pittsburgh Industrial Insight & Statistics - Q3 2019JLL Pittsburgh Industrial Insight & Statistics - Q3 2019
JLL Pittsburgh Industrial Insight & Statistics - Q3 2019Tobiah Bilski
 
JLL Pittsburgh Industrial Insight & Statistics - Q4 201itt
JLL Pittsburgh Industrial Insight & Statistics - Q4 201ittJLL Pittsburgh Industrial Insight & Statistics - Q4 201itt
JLL Pittsburgh Industrial Insight & Statistics - Q4 201ittTobiah Bilski
 
JLL Detroit Industrial Insight & Statistics - Q2 2017
JLL Detroit Industrial Insight & Statistics - Q2 2017JLL Detroit Industrial Insight & Statistics - Q2 2017
JLL Detroit Industrial Insight & Statistics - Q2 2017Harrison West
 
JLL Pittsburgh Industrial Insight & Statistics - Q3 2020
JLL Pittsburgh Industrial Insight & Statistics - Q3 2020JLL Pittsburgh Industrial Insight & Statistics - Q3 2020
JLL Pittsburgh Industrial Insight & Statistics - Q3 2020Tobiah Bilski
 
JLL Pittsburgh Industrial Insight & Statistics - Q1 2017
JLL Pittsburgh Industrial Insight & Statistics - Q1 2017JLL Pittsburgh Industrial Insight & Statistics - Q1 2017
JLL Pittsburgh Industrial Insight & Statistics - Q1 2017Tobiah Bilski
 
JLL Detroit Industrial Insight & Statistics - Q4 2019
JLL Detroit Industrial Insight & Statistics - Q4 2019JLL Detroit Industrial Insight & Statistics - Q4 2019
JLL Detroit Industrial Insight & Statistics - Q4 2019Harrison West
 
JLL - Tampa Bay 2018 Q1 Industrial Outlook
JLL - Tampa Bay 2018 Q1 Industrial OutlookJLL - Tampa Bay 2018 Q1 Industrial Outlook
JLL - Tampa Bay 2018 Q1 Industrial OutlookKyle Koller
 
JLL Pittsburgh Industrial Insight & Statistics - Q4 2019
JLL Pittsburgh Industrial Insight & Statistics - Q4 2019JLL Pittsburgh Industrial Insight & Statistics - Q4 2019
JLL Pittsburgh Industrial Insight & Statistics - Q4 2019Tobiah Bilski
 
JLL Pittsburgh Industrial Insight & Statistics - Q4 2016
JLL Pittsburgh Industrial Insight & Statistics - Q4 2016JLL Pittsburgh Industrial Insight & Statistics - Q4 2016
JLL Pittsburgh Industrial Insight & Statistics - Q4 2016Tobiah Bilski
 
JLL West Michigan Industrial Insight & Statistics - Q4 2019
JLL West Michigan Industrial Insight & Statistics - Q4 2019JLL West Michigan Industrial Insight & Statistics - Q4 2019
JLL West Michigan Industrial Insight & Statistics - Q4 2019Harrison West
 

What's hot (20)

JLL West Michigan Industrial Insight & Statistics - Q1 2019
JLL West Michigan Industrial Insight & Statistics - Q1 2019JLL West Michigan Industrial Insight & Statistics - Q1 2019
JLL West Michigan Industrial Insight & Statistics - Q1 2019
 
JLL West Michigan Industrial Insight & Statistics - Q1 2020
JLL West Michigan Industrial Insight & Statistics - Q1 2020JLL West Michigan Industrial Insight & Statistics - Q1 2020
JLL West Michigan Industrial Insight & Statistics - Q1 2020
 
JLL Cleveland Industrial Outlook: Q3 2018
JLL Cleveland Industrial Outlook: Q3 2018JLL Cleveland Industrial Outlook: Q3 2018
JLL Cleveland Industrial Outlook: Q3 2018
 
JLL Pittsburgh Office Insight & Statistics - Q2 2021
JLL Pittsburgh Office Insight & Statistics - Q2 2021JLL Pittsburgh Office Insight & Statistics - Q2 2021
JLL Pittsburgh Office Insight & Statistics - Q2 2021
 
JLL Pittsburgh Industrial Insight & Statistics - Q4 2020
JLL Pittsburgh Industrial Insight & Statistics - Q4 2020JLL Pittsburgh Industrial Insight & Statistics - Q4 2020
JLL Pittsburgh Industrial Insight & Statistics - Q4 2020
 
JLL Cleveland Industrial Outlook: Q4 2018
JLL Cleveland Industrial Outlook: Q4 2018JLL Cleveland Industrial Outlook: Q4 2018
JLL Cleveland Industrial Outlook: Q4 2018
 
JLL Cleveland Industrial Outlook: Q4 2018
JLL Cleveland Industrial Outlook: Q4 2018JLL Cleveland Industrial Outlook: Q4 2018
JLL Cleveland Industrial Outlook: Q4 2018
 
JLL Pittsburgh Industrial Insight & Statistics - Q2 2019
JLL Pittsburgh Industrial Insight & Statistics - Q2 2019JLL Pittsburgh Industrial Insight & Statistics - Q2 2019
JLL Pittsburgh Industrial Insight & Statistics - Q2 2019
 
JLL Pittsburgh Industrial Insight & Statistics - Q3 2018
JLL Pittsburgh Industrial Insight & Statistics - Q3 2018JLL Pittsburgh Industrial Insight & Statistics - Q3 2018
JLL Pittsburgh Industrial Insight & Statistics - Q3 2018
 
JLL Cincinnati Industrial Outlook Q1 2021
JLL Cincinnati Industrial Outlook Q1 2021JLL Cincinnati Industrial Outlook Q1 2021
JLL Cincinnati Industrial Outlook Q1 2021
 
JLL Pittsburgh Industrial Insight & Statistics - Q3 2019
JLL Pittsburgh Industrial Insight & Statistics - Q3 2019JLL Pittsburgh Industrial Insight & Statistics - Q3 2019
JLL Pittsburgh Industrial Insight & Statistics - Q3 2019
 
JLL Pittsburgh Industrial Insight & Statistics - Q4 201itt
JLL Pittsburgh Industrial Insight & Statistics - Q4 201ittJLL Pittsburgh Industrial Insight & Statistics - Q4 201itt
JLL Pittsburgh Industrial Insight & Statistics - Q4 201itt
 
JLL Detroit Industrial Insight & Statistics - Q2 2017
JLL Detroit Industrial Insight & Statistics - Q2 2017JLL Detroit Industrial Insight & Statistics - Q2 2017
JLL Detroit Industrial Insight & Statistics - Q2 2017
 
JLL Pittsburgh Industrial Insight & Statistics - Q3 2020
JLL Pittsburgh Industrial Insight & Statistics - Q3 2020JLL Pittsburgh Industrial Insight & Statistics - Q3 2020
JLL Pittsburgh Industrial Insight & Statistics - Q3 2020
 
JLL Pittsburgh Industrial Insight & Statistics - Q1 2017
JLL Pittsburgh Industrial Insight & Statistics - Q1 2017JLL Pittsburgh Industrial Insight & Statistics - Q1 2017
JLL Pittsburgh Industrial Insight & Statistics - Q1 2017
 
JLL Detroit Industrial Insight & Statistics - Q4 2019
JLL Detroit Industrial Insight & Statistics - Q4 2019JLL Detroit Industrial Insight & Statistics - Q4 2019
JLL Detroit Industrial Insight & Statistics - Q4 2019
 
JLL - Tampa Bay 2018 Q1 Industrial Outlook
JLL - Tampa Bay 2018 Q1 Industrial OutlookJLL - Tampa Bay 2018 Q1 Industrial Outlook
JLL - Tampa Bay 2018 Q1 Industrial Outlook
 
JLL Pittsburgh Industrial Insight & Statistics - Q4 2019
JLL Pittsburgh Industrial Insight & Statistics - Q4 2019JLL Pittsburgh Industrial Insight & Statistics - Q4 2019
JLL Pittsburgh Industrial Insight & Statistics - Q4 2019
 
JLL Pittsburgh Industrial Insight & Statistics - Q4 2016
JLL Pittsburgh Industrial Insight & Statistics - Q4 2016JLL Pittsburgh Industrial Insight & Statistics - Q4 2016
JLL Pittsburgh Industrial Insight & Statistics - Q4 2016
 
JLL West Michigan Industrial Insight & Statistics - Q4 2019
JLL West Michigan Industrial Insight & Statistics - Q4 2019JLL West Michigan Industrial Insight & Statistics - Q4 2019
JLL West Michigan Industrial Insight & Statistics - Q4 2019
 

Similar to JLL Pittsburgh Industrial Insight & Statistics - Q1 2021

JLL Pittsburgh Industrial Insight & Statistics - Q1 2019
JLL Pittsburgh Industrial Insight & Statistics - Q1 2019JLL Pittsburgh Industrial Insight & Statistics - Q1 2019
JLL Pittsburgh Industrial Insight & Statistics - Q1 2019Tobiah Bilski
 
JLL Pittsburgh Industrial Insight & Statistics - Q4 2018
JLL Pittsburgh Industrial Insight & Statistics - Q4 2018JLL Pittsburgh Industrial Insight & Statistics - Q4 2018
JLL Pittsburgh Industrial Insight & Statistics - Q4 2018Tobiah Bilski
 
JLL Pittsburgh Industrial Insight & Statistics - Q2 2018
JLL Pittsburgh Industrial Insight & Statistics - Q2 2018JLL Pittsburgh Industrial Insight & Statistics - Q2 2018
JLL Pittsburgh Industrial Insight & Statistics - Q2 2018Tobiah Bilski
 
JLL Cleveland Industrial Outlook: Q1 2017
JLL Cleveland Industrial Outlook: Q1 2017JLL Cleveland Industrial Outlook: Q1 2017
JLL Cleveland Industrial Outlook: Q1 2017Andrew Batson
 
JLL Pittsburgh Industrial Insight & Statistics - Q1 2018
JLL Pittsburgh Industrial Insight & Statistics - Q1 2018JLL Pittsburgh Industrial Insight & Statistics - Q1 2018
JLL Pittsburgh Industrial Insight & Statistics - Q1 2018Tobiah Bilski
 
JLL Cleveland Industrial Outlook Q4 2019
JLL Cleveland Industrial Outlook Q4 2019JLL Cleveland Industrial Outlook Q4 2019
JLL Cleveland Industrial Outlook Q4 2019Johnathan Miller
 
JLL Cincinnati Industrial Outlook Q3 2020
JLL Cincinnati Industrial Outlook Q3 2020JLL Cincinnati Industrial Outlook Q3 2020
JLL Cincinnati Industrial Outlook Q3 2020Abby Armbruster
 
JLL Cleveland Industrial Outlook: Q1 2019
JLL Cleveland Industrial Outlook: Q1 2019JLL Cleveland Industrial Outlook: Q1 2019
JLL Cleveland Industrial Outlook: Q1 2019Andrew Batson
 
JLL Pittsburgh Industrial Insight & Statistics - Q3 2016
JLL Pittsburgh Industrial Insight & Statistics - Q3 2016JLL Pittsburgh Industrial Insight & Statistics - Q3 2016
JLL Pittsburgh Industrial Insight & Statistics - Q3 2016Tobiah Bilski
 
Jll cincinnati industrial outlook q1 2017
Jll cincinnati industrial outlook   q1 2017Jll cincinnati industrial outlook   q1 2017
Jll cincinnati industrial outlook q1 2017Abby Armbruster
 
JLL Cleveland Industrial Outlook Q3 2019
JLL Cleveland Industrial Outlook   Q3 2019JLL Cleveland Industrial Outlook   Q3 2019
JLL Cleveland Industrial Outlook Q3 2019Johnathan Miller
 
JLL Cleveland Industrial Outlook: Q3 2019
JLL Cleveland Industrial Outlook: Q3 2019JLL Cleveland Industrial Outlook: Q3 2019
JLL Cleveland Industrial Outlook: Q3 2019Johnathan Miller
 
JLL Cincinnati Industrial Outlook Q4 2017
JLL Cincinnati Industrial Outlook Q4 2017JLL Cincinnati Industrial Outlook Q4 2017
JLL Cincinnati Industrial Outlook Q4 2017Abby Armbruster
 
JLL Cleveland Industrial Outlook: Q2 2020
JLL Cleveland Industrial Outlook: Q2 2020JLL Cleveland Industrial Outlook: Q2 2020
JLL Cleveland Industrial Outlook: Q2 2020Andrew Batson
 

Similar to JLL Pittsburgh Industrial Insight & Statistics - Q1 2021 (14)

JLL Pittsburgh Industrial Insight & Statistics - Q1 2019
JLL Pittsburgh Industrial Insight & Statistics - Q1 2019JLL Pittsburgh Industrial Insight & Statistics - Q1 2019
JLL Pittsburgh Industrial Insight & Statistics - Q1 2019
 
JLL Pittsburgh Industrial Insight & Statistics - Q4 2018
JLL Pittsburgh Industrial Insight & Statistics - Q4 2018JLL Pittsburgh Industrial Insight & Statistics - Q4 2018
JLL Pittsburgh Industrial Insight & Statistics - Q4 2018
 
JLL Pittsburgh Industrial Insight & Statistics - Q2 2018
JLL Pittsburgh Industrial Insight & Statistics - Q2 2018JLL Pittsburgh Industrial Insight & Statistics - Q2 2018
JLL Pittsburgh Industrial Insight & Statistics - Q2 2018
 
JLL Cleveland Industrial Outlook: Q1 2017
JLL Cleveland Industrial Outlook: Q1 2017JLL Cleveland Industrial Outlook: Q1 2017
JLL Cleveland Industrial Outlook: Q1 2017
 
JLL Pittsburgh Industrial Insight & Statistics - Q1 2018
JLL Pittsburgh Industrial Insight & Statistics - Q1 2018JLL Pittsburgh Industrial Insight & Statistics - Q1 2018
JLL Pittsburgh Industrial Insight & Statistics - Q1 2018
 
JLL Cleveland Industrial Outlook Q4 2019
JLL Cleveland Industrial Outlook Q4 2019JLL Cleveland Industrial Outlook Q4 2019
JLL Cleveland Industrial Outlook Q4 2019
 
JLL Cincinnati Industrial Outlook Q3 2020
JLL Cincinnati Industrial Outlook Q3 2020JLL Cincinnati Industrial Outlook Q3 2020
JLL Cincinnati Industrial Outlook Q3 2020
 
JLL Cleveland Industrial Outlook: Q1 2019
JLL Cleveland Industrial Outlook: Q1 2019JLL Cleveland Industrial Outlook: Q1 2019
JLL Cleveland Industrial Outlook: Q1 2019
 
JLL Pittsburgh Industrial Insight & Statistics - Q3 2016
JLL Pittsburgh Industrial Insight & Statistics - Q3 2016JLL Pittsburgh Industrial Insight & Statistics - Q3 2016
JLL Pittsburgh Industrial Insight & Statistics - Q3 2016
 
Jll cincinnati industrial outlook q1 2017
Jll cincinnati industrial outlook   q1 2017Jll cincinnati industrial outlook   q1 2017
Jll cincinnati industrial outlook q1 2017
 
JLL Cleveland Industrial Outlook Q3 2019
JLL Cleveland Industrial Outlook   Q3 2019JLL Cleveland Industrial Outlook   Q3 2019
JLL Cleveland Industrial Outlook Q3 2019
 
JLL Cleveland Industrial Outlook: Q3 2019
JLL Cleveland Industrial Outlook: Q3 2019JLL Cleveland Industrial Outlook: Q3 2019
JLL Cleveland Industrial Outlook: Q3 2019
 
JLL Cincinnati Industrial Outlook Q4 2017
JLL Cincinnati Industrial Outlook Q4 2017JLL Cincinnati Industrial Outlook Q4 2017
JLL Cincinnati Industrial Outlook Q4 2017
 
JLL Cleveland Industrial Outlook: Q2 2020
JLL Cleveland Industrial Outlook: Q2 2020JLL Cleveland Industrial Outlook: Q2 2020
JLL Cleveland Industrial Outlook: Q2 2020
 

More from Tobiah Bilski

Pittsburgh Office Insight & Stats Q1 2022
Pittsburgh Office Insight & Stats Q1 2022Pittsburgh Office Insight & Stats Q1 2022
Pittsburgh Office Insight & Stats Q1 2022Tobiah Bilski
 
Pittsburgh Office Insight & Stats Q4 2021
Pittsburgh Office Insight & Stats Q4 2021Pittsburgh Office Insight & Stats Q4 2021
Pittsburgh Office Insight & Stats Q4 2021Tobiah Bilski
 
JLL Pittsburgh Office Insight & Statistics - Q1 2021
JLL Pittsburgh Office Insight & Statistics - Q1 2021JLL Pittsburgh Office Insight & Statistics - Q1 2021
JLL Pittsburgh Office Insight & Statistics - Q1 2021Tobiah Bilski
 
JLL Pittsburgh Office Insight & Statistics - Q2 2020
JLL Pittsburgh Office Insight & Statistics - Q2 2020JLL Pittsburgh Office Insight & Statistics - Q2 2020
JLL Pittsburgh Office Insight & Statistics - Q2 2020Tobiah Bilski
 
JLL Pittsburgh Office Insight & Statistics - Q1 2020
JLL Pittsburgh Office Insight & Statistics - Q1 2020JLL Pittsburgh Office Insight & Statistics - Q1 2020
JLL Pittsburgh Office Insight & Statistics - Q1 2020Tobiah Bilski
 
JLL Pittsburgh Office Insight & Statistics - Q4 2019
JLL Pittsburgh Office Insight & Statistics - Q4 2019JLL Pittsburgh Office Insight & Statistics - Q4 2019
JLL Pittsburgh Office Insight & Statistics - Q4 2019Tobiah Bilski
 
JLL Pittsburgh Office Insight & Statistics - Q3 2019
 JLL Pittsburgh Office Insight & Statistics - Q3 2019 JLL Pittsburgh Office Insight & Statistics - Q3 2019
JLL Pittsburgh Office Insight & Statistics - Q3 2019Tobiah Bilski
 
JLL Pittsburgh Office Insight & Statistics - Q2 2019
JLL Pittsburgh Office Insight & Statistics - Q2 2019JLL Pittsburgh Office Insight & Statistics - Q2 2019
JLL Pittsburgh Office Insight & Statistics - Q2 2019Tobiah Bilski
 
JLL Pittsburgh Office Insight & Statistics - Q1 2019
JLL Pittsburgh Office Insight & Statistics - Q1 2019JLL Pittsburgh Office Insight & Statistics - Q1 2019
JLL Pittsburgh Office Insight & Statistics - Q1 2019Tobiah Bilski
 
JLL Pittsburgh Office Insight & Statistics - Q4 2018
JLL Pittsburgh Office Insight & Statistics - Q4 2018JLL Pittsburgh Office Insight & Statistics - Q4 2018
JLL Pittsburgh Office Insight & Statistics - Q4 2018Tobiah Bilski
 
JLL Pittsburgh Office Insight & Statistics - Q3 2018
JLL Pittsburgh Office Insight & Statistics - Q3 2018JLL Pittsburgh Office Insight & Statistics - Q3 2018
JLL Pittsburgh Office Insight & Statistics - Q3 2018Tobiah Bilski
 
JLL Pittsburgh Office Insight & Statistics - Q2 2018
JLL Pittsburgh Office Insight & Statistics - Q2 2018 JLL Pittsburgh Office Insight & Statistics - Q2 2018
JLL Pittsburgh Office Insight & Statistics - Q2 2018 Tobiah Bilski
 
JLL Pittsburgh Office Insight & Statistics - Q1 2018
JLL Pittsburgh Office Insight & Statistics - Q1 2018JLL Pittsburgh Office Insight & Statistics - Q1 2018
JLL Pittsburgh Office Insight & Statistics - Q1 2018Tobiah Bilski
 

More from Tobiah Bilski (13)

Pittsburgh Office Insight & Stats Q1 2022
Pittsburgh Office Insight & Stats Q1 2022Pittsburgh Office Insight & Stats Q1 2022
Pittsburgh Office Insight & Stats Q1 2022
 
Pittsburgh Office Insight & Stats Q4 2021
Pittsburgh Office Insight & Stats Q4 2021Pittsburgh Office Insight & Stats Q4 2021
Pittsburgh Office Insight & Stats Q4 2021
 
JLL Pittsburgh Office Insight & Statistics - Q1 2021
JLL Pittsburgh Office Insight & Statistics - Q1 2021JLL Pittsburgh Office Insight & Statistics - Q1 2021
JLL Pittsburgh Office Insight & Statistics - Q1 2021
 
JLL Pittsburgh Office Insight & Statistics - Q2 2020
JLL Pittsburgh Office Insight & Statistics - Q2 2020JLL Pittsburgh Office Insight & Statistics - Q2 2020
JLL Pittsburgh Office Insight & Statistics - Q2 2020
 
JLL Pittsburgh Office Insight & Statistics - Q1 2020
JLL Pittsburgh Office Insight & Statistics - Q1 2020JLL Pittsburgh Office Insight & Statistics - Q1 2020
JLL Pittsburgh Office Insight & Statistics - Q1 2020
 
JLL Pittsburgh Office Insight & Statistics - Q4 2019
JLL Pittsburgh Office Insight & Statistics - Q4 2019JLL Pittsburgh Office Insight & Statistics - Q4 2019
JLL Pittsburgh Office Insight & Statistics - Q4 2019
 
JLL Pittsburgh Office Insight & Statistics - Q3 2019
 JLL Pittsburgh Office Insight & Statistics - Q3 2019 JLL Pittsburgh Office Insight & Statistics - Q3 2019
JLL Pittsburgh Office Insight & Statistics - Q3 2019
 
JLL Pittsburgh Office Insight & Statistics - Q2 2019
JLL Pittsburgh Office Insight & Statistics - Q2 2019JLL Pittsburgh Office Insight & Statistics - Q2 2019
JLL Pittsburgh Office Insight & Statistics - Q2 2019
 
JLL Pittsburgh Office Insight & Statistics - Q1 2019
JLL Pittsburgh Office Insight & Statistics - Q1 2019JLL Pittsburgh Office Insight & Statistics - Q1 2019
JLL Pittsburgh Office Insight & Statistics - Q1 2019
 
JLL Pittsburgh Office Insight & Statistics - Q4 2018
JLL Pittsburgh Office Insight & Statistics - Q4 2018JLL Pittsburgh Office Insight & Statistics - Q4 2018
JLL Pittsburgh Office Insight & Statistics - Q4 2018
 
JLL Pittsburgh Office Insight & Statistics - Q3 2018
JLL Pittsburgh Office Insight & Statistics - Q3 2018JLL Pittsburgh Office Insight & Statistics - Q3 2018
JLL Pittsburgh Office Insight & Statistics - Q3 2018
 
JLL Pittsburgh Office Insight & Statistics - Q2 2018
JLL Pittsburgh Office Insight & Statistics - Q2 2018 JLL Pittsburgh Office Insight & Statistics - Q2 2018
JLL Pittsburgh Office Insight & Statistics - Q2 2018
 
JLL Pittsburgh Office Insight & Statistics - Q1 2018
JLL Pittsburgh Office Insight & Statistics - Q1 2018JLL Pittsburgh Office Insight & Statistics - Q1 2018
JLL Pittsburgh Office Insight & Statistics - Q1 2018
 

Recently uploaded

9990771857 Call Girls in Dwarka Sector 10 Delhi (Call Girls) Delhi
9990771857 Call Girls in Dwarka Sector 10 Delhi (Call Girls) Delhi9990771857 Call Girls in Dwarka Sector 10 Delhi (Call Girls) Delhi
9990771857 Call Girls in Dwarka Sector 10 Delhi (Call Girls) Delhidelhimodel235
 
Call Girls in Karkardooma Delhi +91 84487779280}Woman Seeking Man in Delhi NCR
Call Girls in Karkardooma Delhi +91 84487779280}Woman Seeking Man in Delhi NCRCall Girls in Karkardooma Delhi +91 84487779280}Woman Seeking Man in Delhi NCR
Call Girls in Karkardooma Delhi +91 84487779280}Woman Seeking Man in Delhi NCRasmaqueen5
 
Kalpataru Exquisite Wakad Pune E-Brochure.pdf
Kalpataru Exquisite Wakad Pune  E-Brochure.pdfKalpataru Exquisite Wakad Pune  E-Brochure.pdf
Kalpataru Exquisite Wakad Pune E-Brochure.pdfManishSaxena95
 
Cheap Rate ✨➥9711108085▻✨Call Girls In Malviya Nagar(Delhi)
Cheap Rate ✨➥9711108085▻✨Call Girls In Malviya Nagar(Delhi)Cheap Rate ✨➥9711108085▻✨Call Girls In Malviya Nagar(Delhi)
Cheap Rate ✨➥9711108085▻✨Call Girls In Malviya Nagar(Delhi)delhi24hrs1
 
9990771857 Call Girls in Dwarka Sector 3 Delhi (Call Girls) Delhi
9990771857 Call Girls in Dwarka Sector 3 Delhi (Call Girls) Delhi9990771857 Call Girls in Dwarka Sector 3 Delhi (Call Girls) Delhi
9990771857 Call Girls in Dwarka Sector 3 Delhi (Call Girls) Delhidelhimodel235
 
Low Rate ✨➥9711108085▻✨Call Girls In East Of Kailash (E.K) (Delhi)
Low Rate ✨➥9711108085▻✨Call Girls In East Of Kailash (E.K) (Delhi)Low Rate ✨➥9711108085▻✨Call Girls In East Of Kailash (E.K) (Delhi)
Low Rate ✨➥9711108085▻✨Call Girls In East Of Kailash (E.K) (Delhi)delhi24hrs1
 
Real Estate Finance and Investments (2019).pdf
Real Estate Finance and Investments (2019).pdfReal Estate Finance and Investments (2019).pdf
Real Estate Finance and Investments (2019).pdfZahraYusuf9
 
9990771857 Call Girls in Dwarka Sector 7 Delhi (Call Girls) Delhi
9990771857 Call Girls in Dwarka Sector 7 Delhi (Call Girls) Delhi9990771857 Call Girls in Dwarka Sector 7 Delhi (Call Girls) Delhi
9990771857 Call Girls in Dwarka Sector 7 Delhi (Call Girls) Delhidelhimodel235
 
Kohinoor Hinjewadi Phase 2 Pune E-Brochure.pdf
Kohinoor Hinjewadi Phase 2 Pune  E-Brochure.pdfKohinoor Hinjewadi Phase 2 Pune  E-Brochure.pdf
Kohinoor Hinjewadi Phase 2 Pune E-Brochure.pdfManishSaxena95
 
Enjoy Night ≽ 8448380779 ≼ Call Girls In Huda City Centre (Gurgaon)
Enjoy Night ≽ 8448380779 ≼ Call Girls In Huda City Centre (Gurgaon)Enjoy Night ≽ 8448380779 ≼ Call Girls In Huda City Centre (Gurgaon)
Enjoy Night ≽ 8448380779 ≼ Call Girls In Huda City Centre (Gurgaon)Delhi Call girls
 
2k Shots ≽ 9205541914 ≼ Call Girls In Sainik Farm (Delhi)
2k Shots ≽ 9205541914 ≼ Call Girls In Sainik Farm (Delhi)2k Shots ≽ 9205541914 ≼ Call Girls In Sainik Farm (Delhi)
2k Shots ≽ 9205541914 ≼ Call Girls In Sainik Farm (Delhi)Delhi Call girls
 
Mahindra Happinest Tathawade Pune Brochure.pdf
Mahindra Happinest Tathawade Pune Brochure.pdfMahindra Happinest Tathawade Pune Brochure.pdf
Mahindra Happinest Tathawade Pune Brochure.pdfBabyrudram
 
Sector 62, Noida Call girls :8448380779 Noida Escorts | 100% verified
Sector 62, Noida Call girls :8448380779 Noida Escorts | 100% verifiedSector 62, Noida Call girls :8448380779 Noida Escorts | 100% verified
Sector 62, Noida Call girls :8448380779 Noida Escorts | 100% verifiedDelhi Call girls
 
Cheap Rate ✨➥9711108085▻✨Call Girls In Bhajanpura (Delhi)
Cheap Rate ✨➥9711108085▻✨Call Girls In Bhajanpura (Delhi)Cheap Rate ✨➥9711108085▻✨Call Girls In Bhajanpura (Delhi)
Cheap Rate ✨➥9711108085▻✨Call Girls In Bhajanpura (Delhi)delhi24hrs1
 
Sector 62, Noida Call girls :8448380779 Model Escorts | 100% verified
Sector 62, Noida Call girls :8448380779 Model Escorts | 100% verifiedSector 62, Noida Call girls :8448380779 Model Escorts | 100% verified
Sector 62, Noida Call girls :8448380779 Model Escorts | 100% verifiedDelhi Call girls
 
9990771857 Call Girls in Dwarka Sector 07 Delhi (Call Girls) Delhi
9990771857 Call Girls in Dwarka Sector 07 Delhi (Call Girls) Delhi9990771857 Call Girls in Dwarka Sector 07 Delhi (Call Girls) Delhi
9990771857 Call Girls in Dwarka Sector 07 Delhi (Call Girls) Delhidelhimodel235
 
Kohinoor Teiko Hinjewadi Phase 2 Pune E-Brochure.pdf
Kohinoor Teiko Hinjewadi Phase 2 Pune  E-Brochure.pdfKohinoor Teiko Hinjewadi Phase 2 Pune  E-Brochure.pdf
Kohinoor Teiko Hinjewadi Phase 2 Pune E-Brochure.pdfManishSaxena95
 
Rohan Harita Tathawade Pune Brochure.pdf
Rohan Harita Tathawade Pune Brochure.pdfRohan Harita Tathawade Pune Brochure.pdf
Rohan Harita Tathawade Pune Brochure.pdfabbu831446
 
9990771857 Call Girls Dwarka Sector 9 Delhi (Call Girls ) Delhi
9990771857 Call Girls Dwarka Sector 9 Delhi (Call Girls ) Delhi9990771857 Call Girls Dwarka Sector 9 Delhi (Call Girls ) Delhi
9990771857 Call Girls Dwarka Sector 9 Delhi (Call Girls ) Delhidelhimodel235
 
Eldeco Dwarka Project In Delhi-brochure.pdf.pdf
Eldeco Dwarka Project In Delhi-brochure.pdf.pdfEldeco Dwarka Project In Delhi-brochure.pdf.pdf
Eldeco Dwarka Project In Delhi-brochure.pdf.pdfkratirudram
 

Recently uploaded (20)

9990771857 Call Girls in Dwarka Sector 10 Delhi (Call Girls) Delhi
9990771857 Call Girls in Dwarka Sector 10 Delhi (Call Girls) Delhi9990771857 Call Girls in Dwarka Sector 10 Delhi (Call Girls) Delhi
9990771857 Call Girls in Dwarka Sector 10 Delhi (Call Girls) Delhi
 
Call Girls in Karkardooma Delhi +91 84487779280}Woman Seeking Man in Delhi NCR
Call Girls in Karkardooma Delhi +91 84487779280}Woman Seeking Man in Delhi NCRCall Girls in Karkardooma Delhi +91 84487779280}Woman Seeking Man in Delhi NCR
Call Girls in Karkardooma Delhi +91 84487779280}Woman Seeking Man in Delhi NCR
 
Kalpataru Exquisite Wakad Pune E-Brochure.pdf
Kalpataru Exquisite Wakad Pune  E-Brochure.pdfKalpataru Exquisite Wakad Pune  E-Brochure.pdf
Kalpataru Exquisite Wakad Pune E-Brochure.pdf
 
Cheap Rate ✨➥9711108085▻✨Call Girls In Malviya Nagar(Delhi)
Cheap Rate ✨➥9711108085▻✨Call Girls In Malviya Nagar(Delhi)Cheap Rate ✨➥9711108085▻✨Call Girls In Malviya Nagar(Delhi)
Cheap Rate ✨➥9711108085▻✨Call Girls In Malviya Nagar(Delhi)
 
9990771857 Call Girls in Dwarka Sector 3 Delhi (Call Girls) Delhi
9990771857 Call Girls in Dwarka Sector 3 Delhi (Call Girls) Delhi9990771857 Call Girls in Dwarka Sector 3 Delhi (Call Girls) Delhi
9990771857 Call Girls in Dwarka Sector 3 Delhi (Call Girls) Delhi
 
Low Rate ✨➥9711108085▻✨Call Girls In East Of Kailash (E.K) (Delhi)
Low Rate ✨➥9711108085▻✨Call Girls In East Of Kailash (E.K) (Delhi)Low Rate ✨➥9711108085▻✨Call Girls In East Of Kailash (E.K) (Delhi)
Low Rate ✨➥9711108085▻✨Call Girls In East Of Kailash (E.K) (Delhi)
 
Real Estate Finance and Investments (2019).pdf
Real Estate Finance and Investments (2019).pdfReal Estate Finance and Investments (2019).pdf
Real Estate Finance and Investments (2019).pdf
 
9990771857 Call Girls in Dwarka Sector 7 Delhi (Call Girls) Delhi
9990771857 Call Girls in Dwarka Sector 7 Delhi (Call Girls) Delhi9990771857 Call Girls in Dwarka Sector 7 Delhi (Call Girls) Delhi
9990771857 Call Girls in Dwarka Sector 7 Delhi (Call Girls) Delhi
 
Kohinoor Hinjewadi Phase 2 Pune E-Brochure.pdf
Kohinoor Hinjewadi Phase 2 Pune  E-Brochure.pdfKohinoor Hinjewadi Phase 2 Pune  E-Brochure.pdf
Kohinoor Hinjewadi Phase 2 Pune E-Brochure.pdf
 
Enjoy Night ≽ 8448380779 ≼ Call Girls In Huda City Centre (Gurgaon)
Enjoy Night ≽ 8448380779 ≼ Call Girls In Huda City Centre (Gurgaon)Enjoy Night ≽ 8448380779 ≼ Call Girls In Huda City Centre (Gurgaon)
Enjoy Night ≽ 8448380779 ≼ Call Girls In Huda City Centre (Gurgaon)
 
2k Shots ≽ 9205541914 ≼ Call Girls In Sainik Farm (Delhi)
2k Shots ≽ 9205541914 ≼ Call Girls In Sainik Farm (Delhi)2k Shots ≽ 9205541914 ≼ Call Girls In Sainik Farm (Delhi)
2k Shots ≽ 9205541914 ≼ Call Girls In Sainik Farm (Delhi)
 
Mahindra Happinest Tathawade Pune Brochure.pdf
Mahindra Happinest Tathawade Pune Brochure.pdfMahindra Happinest Tathawade Pune Brochure.pdf
Mahindra Happinest Tathawade Pune Brochure.pdf
 
Sector 62, Noida Call girls :8448380779 Noida Escorts | 100% verified
Sector 62, Noida Call girls :8448380779 Noida Escorts | 100% verifiedSector 62, Noida Call girls :8448380779 Noida Escorts | 100% verified
Sector 62, Noida Call girls :8448380779 Noida Escorts | 100% verified
 
Cheap Rate ✨➥9711108085▻✨Call Girls In Bhajanpura (Delhi)
Cheap Rate ✨➥9711108085▻✨Call Girls In Bhajanpura (Delhi)Cheap Rate ✨➥9711108085▻✨Call Girls In Bhajanpura (Delhi)
Cheap Rate ✨➥9711108085▻✨Call Girls In Bhajanpura (Delhi)
 
Sector 62, Noida Call girls :8448380779 Model Escorts | 100% verified
Sector 62, Noida Call girls :8448380779 Model Escorts | 100% verifiedSector 62, Noida Call girls :8448380779 Model Escorts | 100% verified
Sector 62, Noida Call girls :8448380779 Model Escorts | 100% verified
 
9990771857 Call Girls in Dwarka Sector 07 Delhi (Call Girls) Delhi
9990771857 Call Girls in Dwarka Sector 07 Delhi (Call Girls) Delhi9990771857 Call Girls in Dwarka Sector 07 Delhi (Call Girls) Delhi
9990771857 Call Girls in Dwarka Sector 07 Delhi (Call Girls) Delhi
 
Kohinoor Teiko Hinjewadi Phase 2 Pune E-Brochure.pdf
Kohinoor Teiko Hinjewadi Phase 2 Pune  E-Brochure.pdfKohinoor Teiko Hinjewadi Phase 2 Pune  E-Brochure.pdf
Kohinoor Teiko Hinjewadi Phase 2 Pune E-Brochure.pdf
 
Rohan Harita Tathawade Pune Brochure.pdf
Rohan Harita Tathawade Pune Brochure.pdfRohan Harita Tathawade Pune Brochure.pdf
Rohan Harita Tathawade Pune Brochure.pdf
 
9990771857 Call Girls Dwarka Sector 9 Delhi (Call Girls ) Delhi
9990771857 Call Girls Dwarka Sector 9 Delhi (Call Girls ) Delhi9990771857 Call Girls Dwarka Sector 9 Delhi (Call Girls ) Delhi
9990771857 Call Girls Dwarka Sector 9 Delhi (Call Girls ) Delhi
 
Eldeco Dwarka Project In Delhi-brochure.pdf.pdf
Eldeco Dwarka Project In Delhi-brochure.pdf.pdfEldeco Dwarka Project In Delhi-brochure.pdf.pdf
Eldeco Dwarka Project In Delhi-brochure.pdf.pdf
 

JLL Pittsburgh Industrial Insight & Statistics - Q1 2021

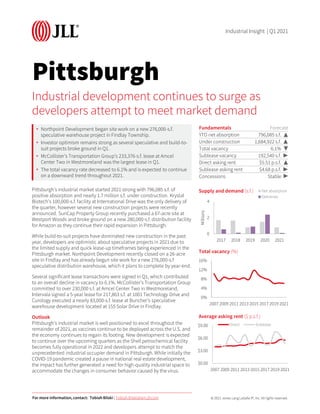
  • 1. © 2021 Jones Lang LaSalle IP, Inc. All rights reserved. Pittsburgh Pittsburgh’s industrial market started 2021 strong with 796,085 s.f. of positive absorption and nearly 1.7 million s.f. under construction. Krystal Biotech’s 100,000-s.f. facility at International Drive was the only delivery of the quarter, however several new construction projects were recently announced. SunCap Property Group recently purchased a 67-acre site at Westport Woods and broke ground on a new 280,000-s.f. distribution facility for Amazon as they continue their rapid expansion in Pittsburgh. While build-to-suit projects have dominated new construction in the past year, developers are optimistic about speculative projects in 2021 due to the limited supply and quick lease-up timeframes being experienced in the Pittsburgh market. Northpoint Development recently closed on a 26-acre site in Findlay and has already begun site work for a new 276,000-s.f speculative distribution warehouse, which it plans to complete by year-end. Several significant lease transactions were signed in Q1, which contributed to an overall decline in vacancy to 6.1%. McCollister’s Transportation Group committed to over 230,000 s.f. at Amcel Center Two in Westmoreland, Intervala signed a 5-year lease for 217,863 s.f. at 1001 Technology Drive and Curology executed a nearly 83,000-s.f. lease at Buncher’s speculative warehouse development located at 155 Solar Drive in Findlay. Outlook Pittsburgh’s industrial market is well positioned to excel throughout the remainder of 2021, as vaccines continue to be deployed across the U.S. and the economy continues to regain its footing. New development is expected to continue over the upcoming quarters as the Shell petrochemical facility becomes fully operational in 2022 and developers attempt to match the unprecedented industrial occupier demand in Pittsburgh. While initially the COVID-19 pandemic created a pause in national real estate development, the impact has further generated a need for high-quality industrial space to accommodate the changes in consumer behavior caused by the virus. Industrial development continues to surge as developers attempt to meet market demand • Northpoint Development began site work on a new 276,000-s.f. speculative warehouse project in Findlay Township. • Investor optimism remains strong as several speculative and build-to- suit projects broke ground in Q1. • McCollister’s Transportation Group’s 233,376-s.f. lease at Amcel Center Two in Westmoreland was the largest lease in Q1. • The total vacancy rate decreased to 6.1% and is expected to continue on a downward trend throughout 2021. Fundamentals Forecast YTD net absorption 796,085 s.f. Under construction 1,684,922 s.f. ▲ Total vacancy 6.1% Sublease vacancy 192,540 s.f. ▶ Direct asking rent $5.51 p.s.f. Sublease asking rent $4.68 p.s.f. ▶ Concessions Stable 0 2 4 2017 2018 2019 2020 2021 Millions Supply and demand (s.f.) Net absorption Deliveries 0% 4% 8% 12% 16% 2007 2009 2011 2013 2015 2017 2019 2021 Total vacancy (%) $0.00 $3.00 $6.00 $9.00 2007 2009 2011 2013 2015 2017 2019 2021 Average asking rent ($ p.s.f.) Direct Sublease For more information, contact: Tobiah Bilski | Tobiah.Bilski@am.jll.com Industrial Insight | Q1 2021 ▶ ▲ ▲ ▲
  • 2. © 2021 Jones Lang LaSalle IP, Inc. All rights reserved. Inventory (s.f.) Quarterly total net absorption (s.f.) YTD total net absorption (s.f.) YTD total net absorption (% of stock) Total vacancy (%) Total availability (%) Average total asking rent ($ p.s.f.) Quarterly Completions (s.f.) YTD Completions (s.f.) Under construction (s.f.) Pittsburgh total Warehouse & Distribution 91,451,141 575,925 575,925 0.6% 6.2% 6.9% $6.12 100,000 100,000 1,614,049 Manufacturing 54,020,037 220,160 220,160 0.4% 5.9% 6.2% $4.67 0 0 70,873 Overall Total 145,471,178 796,085 796,085 0.5% 6.1% 6.6% $5.51 100,000 100,000 1,684,922 Beaver County Warehouse & Distribution 5,627,234 -78,120 -78,120 -1.4% 12.4% 14.3% $5.34 0 0 105,000 Manufacturing 4,358,833 0 0 0.0% 8.8% 8.8% $4.14 0 0 0 Total 9,986,067 -78,120 -78,120 -0.8% 10.8% 11.9% $4.79 0 0 105,000 Butler County Warehouse & Distribution 4,136,199 0 0 0.0% 12.2% 12.2% $5.14 0 0 0 Manufacturing 3,561,575 0 0 0.0% 8.5% 8.5% $3.61 0 0 0 Total 7,697,774 0 0 0.0% 10.5% 10.5% $4.51 0 0 0 Downtown Warehouse & Distribution 18,369,849 -9,058 -9,058 0.0% 4.7% 5.3% $9.25 0 0 0 Manufacturing 4,643,481 0 0 0.0% 1.0% 1.0% $6.24 0 0 0 Total 23,013,330 -9,058 -9,058 0.0% 4.0% 4.4% $9.06 0 0 0 East Warehouse & Distribution 6,006,450 -47,816 -47,816 -0.8% 6.2% 6.2% $5.43 0 0 0 Manufacturing 3,637,644 -7,500 -7,500 -0.2% 5.7% 5.7% $3.56 0 0 0 Total 9,644,094 -55,316 -55,316 -0.6% 6.0% 6.0% $4.09 0 0 0 Northeast Warehouse & Distribution 6,086,164 -14,030 -14,030 -0.2% 1.4% 1.7% $5.88 0 0 0 Manufacturing 6,880,307 -21,260 -21,260 -0.3% 2.7% 2.7% $4.98 0 0 0 Total 12,966,471 -35,290 -35,290 -0.3% 2.1% 2.2% $5.21 0 0 0 Northwest Warehouse & Distribution 10,461,189 103,167 103,167 1.0% 5.0% 6.0% $6.59 0 0 0 Manufacturing 3,153,030 0 0 0.0% 1.5% 1.5% $0.00 0 0 0 Total 13,614,219 103,167 103,167 0.8% 4.2% 5.0% $6.59 0 0 0 South Warehouse & Distribution 5,565,702 -118,242 -118,242 -2.1% 8.1% 8.1% $5.91 0 0 0 Manufacturing 7,927,472 0 0 0.0% 4.0% 5.1% $5.89 0 0 0 Total 13,493,174 -118,242 -118,242 -0.9% 5.7% 6.3% $5.90 0 0 0 Washington County Warehouse & Distribution 6,613,888 55,341 55,341 0.8% 10.3% 12.0% $5.50 0 0 250,000 Manufacturing 4,736,380 7,450 7,450 0.2% 1.4% 1.4% $5.20 0 0 0 Total 11,350,268 62,791 62,791 0.6% 6.6% 7.7% $5.47 0 0 250,000 West Warehouse & Distribution 14,015,237 252,009 252,009 1.8% 3.9% 3.9% $7.16 100,000 100,000 758,817 Manufacturing 2,706,639 8,750 8,750 0.3% 4.1% 6.5% $5.71 0 0 70,873 Total 16,721,876 260,759 260,759 1.6% 4.0% 4.4% $7.00 100,000 100,000 829,690 Westmoreland County Warehouse & Distribution 14,569,229 432,674 432,674 3.0% 6.7% 7.5% $5.38 0 0 500,232 Manufacturing 12,414,676 232,720 232,720 1.9% 12.1% 12.1% $4.78 0 0 0 Total 26,983,905 665,394 665,394 2.5% 9.2% 9.6% $4.99 0 0 500,232 Inventory (s.f.) Quarterly total net absorption (s.f.) YTD total net absorption (s.f.) YTD total net absorption (% of stock) Total vacancy (%) Total availability (%) Average total asking rent ($ p.s.f.) Quarterly Completions (s.f.) YTD Completions (s.f.) Under construction (s.f.) Pittsburgh total Warehouse & Distribution 91,451,141 575,925 575,925 0.6% 6.2% 6.9% $6.12 100,000 100,000 1,614,049 Manufacturing 54,020,037 220,160 220,160 0.4% 5.9% 6.2% $4.67 0 0 70,873 Overall Total 145,471,178 796,085 796,085 0.5% 6.1% 6.6% $5.51 100,000 100,000 1,684,922 Beaver County Warehouse & Distribution 5,627,234 -78,120 -78,120 -1.4% 12.4% 14.3% $5.34 0 0 105,000 Manufacturing 4,358,833 0 0 0.0% 8.8% 8.8% $4.14 0 0 0 Total 9,986,067 -78,120 -78,120 -0.8% 10.8% 11.9% $4.79 0 0 105,000 Butler County Warehouse & Distribution 4,136,199 0 0 0.0% 12.2% 12.2% $5.14 0 0 0 Manufacturing 3,561,575 0 0 0.0% 8.5% 8.5% $3.61 0 0 0 Total 7,697,774 0 0 0.0% 10.5% 10.5% $4.51 0 0 0 Downtown Warehouse & Distribution 18,369,849 -9,058 -9,058 0.0% 4.7% 5.3% $9.25 0 0 0 Manufacturing 4,643,481 0 0 0.0% 1.0% 1.0% $6.24 0 0 0 Total 23,013,330 -9,058 -9,058 0.0% 4.0% 4.4% $9.06 0 0 0 East Warehouse & Distribution 6,006,450 -47,816 -47,816 -0.8% 6.2% 6.2% $5.43 0 0 0 Manufacturing 3,637,644 -7,500 -7,500 -0.2% 5.7% 5.7% $3.56 0 0 0 Total 9,644,094 -55,316 -55,316 -0.6% 6.0% 6.0% $4.09 0 0 0 Northeast Warehouse & Distribution 6,086,164 -14,030 -14,030 -0.2% 1.4% 1.7% $5.88 0 0 0 Manufacturing 6,880,307 -21,260 -21,260 -0.3% 2.7% 2.7% $4.98 0 0 0 Total 12,966,471 -35,290 -35,290 -0.3% 2.1% 2.2% $5.21 0 0 0 Northwest Warehouse & Distribution 10,461,189 103,167 103,167 1.0% 5.0% 6.0% $6.59 0 0 0 Manufacturing 3,153,030 0 0 0.0% 1.5% 1.5% $0.00 0 0 0 Total 13,614,219 103,167 103,167 0.8% 4.2% 5.0% $6.59 0 0 0 South Warehouse & Distribution 5,565,702 -118,242 -118,242 -2.1% 8.1% 8.1% $5.91 0 0 0 Manufacturing 7,927,472 0 0 0.0% 4.0% 5.1% $5.89 0 0 0 Total 13,493,174 -118,242 -118,242 -0.9% 5.7% 6.3% $5.90 0 0 0 Washington County Warehouse & Distribution 6,613,888 55,341 55,341 0.8% 10.3% 12.0% $5.50 0 0 250,000 Manufacturing 4,736,380 7,450 7,450 0.2% 1.4% 1.4% $5.20 0 0 0 Total 11,350,268 62,791 62,791 0.6% 6.6% 7.7% $5.47 0 0 250,000 West Warehouse & Distribution 14,015,237 252,009 252,009 1.8% 3.9% 3.9% $7.16 100,000 100,000 758,817 Manufacturing 2,706,639 8,750 8,750 0.3% 4.1% 6.5% $5.71 0 0 70,873 Total 16,721,876 260,759 260,759 1.6% 4.0% 4.4% $7.00 100,000 100,000 829,690 Westmoreland County Warehouse & Distribution 14,569,229 432,674 432,674 3.0% 6.7% 7.5% $5.38 0 0 500,232 Manufacturing 12,414,676 232,720 232,720 1.9% 12.1% 12.1% $4.78 0 0 0 Total 26,983,905 665,394 665,394 2.5% 9.2% 9.6% $4.99 0 0 500,232 For more information, contact: Tobiah Bilski| tobiah.bilski@am.jll.com Pittsburgh Industrial Statistics | Q1 2021