SlideShare a Scribd company logo
1 of 2
Download to read offline
© 2019 Jones Lang LaSalle IP, Inc. All rights reserved. All information contained herein is from sources deemed reliable; however, no representation or warranty is made to the accuracy thereof.
Q2 2019
Detroit
Office Insight
The second quarter in the Detroit office market brought a decrease in vacancy
and continued rent growth. Total vacancy across the market is currently at
18.5 percent, while average asking rents are $19.85 per square foot,
representing a 2.1 percent increase year-over-year. UBS opened their
downtown office in April, occupying 11,000 square feet in a Bedrock owned
building at 1523 Woodward, while IBM announced they will occupy
approximately 10,000 square feet at Ally Detroit Center later this year. In the
suburbs, Northwestern Technological Institute leased 33,650 square feet at
Northwestern Corporate Center in Southfield, while Success Mortgage signed
a 13,478-square-foot lease at Laurel Office Park in Livonia.
Google made headlines with news of a $17.0 million expansion effort in both
Detroit and Ann Arbor, where their total footprint will grow to combined
210,000 square feet. Northfield Office Park in Troy sold to New York-based
Group RMC for $12.2 million, approximately $52 per square foot, while Time
Equities purchased a pair of downtown buildings totaling 87,735 square feet
for $5.9 million, or roughly $67 per square foot. Also downtown, Bedrock
bought the long-vacant 55,000-square-foot Fowler Building at 1225
Woodward for an undisclosed price, with renovation work beginning
immediately.
Outlook
Fundamentals remain strong in the market, and vacancies will continue to
compress while rent growth will keep its slow and steady pace. Keep an eye
on the big developments downtown and if there is any preleasing activity, it
will be interesting to see what rents are achieved at these new developments.
New Center and Corktown will be submarkets to watch as the CBD submarket
gets tighter and more expensive for tenants.
Fundamentals Forecast
YTD net absorption 752,006 s.f. ▲
Under construction 1,553,000 s.f. ▲
Total vacancy 18.5 % ▼
Average asking rent (gross) $19.85 p.s.f. ▲
Concessions Falling ▼
-500,000
0
500,000
1,000,000
2016 2017 2018 YTD
Supply and demand (s.f.) Net absorption
Deliveries
Detroit office market maintains steady pace
21.0%
19.8%
20.2%
18.5%
2016 2017 2018 YTD
Total vacancy
$10.00
$20.00
$30.00
2016 2017 2018 YTD
Average asking rents ($/s.f.) Class A
Class B
For more information, contact: Harrison West | harrison.west@am.jll.com
• UBS opened their downtown office at 1523 Woodward, where they
occupy 11,000 square feet.
• Google plans to invest $17.0 million to expand their southeast Michigan
footprint to 210,000 square feet.
• Total vacancy across the market is currently at 18.5 percent, while
average asking rents are $19.85 per square foot, representing a 2.1
percent increase year-over-year.
© 2019 Jones Lang LaSalle IP, Inc. All rights reserved. All information contained herein is from sources deemed reliable; however, no representation or warranty is made to the accuracy thereof.
Q2 2019
Office Statistics
Detroit
For more information, contact: Harrison West | harrison.west@am.jll.com
Class
Inventory
(s.f.)
Total net
absorption
(s.f.)
YTD total net
absorption
(s.f.)
YTD total net
absorption (%
of stock)
Direct
vacancy (%)
Total
vacancy (%)
Average
direct asking
rent ($ p.s.f.)
YTD
Completions
(s.f.)
Under
Development
(s.f.)
Birmingham/Bloomfield Totals 3,979,668 31,967 59,640 1.5% 17.0% 17.4% $26.68 0 0
Dearborn Totals 2,855,625 16,229 239,497 8.4% 19.9% 20.1% $17.12 150,000 0
Downriver Totals 483,907 0 123,243 25.5% 12.9% 12.9% $14.06 0 0
Farmington/Farmington Hills Totals 4,658,516 98,898 99,877 2.1% 15.0% 16.2% $18.53 0 0
Macomb Totals 1,333,505 87,402 31,175 2.3% 9.2% 9.5% $16.62 0 0
North Oakland Totals 2,260,888 24,682 36,760 1.6% 14.5% 14.9% $18.55 0 0
Northern I-275 Corridor Totals 4,467,691 21,173 -105,663 -2.4% 12.3% 13.1% $19.53 0 0
Royal Oak / SE Oakland Totals 837,998 58,297 68,096 8.1% 3.7% 3.7% $19.53 55,000 0
Southern I-275 Corridor Totals 1,077,525 7,217 -1,708 -0.2% 1.4% 27.5% $17.50 0 0
Southfield Totals 12,945,449 -31,294 -23,466 -0.2% 26.6% 28.5% $17.96 0 0
Troy Totals 11,003,062 10,718 81,542 0.7% 20.0% 22.7% $19.00 0 0
Washtenaw Totals 6,698,612 -184,470 19,955 0.3% 5.7% 9.6% $25.92 0 30,000
Suburbs Totals 52,602,446 140,819 628,948 1.2% 17.3% 19.6% $19.37 205,000 30,000
CBD Totals 13,477,209 30,667 86,399 0.6% 13.0% 14.4% $22.76 0 1,523,000
New Center Totals 1,486,775 -294 36,659 2.5% 15.6% 15.7% $21.47 0 0
Urban Totals 14,963,984 30,373 123,058 0.8% 13.3% 14.5% $22.56 0 1,523,000
Detroit Totals 67,566,430 171,192 752,006 1.1% 16.4% 18.5% $19.85 205,000 1,553,000
Birmingham/Bloomfield A 1,569,497 5,060 11,428 0.7% 25.4% 26.1% $28.63 0 0
Dearborn A 596,890 0 150,000 25.1% 0.8% 0.8% $25.00 150,000 0
Farmington/Farmington Hills A 618,109 0 21,609 3.5% 4.6% 4.6% $22.50 0 0
Macomb A 295,494 0 4,595 1.6% 2.1% 2.1% $19.12 0 0
North Oakland A 541,905 3,091 4,686 0.9% 14.5% 14.5% $21.20 0 0
Northern I-275 Corridor A 1,187,841 17,801 18,502 1.6% 8.7% 8.7% $19.57 0 0
Royal Oak / SE Oakland A 131,288 55,000 49,996 38.1% 3.8% 3.8% $30.00 55,000 0
Southern I-275 Corridor A 832,753 10,217 19,153 2.3% 0.0% 33.1% $0.00 0 0
Southfield A 2,970,217 4,063 -8,303 -0.3% 25.0% 27.3% $20.91 0 0
Troy A 1,924,131 -27,764 -16,296 -0.8% 11.4% 16.3% $25.82 0 0
Washtenaw A 3,278,983 -216,818 -87,512 -2.7% 4.0% 11.5% $32.72 0 30,000
Suburbs A 13,947,108 -149,350 167,858 1.2% 12.3% 17.3% $24.19 205,000 30,000
CBD A 6,354,714 25,342 18,250 0.3% 8.3% 10.7% $25.52 0 1,523,000
Urban A 6,354,714 25,342 18,250 0.3% 8.3% 10.7% $25.52 0 1,523,000
Detroit A 20,301,822 -124,008 186,108 0.9% 11.1% 15.2% $24.49 205,000 1,553,000
Birmingham/Bloomfield B 2,410,171 26,907 48,212 2.0% 11.6% 11.7% $23.87 0 0
Dearborn B 2,258,735 16,229 89,497 4.0% 24.9% 25.2% $17.04 0 0
Downriver B 483,907 0 123,243 25.5% 12.9% 12.9% $14.06 0 0
Farmington/Farmington Hills B 4,040,407 98,898 78,268 1.9% 16.6% 18.0% $18.35 0 0
Macomb B 991,381 87,402 26,580 2.7% 11.7% 12.1% $16.48 0 0
North Oakland B 1,718,983 21,591 32,074 1.9% 14.5% 15.0% $17.71 0 0
Northern I-275 Corridor B 3,279,850 3,372 -124,165 -3.8% 13.5% 14.8% $19.53 0 0
Royal Oak / SE Oakland B 706,710 3,297 18,100 2.6% 3.7% 3.7% $17.79 0 0
Southern I-275 Corridor B 244,772 -3,000 -20,861 -8.5% 6.2% 8.5% $17.50 0 0
Southfield B 9,975,232 -35,357 -15,163 -0.2% 27.1% 28.9% $17.01 0 0
Troy B 9,078,931 38,482 97,838 1.1% 21.8% 24.1% $18.28 0 0
Washtenaw B 3,419,629 32,348 107,467 3.1% 7.4% 7.7% $22.65 0 0
Suburbs B 38,608,708 290,169 461,090 1.2% 19.1% 20.4% $18.21 0 0
CBD B 7,122,495 5,325 68,149 1.0% 17.2% 17.7% $21.08 0 0
New Center B 1,486,775 -294 36,659 2.5% 15.6% 15.7% $21.47 0 0
Urban B 8,609,270 5,031 104,808 1.2% 16.9% 17.4% $21.16 0 0
Detroit B 47,217,978 295,200 565,898 1.2% 18.7% 19.9% $18.59 0 0

More Related Content

What's hot

JLL Pittsburgh Office Outlook - Q4 2015
JLL Pittsburgh Office Outlook - Q4 2015JLL Pittsburgh Office Outlook - Q4 2015
JLL Pittsburgh Office Outlook - Q4 2015Andrew Batson
 
JLL Cleveland Office Outlook: Q2 2018
JLL Cleveland Office Outlook: Q2 2018JLL Cleveland Office Outlook: Q2 2018
JLL Cleveland Office Outlook: Q2 2018Andrew Batson
 
JLL Cincinnati Office Insight & Statistics - Q2 2016
JLL Cincinnati Office Insight & Statistics - Q2 2016JLL Cincinnati Office Insight & Statistics - Q2 2016
JLL Cincinnati Office Insight & Statistics - Q2 2016Ross Bratcher
 
JLL Cleveland Office Outlook: Q3 2017
JLL Cleveland Office Outlook: Q3 2017JLL Cleveland Office Outlook: Q3 2017
JLL Cleveland Office Outlook: Q3 2017Andrew Batson
 
JLL Cleveland Office Outlook: Q3 2018
JLL Cleveland Office Outlook: Q3 2018JLL Cleveland Office Outlook: Q3 2018
JLL Cleveland Office Outlook: Q3 2018Andrew Batson
 
JLL Grand Rapids Office Insight & Statistics - Q3 2019
JLL Grand Rapids Office Insight & Statistics - Q3 2019JLL Grand Rapids Office Insight & Statistics - Q3 2019
JLL Grand Rapids Office Insight & Statistics - Q3 2019Harrison West
 
JLL Cleveland Office Outlook: Q2 2018
JLL Cleveland Office Outlook: Q2 2018JLL Cleveland Office Outlook: Q2 2018
JLL Cleveland Office Outlook: Q2 2018Andrew Batson
 
Jll cincinnati office outlook q2 2017
Jll cincinnati office outlook   q2 2017Jll cincinnati office outlook   q2 2017
Jll cincinnati office outlook q2 2017Abby Armbruster
 
JLL Cleveland Office Outlook: Q4 2020
JLL Cleveland Office Outlook: Q4 2020JLL Cleveland Office Outlook: Q4 2020
JLL Cleveland Office Outlook: Q4 2020Andrew Batson
 
JLL Cleveland Office Outlook: Q3 2019
JLL Cleveland Office Outlook: Q3 2019JLL Cleveland Office Outlook: Q3 2019
JLL Cleveland Office Outlook: Q3 2019Johnathan Miller
 
JLL Columbus Office Outlook Q1 2021
JLL Columbus Office Outlook Q1 2021JLL Columbus Office Outlook Q1 2021
JLL Columbus Office Outlook Q1 2021SamStouffer
 
JLL Cleveland Office Outlook: Q4 2017
JLL Cleveland Office Outlook: Q4 2017JLL Cleveland Office Outlook: Q4 2017
JLL Cleveland Office Outlook: Q4 2017Andrew Batson
 
JLL Dayton Office Report Summer 2020
JLL Dayton Office Report Summer 2020JLL Dayton Office Report Summer 2020
JLL Dayton Office Report Summer 2020Abby Armbruster
 
JLL Cleveland Office Outlook: Q1 2018
JLL Cleveland Office Outlook: Q1 2018JLL Cleveland Office Outlook: Q1 2018
JLL Cleveland Office Outlook: Q1 2018Andrew Batson
 
JLL Cleveland Office Outlook: Q1 2017
JLL Cleveland Office Outlook: Q1 2017JLL Cleveland Office Outlook: Q1 2017
JLL Cleveland Office Outlook: Q1 2017Andrew Batson
 
JLL Cleveland Office Outlook: Q1 2018
JLL Cleveland Office Outlook: Q1 2018JLL Cleveland Office Outlook: Q1 2018
JLL Cleveland Office Outlook: Q1 2018Andrew Batson
 
JLL Cleveland Office Outlook: Q1 2018
JLL Cleveland Office Outlook: Q1 2018JLL Cleveland Office Outlook: Q1 2018
JLL Cleveland Office Outlook: Q1 2018Andrew Batson
 
JLL Grand Rapids Office Insight & Statistics - Q2 2018
JLL Grand Rapids Office Insight & Statistics - Q2 2018JLL Grand Rapids Office Insight & Statistics - Q2 2018
JLL Grand Rapids Office Insight & Statistics - Q2 2018Harrison West
 
JLL Louisville Office Insight & Statistics - Q4 2016
JLL Louisville Office Insight & Statistics -  Q4 2016JLL Louisville Office Insight & Statistics -  Q4 2016
JLL Louisville Office Insight & Statistics - Q4 2016Ross Bratcher
 
JLL Ann Arbor Office Insight & Statistics - Spring 2018
JLL Ann Arbor Office Insight & Statistics - Spring 2018JLL Ann Arbor Office Insight & Statistics - Spring 2018
JLL Ann Arbor Office Insight & Statistics - Spring 2018Harrison West
 

What's hot (20)

JLL Pittsburgh Office Outlook - Q4 2015
JLL Pittsburgh Office Outlook - Q4 2015JLL Pittsburgh Office Outlook - Q4 2015
JLL Pittsburgh Office Outlook - Q4 2015
 
JLL Cleveland Office Outlook: Q2 2018
JLL Cleveland Office Outlook: Q2 2018JLL Cleveland Office Outlook: Q2 2018
JLL Cleveland Office Outlook: Q2 2018
 
JLL Cincinnati Office Insight & Statistics - Q2 2016
JLL Cincinnati Office Insight & Statistics - Q2 2016JLL Cincinnati Office Insight & Statistics - Q2 2016
JLL Cincinnati Office Insight & Statistics - Q2 2016
 
JLL Cleveland Office Outlook: Q3 2017
JLL Cleveland Office Outlook: Q3 2017JLL Cleveland Office Outlook: Q3 2017
JLL Cleveland Office Outlook: Q3 2017
 
JLL Cleveland Office Outlook: Q3 2018
JLL Cleveland Office Outlook: Q3 2018JLL Cleveland Office Outlook: Q3 2018
JLL Cleveland Office Outlook: Q3 2018
 
JLL Grand Rapids Office Insight & Statistics - Q3 2019
JLL Grand Rapids Office Insight & Statistics - Q3 2019JLL Grand Rapids Office Insight & Statistics - Q3 2019
JLL Grand Rapids Office Insight & Statistics - Q3 2019
 
JLL Cleveland Office Outlook: Q2 2018
JLL Cleveland Office Outlook: Q2 2018JLL Cleveland Office Outlook: Q2 2018
JLL Cleveland Office Outlook: Q2 2018
 
Jll cincinnati office outlook q2 2017
Jll cincinnati office outlook   q2 2017Jll cincinnati office outlook   q2 2017
Jll cincinnati office outlook q2 2017
 
JLL Cleveland Office Outlook: Q4 2020
JLL Cleveland Office Outlook: Q4 2020JLL Cleveland Office Outlook: Q4 2020
JLL Cleveland Office Outlook: Q4 2020
 
JLL Cleveland Office Outlook: Q3 2019
JLL Cleveland Office Outlook: Q3 2019JLL Cleveland Office Outlook: Q3 2019
JLL Cleveland Office Outlook: Q3 2019
 
JLL Columbus Office Outlook Q1 2021
JLL Columbus Office Outlook Q1 2021JLL Columbus Office Outlook Q1 2021
JLL Columbus Office Outlook Q1 2021
 
JLL Cleveland Office Outlook: Q4 2017
JLL Cleveland Office Outlook: Q4 2017JLL Cleveland Office Outlook: Q4 2017
JLL Cleveland Office Outlook: Q4 2017
 
JLL Dayton Office Report Summer 2020
JLL Dayton Office Report Summer 2020JLL Dayton Office Report Summer 2020
JLL Dayton Office Report Summer 2020
 
JLL Cleveland Office Outlook: Q1 2018
JLL Cleveland Office Outlook: Q1 2018JLL Cleveland Office Outlook: Q1 2018
JLL Cleveland Office Outlook: Q1 2018
 
JLL Cleveland Office Outlook: Q1 2017
JLL Cleveland Office Outlook: Q1 2017JLL Cleveland Office Outlook: Q1 2017
JLL Cleveland Office Outlook: Q1 2017
 
JLL Cleveland Office Outlook: Q1 2018
JLL Cleveland Office Outlook: Q1 2018JLL Cleveland Office Outlook: Q1 2018
JLL Cleveland Office Outlook: Q1 2018
 
JLL Cleveland Office Outlook: Q1 2018
JLL Cleveland Office Outlook: Q1 2018JLL Cleveland Office Outlook: Q1 2018
JLL Cleveland Office Outlook: Q1 2018
 
JLL Grand Rapids Office Insight & Statistics - Q2 2018
JLL Grand Rapids Office Insight & Statistics - Q2 2018JLL Grand Rapids Office Insight & Statistics - Q2 2018
JLL Grand Rapids Office Insight & Statistics - Q2 2018
 
JLL Louisville Office Insight & Statistics - Q4 2016
JLL Louisville Office Insight & Statistics -  Q4 2016JLL Louisville Office Insight & Statistics -  Q4 2016
JLL Louisville Office Insight & Statistics - Q4 2016
 
JLL Ann Arbor Office Insight & Statistics - Spring 2018
JLL Ann Arbor Office Insight & Statistics - Spring 2018JLL Ann Arbor Office Insight & Statistics - Spring 2018
JLL Ann Arbor Office Insight & Statistics - Spring 2018
 

Similar to JLL Detroit Office Insight & Statistics - Q2 2019

JLL Detroit Office Insight & Statistics - Q4 2017
JLL Detroit Office Insight & Statistics - Q4 2017JLL Detroit Office Insight & Statistics - Q4 2017
JLL Detroit Office Insight & Statistics - Q4 2017Harrison West
 
JLL Detroit Office Insight & Statistics - Q3 2019
JLL Detroit Office Insight & Statistics - Q3 2019JLL Detroit Office Insight & Statistics - Q3 2019
JLL Detroit Office Insight & Statistics - Q3 2019Harrison West
 
JLL Detroit Office Insight & Statistics - Q3 2018
JLL Detroit Office Insight & Statistics - Q3 2018JLL Detroit Office Insight & Statistics - Q3 2018
JLL Detroit Office Insight & Statistics - Q3 2018Harrison West
 
JLL Detroit Office Insight & Statistics - Q4 2018
JLL Detroit Office Insight & Statistics - Q4 2018JLL Detroit Office Insight & Statistics - Q4 2018
JLL Detroit Office Insight & Statistics - Q4 2018Harrison West
 
JLL Detroit Office Insight & Statistics - Q4 2019
JLL Detroit Office Insight & Statistics - Q4 2019JLL Detroit Office Insight & Statistics - Q4 2019
JLL Detroit Office Insight & Statistics - Q4 2019Harrison West
 
JLL Detroit Office Outlook: Q4 2015
JLL Detroit Office Outlook: Q4 2015JLL Detroit Office Outlook: Q4 2015
JLL Detroit Office Outlook: Q4 2015Aaron Moore
 
JLL Cincinnati Office Outlook Q4 2020
JLL Cincinnati Office Outlook Q4 2020JLL Cincinnati Office Outlook Q4 2020
JLL Cincinnati Office Outlook Q4 2020Abby Armbruster
 
JLL Pittsburgh Office Insight & Statistics - Q1 2020
JLL Pittsburgh Office Insight & Statistics - Q1 2020JLL Pittsburgh Office Insight & Statistics - Q1 2020
JLL Pittsburgh Office Insight & Statistics - Q1 2020Tobiah Bilski
 
JLL Cleveland Industrial Outlook: Q1 2017
JLL Cleveland Industrial Outlook: Q1 2017JLL Cleveland Industrial Outlook: Q1 2017
JLL Cleveland Industrial Outlook: Q1 2017Andrew Batson
 
JLL Cleveland Industrial Outlook: Q3 2018
JLL Cleveland Industrial Outlook: Q3 2018JLL Cleveland Industrial Outlook: Q3 2018
JLL Cleveland Industrial Outlook: Q3 2018Andrew Batson
 
JLL Cleveland Industrial Outlook: Q4 2018
JLL Cleveland Industrial Outlook: Q4 2018JLL Cleveland Industrial Outlook: Q4 2018
JLL Cleveland Industrial Outlook: Q4 2018Andrew Batson
 
JLL Cleveland Industrial Outlook: Q4 2018
JLL Cleveland Industrial Outlook: Q4 2018JLL Cleveland Industrial Outlook: Q4 2018
JLL Cleveland Industrial Outlook: Q4 2018Andrew Batson
 
JLL Grand Rapids Office Insight & Statistics - Q3 2018
JLL Grand Rapids Office Insight & Statistics - Q3 2018JLL Grand Rapids Office Insight & Statistics - Q3 2018
JLL Grand Rapids Office Insight & Statistics - Q3 2018Harrison West
 
JLL Louisville Office Outlook - Q3 2018
JLL Louisville Office Outlook - Q3 2018JLL Louisville Office Outlook - Q3 2018
JLL Louisville Office Outlook - Q3 2018Alex Westcott
 
JLL Cincinnati Office Outlook Q2 2020
JLL Cincinnati Office Outlook Q2 2020JLL Cincinnati Office Outlook Q2 2020
JLL Cincinnati Office Outlook Q2 2020Abby Armbruster
 
JLL Pittsburgh Industrial Insight & Statistics - Q2 2018
JLL Pittsburgh Industrial Insight & Statistics - Q2 2018JLL Pittsburgh Industrial Insight & Statistics - Q2 2018
JLL Pittsburgh Industrial Insight & Statistics - Q2 2018Tobiah Bilski
 
JLL Grand Rapids Office Insight & Statistics - Q4 2019
JLL Grand Rapids Office Insight & Statistics - Q4 2019JLL Grand Rapids Office Insight & Statistics - Q4 2019
JLL Grand Rapids Office Insight & Statistics - Q4 2019Harrison West
 
JLL Cleveland Industrial Outlook: Q4 2020
JLL Cleveland Industrial Outlook: Q4 2020JLL Cleveland Industrial Outlook: Q4 2020
JLL Cleveland Industrial Outlook: Q4 2020Andrew Batson
 
JLL Downtown Chicago Office Market Update - Q3 2016
JLL Downtown Chicago Office Market Update - Q3 2016JLL Downtown Chicago Office Market Update - Q3 2016
JLL Downtown Chicago Office Market Update - Q3 2016Hailey Harrington
 
JLL Pittsburgh Office Insight & Statistics - Q4 2018
JLL Pittsburgh Office Insight & Statistics - Q4 2018JLL Pittsburgh Office Insight & Statistics - Q4 2018
JLL Pittsburgh Office Insight & Statistics - Q4 2018Tobiah Bilski
 

Similar to JLL Detroit Office Insight & Statistics - Q2 2019 (20)

JLL Detroit Office Insight & Statistics - Q4 2017
JLL Detroit Office Insight & Statistics - Q4 2017JLL Detroit Office Insight & Statistics - Q4 2017
JLL Detroit Office Insight & Statistics - Q4 2017
 
JLL Detroit Office Insight & Statistics - Q3 2019
JLL Detroit Office Insight & Statistics - Q3 2019JLL Detroit Office Insight & Statistics - Q3 2019
JLL Detroit Office Insight & Statistics - Q3 2019
 
JLL Detroit Office Insight & Statistics - Q3 2018
JLL Detroit Office Insight & Statistics - Q3 2018JLL Detroit Office Insight & Statistics - Q3 2018
JLL Detroit Office Insight & Statistics - Q3 2018
 
JLL Detroit Office Insight & Statistics - Q4 2018
JLL Detroit Office Insight & Statistics - Q4 2018JLL Detroit Office Insight & Statistics - Q4 2018
JLL Detroit Office Insight & Statistics - Q4 2018
 
JLL Detroit Office Insight & Statistics - Q4 2019
JLL Detroit Office Insight & Statistics - Q4 2019JLL Detroit Office Insight & Statistics - Q4 2019
JLL Detroit Office Insight & Statistics - Q4 2019
 
JLL Detroit Office Outlook: Q4 2015
JLL Detroit Office Outlook: Q4 2015JLL Detroit Office Outlook: Q4 2015
JLL Detroit Office Outlook: Q4 2015
 
JLL Cincinnati Office Outlook Q4 2020
JLL Cincinnati Office Outlook Q4 2020JLL Cincinnati Office Outlook Q4 2020
JLL Cincinnati Office Outlook Q4 2020
 
JLL Pittsburgh Office Insight & Statistics - Q1 2020
JLL Pittsburgh Office Insight & Statistics - Q1 2020JLL Pittsburgh Office Insight & Statistics - Q1 2020
JLL Pittsburgh Office Insight & Statistics - Q1 2020
 
JLL Cleveland Industrial Outlook: Q1 2017
JLL Cleveland Industrial Outlook: Q1 2017JLL Cleveland Industrial Outlook: Q1 2017
JLL Cleveland Industrial Outlook: Q1 2017
 
JLL Cleveland Industrial Outlook: Q3 2018
JLL Cleveland Industrial Outlook: Q3 2018JLL Cleveland Industrial Outlook: Q3 2018
JLL Cleveland Industrial Outlook: Q3 2018
 
JLL Cleveland Industrial Outlook: Q4 2018
JLL Cleveland Industrial Outlook: Q4 2018JLL Cleveland Industrial Outlook: Q4 2018
JLL Cleveland Industrial Outlook: Q4 2018
 
JLL Cleveland Industrial Outlook: Q4 2018
JLL Cleveland Industrial Outlook: Q4 2018JLL Cleveland Industrial Outlook: Q4 2018
JLL Cleveland Industrial Outlook: Q4 2018
 
JLL Grand Rapids Office Insight & Statistics - Q3 2018
JLL Grand Rapids Office Insight & Statistics - Q3 2018JLL Grand Rapids Office Insight & Statistics - Q3 2018
JLL Grand Rapids Office Insight & Statistics - Q3 2018
 
JLL Louisville Office Outlook - Q3 2018
JLL Louisville Office Outlook - Q3 2018JLL Louisville Office Outlook - Q3 2018
JLL Louisville Office Outlook - Q3 2018
 
JLL Cincinnati Office Outlook Q2 2020
JLL Cincinnati Office Outlook Q2 2020JLL Cincinnati Office Outlook Q2 2020
JLL Cincinnati Office Outlook Q2 2020
 
JLL Pittsburgh Industrial Insight & Statistics - Q2 2018
JLL Pittsburgh Industrial Insight & Statistics - Q2 2018JLL Pittsburgh Industrial Insight & Statistics - Q2 2018
JLL Pittsburgh Industrial Insight & Statistics - Q2 2018
 
JLL Grand Rapids Office Insight & Statistics - Q4 2019
JLL Grand Rapids Office Insight & Statistics - Q4 2019JLL Grand Rapids Office Insight & Statistics - Q4 2019
JLL Grand Rapids Office Insight & Statistics - Q4 2019
 
JLL Cleveland Industrial Outlook: Q4 2020
JLL Cleveland Industrial Outlook: Q4 2020JLL Cleveland Industrial Outlook: Q4 2020
JLL Cleveland Industrial Outlook: Q4 2020
 
JLL Downtown Chicago Office Market Update - Q3 2016
JLL Downtown Chicago Office Market Update - Q3 2016JLL Downtown Chicago Office Market Update - Q3 2016
JLL Downtown Chicago Office Market Update - Q3 2016
 
JLL Pittsburgh Office Insight & Statistics - Q4 2018
JLL Pittsburgh Office Insight & Statistics - Q4 2018JLL Pittsburgh Office Insight & Statistics - Q4 2018
JLL Pittsburgh Office Insight & Statistics - Q4 2018
 

Recently uploaded

The Omaxe State Dwarka Delhi-broucher.pdf.pdf
The Omaxe State Dwarka Delhi-broucher.pdf.pdfThe Omaxe State Dwarka Delhi-broucher.pdf.pdf
The Omaxe State Dwarka Delhi-broucher.pdf.pdfkratirudram
 
Call Girls in Janakpuri ↫8447779280↫Short 1500 Night 6000-Escorts Service In ...
Call Girls in Janakpuri ↫8447779280↫Short 1500 Night 6000-Escorts Service In ...Call Girls in Janakpuri ↫8447779280↫Short 1500 Night 6000-Escorts Service In ...
Call Girls in Janakpuri ↫8447779280↫Short 1500 Night 6000-Escorts Service In ...asmaqueen5
 
How to Build Multifamily and Laneway Suites in Toronto!! (feat. Expert Archi...
How to Build Multifamily and Laneway Suites  in Toronto!! (feat. Expert Archi...How to Build Multifamily and Laneway Suites  in Toronto!! (feat. Expert Archi...
How to Build Multifamily and Laneway Suites in Toronto!! (feat. Expert Archi...Volition Properties
 
Puravankara Mundhwa Pune E-Brochure.pdf
Puravankara Mundhwa Pune  E-Brochure.pdfPuravankara Mundhwa Pune  E-Brochure.pdf
Puravankara Mundhwa Pune E-Brochure.pdfManishSaxena95
 
Call Girls in Model Town Delhi 💯Call Us 🔝8264348440🔝
Call Girls in Model Town Delhi 💯Call Us 🔝8264348440🔝Call Girls in Model Town Delhi 💯Call Us 🔝8264348440🔝
Call Girls in Model Town Delhi 💯Call Us 🔝8264348440🔝soniya singh
 
9990771857 Call Girls in Noida Sector 1 Noida (Call Girls) Delhi
9990771857 Call Girls in Noida Sector 1 Noida (Call Girls) Delhi9990771857 Call Girls in Noida Sector 1 Noida (Call Girls) Delhi
9990771857 Call Girls in Noida Sector 1 Noida (Call Girls) Delhidelhimodel235
 
Call Girls in Sarai Kale Khan Delhi 💯Call Us 🔝8264348440🔝
Call Girls in Sarai Kale Khan Delhi 💯Call Us 🔝8264348440🔝Call Girls in Sarai Kale Khan Delhi 💯Call Us 🔝8264348440🔝
Call Girls in Sarai Kale Khan Delhi 💯Call Us 🔝8264348440🔝soniya singh
 
Low Rate Call Girls in Tughlakabad Delhi Call 9990771857
Low Rate Call Girls in Tughlakabad Delhi Call 9990771857Low Rate Call Girls in Tughlakabad Delhi Call 9990771857
Low Rate Call Girls in Tughlakabad Delhi Call 9990771857delhimodel235
 
Nanke Area Estate commercial ( Dir. Kat Kuo)
Nanke Area Estate commercial ( Dir. Kat Kuo)Nanke Area Estate commercial ( Dir. Kat Kuo)
Nanke Area Estate commercial ( Dir. Kat Kuo)jessica288382
 
Listing Turkey Sylvana Istanbul - Bahcesehir
Listing Turkey Sylvana Istanbul - BahcesehirListing Turkey Sylvana Istanbul - Bahcesehir
Listing Turkey Sylvana Istanbul - BahcesehirListing Turkey
 
Building Dreams: Newman Leech's Visionary Approach to Real Estate Investment
Building Dreams: Newman Leech's Visionary Approach to Real Estate InvestmentBuilding Dreams: Newman Leech's Visionary Approach to Real Estate Investment
Building Dreams: Newman Leech's Visionary Approach to Real Estate InvestmentNewman George Leech
 
Call Girls In Hari Nagar Dadb Block {8447779280}Hari Nagar {West Delhi Escort...
Call Girls In Hari Nagar Dadb Block {8447779280}Hari Nagar {West Delhi Escort...Call Girls In Hari Nagar Dadb Block {8447779280}Hari Nagar {West Delhi Escort...
Call Girls In Hari Nagar Dadb Block {8447779280}Hari Nagar {West Delhi Escort...asmaqueen5
 
Aparna Greenscapes Kompally Hyderabad E - Brochure.pdf
Aparna Greenscapes Kompally Hyderabad E - Brochure.pdfAparna Greenscapes Kompally Hyderabad E - Brochure.pdf
Aparna Greenscapes Kompally Hyderabad E - Brochure.pdffaheemali990101
 
Low Rate Call Girls in Trilokpuri Delhi Call 9990771857
Low Rate Call Girls in Trilokpuri Delhi Call 9990771857Low Rate Call Girls in Trilokpuri Delhi Call 9990771857
Low Rate Call Girls in Trilokpuri Delhi Call 9990771857delhimodel235
 
9711199012 Call {Girls Delhi} Very Low rate Vaishali DownLoad PDF
9711199012 Call {Girls Delhi} Very Low rate Vaishali DownLoad PDF9711199012 Call {Girls Delhi} Very Low rate Vaishali DownLoad PDF
9711199012 Call {Girls Delhi} Very Low rate Vaishali DownLoad PDFMs Riya
 
Call Girls in Pitampura Delhi 💯Call Us 🔝8264348440🔝
Call Girls in Pitampura Delhi 💯Call Us 🔝8264348440🔝Call Girls in Pitampura Delhi 💯Call Us 🔝8264348440🔝
Call Girls in Pitampura Delhi 💯Call Us 🔝8264348440🔝soniya singh
 
Call Girls in Inderpuri Delhi 💯Call Us 🔝8264348440🔝
Call Girls in Inderpuri Delhi 💯Call Us 🔝8264348440🔝Call Girls in Inderpuri Delhi 💯Call Us 🔝8264348440🔝
Call Girls in Inderpuri Delhi 💯Call Us 🔝8264348440🔝soniya singh
 
Purva Palm Hills Devanahalli, Bangalore E- Brochure.pdf
Purva Palm Hills Devanahalli, Bangalore E- Brochure.pdfPurva Palm Hills Devanahalli, Bangalore E- Brochure.pdf
Purva Palm Hills Devanahalli, Bangalore E- Brochure.pdffaheemali990101
 

Recently uploaded (20)

The Omaxe State Dwarka Delhi-broucher.pdf.pdf
The Omaxe State Dwarka Delhi-broucher.pdf.pdfThe Omaxe State Dwarka Delhi-broucher.pdf.pdf
The Omaxe State Dwarka Delhi-broucher.pdf.pdf
 
Call Girls in Janakpuri ↫8447779280↫Short 1500 Night 6000-Escorts Service In ...
Call Girls in Janakpuri ↫8447779280↫Short 1500 Night 6000-Escorts Service In ...Call Girls in Janakpuri ↫8447779280↫Short 1500 Night 6000-Escorts Service In ...
Call Girls in Janakpuri ↫8447779280↫Short 1500 Night 6000-Escorts Service In ...
 
How to Build Multifamily and Laneway Suites in Toronto!! (feat. Expert Archi...
How to Build Multifamily and Laneway Suites  in Toronto!! (feat. Expert Archi...How to Build Multifamily and Laneway Suites  in Toronto!! (feat. Expert Archi...
How to Build Multifamily and Laneway Suites in Toronto!! (feat. Expert Archi...
 
Puravankara Mundhwa Pune E-Brochure.pdf
Puravankara Mundhwa Pune  E-Brochure.pdfPuravankara Mundhwa Pune  E-Brochure.pdf
Puravankara Mundhwa Pune E-Brochure.pdf
 
Call Girls in Model Town Delhi 💯Call Us 🔝8264348440🔝
Call Girls in Model Town Delhi 💯Call Us 🔝8264348440🔝Call Girls in Model Town Delhi 💯Call Us 🔝8264348440🔝
Call Girls in Model Town Delhi 💯Call Us 🔝8264348440🔝
 
9990771857 Call Girls in Noida Sector 1 Noida (Call Girls) Delhi
9990771857 Call Girls in Noida Sector 1 Noida (Call Girls) Delhi9990771857 Call Girls in Noida Sector 1 Noida (Call Girls) Delhi
9990771857 Call Girls in Noida Sector 1 Noida (Call Girls) Delhi
 
Call Girls in Sarai Kale Khan Delhi 💯Call Us 🔝8264348440🔝
Call Girls in Sarai Kale Khan Delhi 💯Call Us 🔝8264348440🔝Call Girls in Sarai Kale Khan Delhi 💯Call Us 🔝8264348440🔝
Call Girls in Sarai Kale Khan Delhi 💯Call Us 🔝8264348440🔝
 
Low Rate Call Girls in Triveni Complex Delhi Call 9873940964
Low Rate Call Girls in Triveni Complex Delhi Call 9873940964Low Rate Call Girls in Triveni Complex Delhi Call 9873940964
Low Rate Call Girls in Triveni Complex Delhi Call 9873940964
 
Low Rate Call Girls in Tughlakabad Delhi Call 9990771857
Low Rate Call Girls in Tughlakabad Delhi Call 9990771857Low Rate Call Girls in Tughlakabad Delhi Call 9990771857
Low Rate Call Girls in Tughlakabad Delhi Call 9990771857
 
Nanke Area Estate commercial ( Dir. Kat Kuo)
Nanke Area Estate commercial ( Dir. Kat Kuo)Nanke Area Estate commercial ( Dir. Kat Kuo)
Nanke Area Estate commercial ( Dir. Kat Kuo)
 
Listing Turkey Sylvana Istanbul - Bahcesehir
Listing Turkey Sylvana Istanbul - BahcesehirListing Turkey Sylvana Istanbul - Bahcesehir
Listing Turkey Sylvana Istanbul - Bahcesehir
 
Building Dreams: Newman Leech's Visionary Approach to Real Estate Investment
Building Dreams: Newman Leech's Visionary Approach to Real Estate InvestmentBuilding Dreams: Newman Leech's Visionary Approach to Real Estate Investment
Building Dreams: Newman Leech's Visionary Approach to Real Estate Investment
 
VIP Escorts in Delhi:🔝9953056974🔝 Hot Qutub Minar Delhi Escorts Service
VIP Escorts in Delhi:🔝9953056974🔝 Hot Qutub Minar Delhi Escorts ServiceVIP Escorts in Delhi:🔝9953056974🔝 Hot Qutub Minar Delhi Escorts Service
VIP Escorts in Delhi:🔝9953056974🔝 Hot Qutub Minar Delhi Escorts Service
 
Call Girls In Hari Nagar Dadb Block {8447779280}Hari Nagar {West Delhi Escort...
Call Girls In Hari Nagar Dadb Block {8447779280}Hari Nagar {West Delhi Escort...Call Girls In Hari Nagar Dadb Block {8447779280}Hari Nagar {West Delhi Escort...
Call Girls In Hari Nagar Dadb Block {8447779280}Hari Nagar {West Delhi Escort...
 
Aparna Greenscapes Kompally Hyderabad E - Brochure.pdf
Aparna Greenscapes Kompally Hyderabad E - Brochure.pdfAparna Greenscapes Kompally Hyderabad E - Brochure.pdf
Aparna Greenscapes Kompally Hyderabad E - Brochure.pdf
 
Low Rate Call Girls in Trilokpuri Delhi Call 9990771857
Low Rate Call Girls in Trilokpuri Delhi Call 9990771857Low Rate Call Girls in Trilokpuri Delhi Call 9990771857
Low Rate Call Girls in Trilokpuri Delhi Call 9990771857
 
9711199012 Call {Girls Delhi} Very Low rate Vaishali DownLoad PDF
9711199012 Call {Girls Delhi} Very Low rate Vaishali DownLoad PDF9711199012 Call {Girls Delhi} Very Low rate Vaishali DownLoad PDF
9711199012 Call {Girls Delhi} Very Low rate Vaishali DownLoad PDF
 
Call Girls in Pitampura Delhi 💯Call Us 🔝8264348440🔝
Call Girls in Pitampura Delhi 💯Call Us 🔝8264348440🔝Call Girls in Pitampura Delhi 💯Call Us 🔝8264348440🔝
Call Girls in Pitampura Delhi 💯Call Us 🔝8264348440🔝
 
Call Girls in Inderpuri Delhi 💯Call Us 🔝8264348440🔝
Call Girls in Inderpuri Delhi 💯Call Us 🔝8264348440🔝Call Girls in Inderpuri Delhi 💯Call Us 🔝8264348440🔝
Call Girls in Inderpuri Delhi 💯Call Us 🔝8264348440🔝
 
Purva Palm Hills Devanahalli, Bangalore E- Brochure.pdf
Purva Palm Hills Devanahalli, Bangalore E- Brochure.pdfPurva Palm Hills Devanahalli, Bangalore E- Brochure.pdf
Purva Palm Hills Devanahalli, Bangalore E- Brochure.pdf
 

JLL Detroit Office Insight & Statistics - Q2 2019

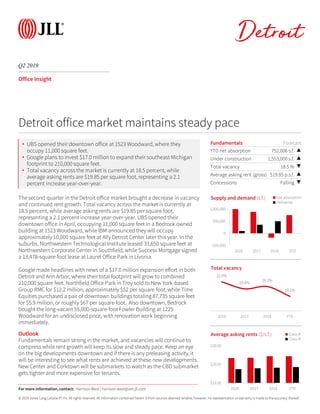
  • 1. © 2019 Jones Lang LaSalle IP, Inc. All rights reserved. All information contained herein is from sources deemed reliable; however, no representation or warranty is made to the accuracy thereof. Q2 2019 Detroit Office Insight The second quarter in the Detroit office market brought a decrease in vacancy and continued rent growth. Total vacancy across the market is currently at 18.5 percent, while average asking rents are $19.85 per square foot, representing a 2.1 percent increase year-over-year. UBS opened their downtown office in April, occupying 11,000 square feet in a Bedrock owned building at 1523 Woodward, while IBM announced they will occupy approximately 10,000 square feet at Ally Detroit Center later this year. In the suburbs, Northwestern Technological Institute leased 33,650 square feet at Northwestern Corporate Center in Southfield, while Success Mortgage signed a 13,478-square-foot lease at Laurel Office Park in Livonia. Google made headlines with news of a $17.0 million expansion effort in both Detroit and Ann Arbor, where their total footprint will grow to combined 210,000 square feet. Northfield Office Park in Troy sold to New York-based Group RMC for $12.2 million, approximately $52 per square foot, while Time Equities purchased a pair of downtown buildings totaling 87,735 square feet for $5.9 million, or roughly $67 per square foot. Also downtown, Bedrock bought the long-vacant 55,000-square-foot Fowler Building at 1225 Woodward for an undisclosed price, with renovation work beginning immediately. Outlook Fundamentals remain strong in the market, and vacancies will continue to compress while rent growth will keep its slow and steady pace. Keep an eye on the big developments downtown and if there is any preleasing activity, it will be interesting to see what rents are achieved at these new developments. New Center and Corktown will be submarkets to watch as the CBD submarket gets tighter and more expensive for tenants. Fundamentals Forecast YTD net absorption 752,006 s.f. ▲ Under construction 1,553,000 s.f. ▲ Total vacancy 18.5 % ▼ Average asking rent (gross) $19.85 p.s.f. ▲ Concessions Falling ▼ -500,000 0 500,000 1,000,000 2016 2017 2018 YTD Supply and demand (s.f.) Net absorption Deliveries Detroit office market maintains steady pace 21.0% 19.8% 20.2% 18.5% 2016 2017 2018 YTD Total vacancy $10.00 $20.00 $30.00 2016 2017 2018 YTD Average asking rents ($/s.f.) Class A Class B For more information, contact: Harrison West | harrison.west@am.jll.com • UBS opened their downtown office at 1523 Woodward, where they occupy 11,000 square feet. • Google plans to invest $17.0 million to expand their southeast Michigan footprint to 210,000 square feet. • Total vacancy across the market is currently at 18.5 percent, while average asking rents are $19.85 per square foot, representing a 2.1 percent increase year-over-year.
  • 2. © 2019 Jones Lang LaSalle IP, Inc. All rights reserved. All information contained herein is from sources deemed reliable; however, no representation or warranty is made to the accuracy thereof. Q2 2019 Office Statistics Detroit For more information, contact: Harrison West | harrison.west@am.jll.com Class Inventory (s.f.) Total net absorption (s.f.) YTD total net absorption (s.f.) YTD total net absorption (% of stock) Direct vacancy (%) Total vacancy (%) Average direct asking rent ($ p.s.f.) YTD Completions (s.f.) Under Development (s.f.) Birmingham/Bloomfield Totals 3,979,668 31,967 59,640 1.5% 17.0% 17.4% $26.68 0 0 Dearborn Totals 2,855,625 16,229 239,497 8.4% 19.9% 20.1% $17.12 150,000 0 Downriver Totals 483,907 0 123,243 25.5% 12.9% 12.9% $14.06 0 0 Farmington/Farmington Hills Totals 4,658,516 98,898 99,877 2.1% 15.0% 16.2% $18.53 0 0 Macomb Totals 1,333,505 87,402 31,175 2.3% 9.2% 9.5% $16.62 0 0 North Oakland Totals 2,260,888 24,682 36,760 1.6% 14.5% 14.9% $18.55 0 0 Northern I-275 Corridor Totals 4,467,691 21,173 -105,663 -2.4% 12.3% 13.1% $19.53 0 0 Royal Oak / SE Oakland Totals 837,998 58,297 68,096 8.1% 3.7% 3.7% $19.53 55,000 0 Southern I-275 Corridor Totals 1,077,525 7,217 -1,708 -0.2% 1.4% 27.5% $17.50 0 0 Southfield Totals 12,945,449 -31,294 -23,466 -0.2% 26.6% 28.5% $17.96 0 0 Troy Totals 11,003,062 10,718 81,542 0.7% 20.0% 22.7% $19.00 0 0 Washtenaw Totals 6,698,612 -184,470 19,955 0.3% 5.7% 9.6% $25.92 0 30,000 Suburbs Totals 52,602,446 140,819 628,948 1.2% 17.3% 19.6% $19.37 205,000 30,000 CBD Totals 13,477,209 30,667 86,399 0.6% 13.0% 14.4% $22.76 0 1,523,000 New Center Totals 1,486,775 -294 36,659 2.5% 15.6% 15.7% $21.47 0 0 Urban Totals 14,963,984 30,373 123,058 0.8% 13.3% 14.5% $22.56 0 1,523,000 Detroit Totals 67,566,430 171,192 752,006 1.1% 16.4% 18.5% $19.85 205,000 1,553,000 Birmingham/Bloomfield A 1,569,497 5,060 11,428 0.7% 25.4% 26.1% $28.63 0 0 Dearborn A 596,890 0 150,000 25.1% 0.8% 0.8% $25.00 150,000 0 Farmington/Farmington Hills A 618,109 0 21,609 3.5% 4.6% 4.6% $22.50 0 0 Macomb A 295,494 0 4,595 1.6% 2.1% 2.1% $19.12 0 0 North Oakland A 541,905 3,091 4,686 0.9% 14.5% 14.5% $21.20 0 0 Northern I-275 Corridor A 1,187,841 17,801 18,502 1.6% 8.7% 8.7% $19.57 0 0 Royal Oak / SE Oakland A 131,288 55,000 49,996 38.1% 3.8% 3.8% $30.00 55,000 0 Southern I-275 Corridor A 832,753 10,217 19,153 2.3% 0.0% 33.1% $0.00 0 0 Southfield A 2,970,217 4,063 -8,303 -0.3% 25.0% 27.3% $20.91 0 0 Troy A 1,924,131 -27,764 -16,296 -0.8% 11.4% 16.3% $25.82 0 0 Washtenaw A 3,278,983 -216,818 -87,512 -2.7% 4.0% 11.5% $32.72 0 30,000 Suburbs A 13,947,108 -149,350 167,858 1.2% 12.3% 17.3% $24.19 205,000 30,000 CBD A 6,354,714 25,342 18,250 0.3% 8.3% 10.7% $25.52 0 1,523,000 Urban A 6,354,714 25,342 18,250 0.3% 8.3% 10.7% $25.52 0 1,523,000 Detroit A 20,301,822 -124,008 186,108 0.9% 11.1% 15.2% $24.49 205,000 1,553,000 Birmingham/Bloomfield B 2,410,171 26,907 48,212 2.0% 11.6% 11.7% $23.87 0 0 Dearborn B 2,258,735 16,229 89,497 4.0% 24.9% 25.2% $17.04 0 0 Downriver B 483,907 0 123,243 25.5% 12.9% 12.9% $14.06 0 0 Farmington/Farmington Hills B 4,040,407 98,898 78,268 1.9% 16.6% 18.0% $18.35 0 0 Macomb B 991,381 87,402 26,580 2.7% 11.7% 12.1% $16.48 0 0 North Oakland B 1,718,983 21,591 32,074 1.9% 14.5% 15.0% $17.71 0 0 Northern I-275 Corridor B 3,279,850 3,372 -124,165 -3.8% 13.5% 14.8% $19.53 0 0 Royal Oak / SE Oakland B 706,710 3,297 18,100 2.6% 3.7% 3.7% $17.79 0 0 Southern I-275 Corridor B 244,772 -3,000 -20,861 -8.5% 6.2% 8.5% $17.50 0 0 Southfield B 9,975,232 -35,357 -15,163 -0.2% 27.1% 28.9% $17.01 0 0 Troy B 9,078,931 38,482 97,838 1.1% 21.8% 24.1% $18.28 0 0 Washtenaw B 3,419,629 32,348 107,467 3.1% 7.4% 7.7% $22.65 0 0 Suburbs B 38,608,708 290,169 461,090 1.2% 19.1% 20.4% $18.21 0 0 CBD B 7,122,495 5,325 68,149 1.0% 17.2% 17.7% $21.08 0 0 New Center B 1,486,775 -294 36,659 2.5% 15.6% 15.7% $21.47 0 0 Urban B 8,609,270 5,031 104,808 1.2% 16.9% 17.4% $21.16 0 0 Detroit B 47,217,978 295,200 565,898 1.2% 18.7% 19.9% $18.59 0 0