SlideShare a Scribd company logo
1 of 2
Download to read offline
© 2017 Jones Lang LaSalle IP, Inc. All rights reserved. All information contained herein is from sources deemed reliable; however, no representation or warranty is made to the accuracy thereof.
Q1 2017
Detroit
Office Insight
Metro Detroit saw 470,000 square feet of leases signed the first quarter, which
included the big news of Microsoft’s 40,000-square-foot tech center moving
from Southfield to One Campus Martius in the CBD. Microsoft now joins the
growing list of high-profile tenants to move downtown in recent months.
Bedrock was forced to move some of their employees around to other
buildings to accommodate Microsoft, once again highlighting how tight office
space in the CBD is at the moment. The long anticipated announcement of
the redevelopment project on the former Hudson’s site on Woodward in the
heart of downtown is just the latest project to address the dearth of quality
office space. The mixed-use plan includes approximately 280,000 square feet
of office space spread across 70,000-square-foot floor plates, which would be
among some of the largest in downtown Detroit.
Although another major tenant has chosen downtown over the suburbs,
demand has not completely dropped out in the suburban submarkets. In
Southfield, Credit Acceptance announced a $33.0 million expansion, and Blue
Cross Blue Shield of Michigan announced a 65,000-square-foot lease at the
Southfield Town Center. Magna Seating also opened their new HQ in Novi,
and the suburban office market certainly remains healthy.
Outlook
As new Class A space is both delivered and proposed in downtown Detroit, we
can anticipate the affect it will have on rents. Rents may not yet make a big
jump, but that certainly looms over the downtown office market with the new
development projects currently in the pipeline and large-scale renovations
underway. We can expect capital markets transactions in metro Detroit to
pick up moving forward, as we have seen properties trade both downtown
(Ford Building) and in the suburbs (North Troy Corporate Park, Delphi - Troy)
in the first quarter and conditions continue to improve.
Fundamentals Forecast
YTD net absorption 51,534 s.f. ▲
Under construction 663,957 s.f. ▲
Total vacancy 20.2% ▶
Average asking rent (gross) $19.66 p.s.f. ▲
Concessions Falling ▼
0
500,000
1,000,000
1,500,000
2013 2014 2015 2016 YTD
2017
Supply and demand (s.f.) Net absorption
Deliveries
Detroit office market continues to trend upward
25.4% 25.1%
19.0% 20.2% 20.3%
2013 2014 2015 2016 2017
Total vacancy
$0.00
$15.00
$30.00
2013 2014 2015 2016 2017
Average asking rents ($/s.f.) Class A
Class B
For more information, contact: Harrison West | harrison.west@am.jll.com
• Announced in February, the long-awaited Hudson’s block plan by
Bedrock will provide much needed big-block Class A office space.
• Microsoft will move their Tech Center from Southfield to One Campus
Martius, the latest major tenant to move from the suburbs to the CBD.
• Capital markets transaction activity can be expected to gain momentum
as market conditions continue to improve.
© 2017 Jones Lang LaSalle IP, Inc. All rights reserved. All information contained herein is from sources deemed reliable; however, no representation or warranty is made to the accuracy thereof.
Q1 2017
Detroit
Office Statistics
For more information, contact: Harrison West | harrison.west@am.jll.com
Class Inventory (s.f.)
Total net
absorption
(s.f.)
YTD total net
absorption
(s.f.)
YTD total net
absorption
(% of stock)
Direct
vacancy (%)
Total
vacancy (%)
Average
direct asking
rent ($ p.s.f.)
YTD
completions
(s.f.)
Under
construction
(s.f.)
CBD Totals 13,376,542 -61,955 -61,955 -0.5% 13.2% 13.8% $22.38 0 301,430
New Center Totals 1,142,100 50,792 50,792 4.4% 20.8% 20.8% $20.64 0 0
Urban Totals 14,518,642 -11,163 -11,163 -0.1% 13.8% 14.4% $22.17 0 301,430
Birmingham/Bloomfield Totals 3,919,028 -6,927 -6,927 -0.2% 11.4% 15.7% $25.32 0 0
Dearborn Totals 2,648,025 26,867 26,867 1.0% 29.0% 29.7% $17.07 0 0
Downriver Totals 483,772 -10,987 -10,987 -2.3% 43.4% 43.4% $17.29 0 0
Farmington/Farmington Hills Totals 4,658,516 19,638 19,638 0.4% 16.4% 16.4% $19.05 0 30,000
Macomb Totals 1,296,675 -6,594 -6,594 -0.5% 19.3% 19.3% $18.65 0 0
Northern I-275 Corridor Totals 4,467,691 43,576 43,576 1.0% 11.3% 13.0% $20.22 120,000 332,527
North Oakland Totals 2,845,648 -165,975 -165,975 -5.8% 17.6% 19.9% $18.84 0 0
Royal Oak/Southeast Oakland Totals 638,607 1,412 1,412 0.2% 7.7% 7.7% $19.67 0 0
Southern I-275 Corridor Totals 1,077,525 0 0 0.0% 0.4% 0.4% $0.00 0 0
Southfield Totals 13,602,449 -540 -540 0.0% 30.1% 31.8% $18.26 0 0
Troy Totals 10,965,343 160,491 160,491 1.5% 23.4% 24.1% $19.16 0 0
Washtenaw Totals 5,530,591 1,736 1,736 0.0% 9.8% 11.3% $25.03 0 0
Suburbs Totals 52,133,870 62,697 62,697 0.1% 20.5% 21.9% $19.19 120,000 362,527
Detroit Totals 66,652,512 51,534 51,534 0.1% 19.1% 20.3% $19.66 120,000 663,957
CBD A 6,194,047 -81,865 -81,865 -1.3% 9.7% 10.9% $22.83 0 301,430
Urban A 6,194,047 -81,865 -81,865 -1.3% 9.7% 10.9% $22.83 0 301,430
Birmingham/Bloomfield A 1,569,497 -18,492 -18,492 -1.2% 13.6% 24.2% $27.96 0 0
Dearborn A 446,890 1,619 1,619 0.4% 10.9% 10.9% $27.83 0 0
Farmington/Farmington Hills A 618,109 0 0 0.0% 6.8% 6.8% $21.79 0 0
Macomb A 295,494 8,164 8,164 2.8% 1.6% 1.6% $19.32 0 0
Northern I-275 Corridor A 1,113,719 8,002 8,002 0.7% 5.8% 6.9% $18.57 120,000 75,980
North Oakland A 488,665 28,344 28,344 5.8% 13.6% 13.6% $20.92 0 0
Southern I-275 Corridor A 832,753 0 0 0.0% 0.0% 0.0% NA 0 0
Southfield A 2,970,217 89,108 89,108 3.0% 23.9% 24.3% $25.45 0 0
Troy A 2,230,851 -48,841 -48,841 -2.2% 22.1% 22.7% $26.57 0 0
Washtenaw A 3,221,589 -24,636 -24,636 -0.8% 11.2% 13.4% $24.62 0 0
Suburbs A 13,787,784 43,268 43,268 0.3% 14.5% 16.5% $25.44 120,000 75,980
Detroit A 19,981,831 -38,597 -38,597 -0.2% 13.0% 14.8% $24.83 120,000 377,410
CBD B 7,182,495 19,910 19,910 0.3% 16.2% 16.4% $22.15 0 0
New Center B 1,142,100 50,792 50,792 4.4% 20.8% 20.8% $20.64 0 0
Urban B 8,324,595 70,702 70,702 0.8% 16.8% 17.0% $21.89 0 0
Birmingham/Bloomfield B 2,349,531 11,565 11,565 0.5% 10.0% 10.1% $22.91 0 0
Dearborn B 2,201,135 25,248 25,248 1.1% 32.7% 33.5% $16.35 0 0
Downriver B 483,772 -10,987 -10,987 -2.3% 43.4% 43.4% $17.29 0 0
Farmington/Farmington Hills B 4,040,407 19,638 19,638 0.5% 17.8% 17.9% $18.89 0 30,000
Macomb B 1,001,181 -14,758 -14,758 -1.5% 24.5% 24.5% $18.64 0 0
Northern I-275 Corridor B 3,353,972 35,574 35,574 1.1% 13.1% 15.0% $20.47 0 256,547
North Oakland B 2,356,983 -194,319 -194,319 -8.2% 18.4% 21.3% $18.52 0 0
Royal Oak/Southeast Oakland B 638,607 1,412 1,412 0.2% 7.7% 7.7% $19.67 0 0
Southern I-275 Corridor B 244,772 0 0 0.0% 1.9% 1.9% NA 0 0
Southfield B 10,632,232 -89,648 -89,648 -0.8% 31.9% 33.8% $16.75 0 0
Troy B 8,734,492 209,332 209,332 2.4% 23.8% 24.5% $17.40 0 0
Washtenaw B 2,309,002 26,372 26,372 1.1% 8.0% 8.3% $25.82 0 0
Suburbs B 38,346,086 19,429 19,429 0.1% 22.7% 23.8% $17.75 0 286,547
Detroit B 46,670,681 90,131 90,131 0.2% 21.6% 22.6% $18.33 0 286,547

More Related Content

What's hot

Pittsburgh Office Insight & Stats Q1 2022
Pittsburgh Office Insight & Stats Q1 2022Pittsburgh Office Insight & Stats Q1 2022
Pittsburgh Office Insight & Stats Q1 2022Tobiah Bilski
 
JLL Cleveland Office Outlook: Q3 2018
JLL Cleveland Office Outlook: Q3 2018JLL Cleveland Office Outlook: Q3 2018
JLL Cleveland Office Outlook: Q3 2018Andrew Batson
 
JLL Pittsburgh Office Insight & Statistics - Q3 2018
JLL Pittsburgh Office Insight & Statistics - Q3 2018JLL Pittsburgh Office Insight & Statistics - Q3 2018
JLL Pittsburgh Office Insight & Statistics - Q3 2018Tobiah Bilski
 
JLL Pittsburgh Office Insight & Statistics - Q1 2019
JLL Pittsburgh Office Insight & Statistics - Q1 2019JLL Pittsburgh Office Insight & Statistics - Q1 2019
JLL Pittsburgh Office Insight & Statistics - Q1 2019Tobiah Bilski
 
Cushman & Wakefield Montreal Americas Marketbeat Office Q12019 #CRE #RealEstate
Cushman & Wakefield Montreal Americas Marketbeat Office Q12019  #CRE #RealEstateCushman & Wakefield Montreal Americas Marketbeat Office Q12019  #CRE #RealEstate
Cushman & Wakefield Montreal Americas Marketbeat Office Q12019 #CRE #RealEstateGuy Masse
 
JLL Pittsburgh Office Insight & Statistics - Q1 2021
JLL Pittsburgh Office Insight & Statistics - Q1 2021JLL Pittsburgh Office Insight & Statistics - Q1 2021
JLL Pittsburgh Office Insight & Statistics - Q1 2021Tobiah Bilski
 
JLL Cleveland Office Outlook: Q3 2017
JLL Cleveland Office Outlook: Q3 2017JLL Cleveland Office Outlook: Q3 2017
JLL Cleveland Office Outlook: Q3 2017Andrew Batson
 
JLL Cleveland Office Outlook: Q1 2018
JLL Cleveland Office Outlook: Q1 2018JLL Cleveland Office Outlook: Q1 2018
JLL Cleveland Office Outlook: Q1 2018Andrew Batson
 
JLL Cleveland Office Outlook: Q1 2017
JLL Cleveland Office Outlook: Q1 2017JLL Cleveland Office Outlook: Q1 2017
JLL Cleveland Office Outlook: Q1 2017Andrew Batson
 
JLL Pittsburgh Office Insight & Statistics - Q4 2018
JLL Pittsburgh Office Insight & Statistics - Q4 2018JLL Pittsburgh Office Insight & Statistics - Q4 2018
JLL Pittsburgh Office Insight & Statistics - Q4 2018Tobiah Bilski
 
JLL Cleveland Office Outlook: Q4 2020
JLL Cleveland Office Outlook: Q4 2020JLL Cleveland Office Outlook: Q4 2020
JLL Cleveland Office Outlook: Q4 2020Andrew Batson
 
JLL Grand Rapids Office Insight & Statistics - Q4 2019
JLL Grand Rapids Office Insight & Statistics - Q4 2019JLL Grand Rapids Office Insight & Statistics - Q4 2019
JLL Grand Rapids Office Insight & Statistics - Q4 2019Harrison West
 
Waterloo Region Office Market Report Q1 2019
Waterloo Region Office Market Report Q1 2019Waterloo Region Office Market Report Q1 2019
Waterloo Region Office Market Report Q1 2019Darren Shaw, SIOR
 
St. Louis Office Outlook Q3 2016
St. Louis Office Outlook Q3 2016St. Louis Office Outlook Q3 2016
St. Louis Office Outlook Q3 2016Blaise Tomazic
 
Office Insight and Statistics: Fort Worth (2019-Q2)
Office Insight and Statistics: Fort Worth (2019-Q2)Office Insight and Statistics: Fort Worth (2019-Q2)
Office Insight and Statistics: Fort Worth (2019-Q2)Nick Thomas
 
JLL Detroit Office Outlook: Q4 2015
JLL Detroit Office Outlook: Q4 2015JLL Detroit Office Outlook: Q4 2015
JLL Detroit Office Outlook: Q4 2015Aaron Moore
 
JLL Cincinnati Office Insight & Statistics - Q2 2016
JLL Cincinnati Office Insight & Statistics - Q2 2016JLL Cincinnati Office Insight & Statistics - Q2 2016
JLL Cincinnati Office Insight & Statistics - Q2 2016Ross Bratcher
 

What's hot (20)

Pittsburgh Office Insight & Stats Q1 2022
Pittsburgh Office Insight & Stats Q1 2022Pittsburgh Office Insight & Stats Q1 2022
Pittsburgh Office Insight & Stats Q1 2022
 
JLL Cleveland Office Outlook: Q3 2018
JLL Cleveland Office Outlook: Q3 2018JLL Cleveland Office Outlook: Q3 2018
JLL Cleveland Office Outlook: Q3 2018
 
JLL Pittsburgh Office Insight & Statistics - Q3 2018
JLL Pittsburgh Office Insight & Statistics - Q3 2018JLL Pittsburgh Office Insight & Statistics - Q3 2018
JLL Pittsburgh Office Insight & Statistics - Q3 2018
 
JLL Pittsburgh Office Insight & Statistics - Q1 2019
JLL Pittsburgh Office Insight & Statistics - Q1 2019JLL Pittsburgh Office Insight & Statistics - Q1 2019
JLL Pittsburgh Office Insight & Statistics - Q1 2019
 
Cushman & Wakefield Montreal Americas Marketbeat Office Q12019 #CRE #RealEstate
Cushman & Wakefield Montreal Americas Marketbeat Office Q12019  #CRE #RealEstateCushman & Wakefield Montreal Americas Marketbeat Office Q12019  #CRE #RealEstate
Cushman & Wakefield Montreal Americas Marketbeat Office Q12019 #CRE #RealEstate
 
JLL Pittsburgh Office Insight & Statistics - Q1 2021
JLL Pittsburgh Office Insight & Statistics - Q1 2021JLL Pittsburgh Office Insight & Statistics - Q1 2021
JLL Pittsburgh Office Insight & Statistics - Q1 2021
 
JLL Cleveland Office Outlook: Q3 2017
JLL Cleveland Office Outlook: Q3 2017JLL Cleveland Office Outlook: Q3 2017
JLL Cleveland Office Outlook: Q3 2017
 
JLL Cleveland Office Outlook: Q1 2018
JLL Cleveland Office Outlook: Q1 2018JLL Cleveland Office Outlook: Q1 2018
JLL Cleveland Office Outlook: Q1 2018
 
JLL Cleveland Office Outlook: Q1 2017
JLL Cleveland Office Outlook: Q1 2017JLL Cleveland Office Outlook: Q1 2017
JLL Cleveland Office Outlook: Q1 2017
 
JLL Pittsburgh Office Insight & Statistics - Q4 2018
JLL Pittsburgh Office Insight & Statistics - Q4 2018JLL Pittsburgh Office Insight & Statistics - Q4 2018
JLL Pittsburgh Office Insight & Statistics - Q4 2018
 
JLL Cleveland Office Outlook: Q4 2020
JLL Cleveland Office Outlook: Q4 2020JLL Cleveland Office Outlook: Q4 2020
JLL Cleveland Office Outlook: Q4 2020
 
SVNR Office Market Report Q116
SVNR Office Market Report Q116SVNR Office Market Report Q116
SVNR Office Market Report Q116
 
JLL Grand Rapids Office Insight & Statistics - Q4 2019
JLL Grand Rapids Office Insight & Statistics - Q4 2019JLL Grand Rapids Office Insight & Statistics - Q4 2019
JLL Grand Rapids Office Insight & Statistics - Q4 2019
 
Waterloo Region Office Market Report Q1 2019
Waterloo Region Office Market Report Q1 2019Waterloo Region Office Market Report Q1 2019
Waterloo Region Office Market Report Q1 2019
 
St. Louis Office Outlook Q3 2016
St. Louis Office Outlook Q3 2016St. Louis Office Outlook Q3 2016
St. Louis Office Outlook Q3 2016
 
Office Insight and Statistics: Fort Worth (2019-Q2)
Office Insight and Statistics: Fort Worth (2019-Q2)Office Insight and Statistics: Fort Worth (2019-Q2)
Office Insight and Statistics: Fort Worth (2019-Q2)
 
JLL Detroit Office Outlook: Q4 2015
JLL Detroit Office Outlook: Q4 2015JLL Detroit Office Outlook: Q4 2015
JLL Detroit Office Outlook: Q4 2015
 
JLL Cincinnati Office Insight & Statistics - Q2 2016
JLL Cincinnati Office Insight & Statistics - Q2 2016JLL Cincinnati Office Insight & Statistics - Q2 2016
JLL Cincinnati Office Insight & Statistics - Q2 2016
 
Economic Injury Disaster Loans & Emergency Economic Injury Grants
Economic Injury Disaster Loans & Emergency Economic Injury GrantsEconomic Injury Disaster Loans & Emergency Economic Injury Grants
Economic Injury Disaster Loans & Emergency Economic Injury Grants
 
Q1 2017 Houston Office Research & Forecast Report
Q1 2017 Houston Office Research & Forecast Report Q1 2017 Houston Office Research & Forecast Report
Q1 2017 Houston Office Research & Forecast Report
 

Similar to JLL Detroit Office Insight & Statistics - Q1 2017

JLL Detroit Office Insight & Statistics - Q4 2017
JLL Detroit Office Insight & Statistics - Q4 2017JLL Detroit Office Insight & Statistics - Q4 2017
JLL Detroit Office Insight & Statistics - Q4 2017Harrison West
 
JLL Detroit Office Insight & Statistics - Q3 2018
JLL Detroit Office Insight & Statistics - Q3 2018JLL Detroit Office Insight & Statistics - Q3 2018
JLL Detroit Office Insight & Statistics - Q3 2018Harrison West
 
JLL Detroit Office Insight & Statistics - Q4 2019
JLL Detroit Office Insight & Statistics - Q4 2019JLL Detroit Office Insight & Statistics - Q4 2019
JLL Detroit Office Insight & Statistics - Q4 2019Harrison West
 
JLL Detroit Office Insight & Statistics - Q2 2019
JLL Detroit Office Insight & Statistics - Q2 2019JLL Detroit Office Insight & Statistics - Q2 2019
JLL Detroit Office Insight & Statistics - Q2 2019Harrison West
 
JLL Cleveland Office Outlook: Q2 2018
JLL Cleveland Office Outlook: Q2 2018JLL Cleveland Office Outlook: Q2 2018
JLL Cleveland Office Outlook: Q2 2018Andrew Batson
 
JLL Cincinnati Office Outlook Q4 2020
JLL Cincinnati Office Outlook Q4 2020JLL Cincinnati Office Outlook Q4 2020
JLL Cincinnati Office Outlook Q4 2020Abby Armbruster
 
JLL Cleveland Office Outlook: Q4 2018
JLL Cleveland Office Outlook: Q4 2018JLL Cleveland Office Outlook: Q4 2018
JLL Cleveland Office Outlook: Q4 2018Andrew Batson
 
JLL Downtown Chicago Office Market Update - Q3 2016
JLL Downtown Chicago Office Market Update - Q3 2016JLL Downtown Chicago Office Market Update - Q3 2016
JLL Downtown Chicago Office Market Update - Q3 2016Hailey Harrington
 
Jll cincinnati office outlook q2 2017
Jll cincinnati office outlook   q2 2017Jll cincinnati office outlook   q2 2017
Jll cincinnati office outlook q2 2017Abby Armbruster
 
JLL Cincinnati Office Insight & Statistics - Q3 2016
JLL Cincinnati Office Insight & Statistics - Q3 2016JLL Cincinnati Office Insight & Statistics - Q3 2016
JLL Cincinnati Office Insight & Statistics - Q3 2016Ross Bratcher
 
JLL Grand Rapids Office Insight & Statistics - Q3 2018
JLL Grand Rapids Office Insight & Statistics - Q3 2018JLL Grand Rapids Office Insight & Statistics - Q3 2018
JLL Grand Rapids Office Insight & Statistics - Q3 2018Harrison West
 
St. Louis Office Outlook Q2 2016
St. Louis Office Outlook Q2 2016St. Louis Office Outlook Q2 2016
St. Louis Office Outlook Q2 2016Blaise Tomazic
 
JLL Pittsburgh Office Insight & Statistics - Q1 2020
JLL Pittsburgh Office Insight & Statistics - Q1 2020JLL Pittsburgh Office Insight & Statistics - Q1 2020
JLL Pittsburgh Office Insight & Statistics - Q1 2020Tobiah Bilski
 
JLL Cleveland Office Outlook: Q2 2018
JLL Cleveland Office Outlook: Q2 2018JLL Cleveland Office Outlook: Q2 2018
JLL Cleveland Office Outlook: Q2 2018Andrew Batson
 
JLL Cincinnati Office Outlook Q2 2020
JLL Cincinnati Office Outlook Q2 2020JLL Cincinnati Office Outlook Q2 2020
JLL Cincinnati Office Outlook Q2 2020Abby Armbruster
 
Q1 2017 - Chicago Suburbs Office Reports
Q1 2017 - Chicago Suburbs Office ReportsQ1 2017 - Chicago Suburbs Office Reports
Q1 2017 - Chicago Suburbs Office ReportsHailey Harrington
 
JLL Houston Office Market Report - Q4 2018
JLL Houston Office Market Report - Q4 2018JLL Houston Office Market Report - Q4 2018
JLL Houston Office Market Report - Q4 2018DavidDominy1
 
JLL Pittsburgh Industrial Insight & Statistics - Q2 2018
JLL Pittsburgh Industrial Insight & Statistics - Q2 2018JLL Pittsburgh Industrial Insight & Statistics - Q2 2018
JLL Pittsburgh Industrial Insight & Statistics - Q2 2018Tobiah Bilski
 

Similar to JLL Detroit Office Insight & Statistics - Q1 2017 (20)

JLL Detroit Office Insight & Statistics - Q4 2017
JLL Detroit Office Insight & Statistics - Q4 2017JLL Detroit Office Insight & Statistics - Q4 2017
JLL Detroit Office Insight & Statistics - Q4 2017
 
JLL Detroit Office Insight & Statistics - Q3 2018
JLL Detroit Office Insight & Statistics - Q3 2018JLL Detroit Office Insight & Statistics - Q3 2018
JLL Detroit Office Insight & Statistics - Q3 2018
 
JLL Detroit Office Insight & Statistics - Q4 2019
JLL Detroit Office Insight & Statistics - Q4 2019JLL Detroit Office Insight & Statistics - Q4 2019
JLL Detroit Office Insight & Statistics - Q4 2019
 
JLL Detroit Office Insight & Statistics - Q2 2019
JLL Detroit Office Insight & Statistics - Q2 2019JLL Detroit Office Insight & Statistics - Q2 2019
JLL Detroit Office Insight & Statistics - Q2 2019
 
JLL Cleveland Office Outlook: Q2 2018
JLL Cleveland Office Outlook: Q2 2018JLL Cleveland Office Outlook: Q2 2018
JLL Cleveland Office Outlook: Q2 2018
 
JLL Cincinnati Office Outlook Q4 2020
JLL Cincinnati Office Outlook Q4 2020JLL Cincinnati Office Outlook Q4 2020
JLL Cincinnati Office Outlook Q4 2020
 
JLL Cleveland Office Outlook: Q4 2018
JLL Cleveland Office Outlook: Q4 2018JLL Cleveland Office Outlook: Q4 2018
JLL Cleveland Office Outlook: Q4 2018
 
JLL Downtown Chicago Office Market Update - Q3 2016
JLL Downtown Chicago Office Market Update - Q3 2016JLL Downtown Chicago Office Market Update - Q3 2016
JLL Downtown Chicago Office Market Update - Q3 2016
 
Jll cincinnati office outlook q2 2017
Jll cincinnati office outlook   q2 2017Jll cincinnati office outlook   q2 2017
Jll cincinnati office outlook q2 2017
 
JLL Cincinnati Office Insight & Statistics - Q3 2016
JLL Cincinnati Office Insight & Statistics - Q3 2016JLL Cincinnati Office Insight & Statistics - Q3 2016
JLL Cincinnati Office Insight & Statistics - Q3 2016
 
JLL Grand Rapids Office Insight & Statistics - Q3 2018
JLL Grand Rapids Office Insight & Statistics - Q3 2018JLL Grand Rapids Office Insight & Statistics - Q3 2018
JLL Grand Rapids Office Insight & Statistics - Q3 2018
 
St. Louis Office Outlook Q2 2016
St. Louis Office Outlook Q2 2016St. Louis Office Outlook Q2 2016
St. Louis Office Outlook Q2 2016
 
JLL Pittsburgh Office Insight & Statistics - Q1 2020
JLL Pittsburgh Office Insight & Statistics - Q1 2020JLL Pittsburgh Office Insight & Statistics - Q1 2020
JLL Pittsburgh Office Insight & Statistics - Q1 2020
 
JLL Cleveland Office Outlook: Q2 2018
JLL Cleveland Office Outlook: Q2 2018JLL Cleveland Office Outlook: Q2 2018
JLL Cleveland Office Outlook: Q2 2018
 
JLL Cincinnati Office Outlook Q2 2020
JLL Cincinnati Office Outlook Q2 2020JLL Cincinnati Office Outlook Q2 2020
JLL Cincinnati Office Outlook Q2 2020
 
Q1 2017 - Chicago Suburbs Office Reports
Q1 2017 - Chicago Suburbs Office ReportsQ1 2017 - Chicago Suburbs Office Reports
Q1 2017 - Chicago Suburbs Office Reports
 
JLL Houston Office Report Q4
JLL Houston Office Report Q4JLL Houston Office Report Q4
JLL Houston Office Report Q4
 
JLL Houston Office Market Report - Q4 2018
JLL Houston Office Market Report - Q4 2018JLL Houston Office Market Report - Q4 2018
JLL Houston Office Market Report - Q4 2018
 
JLL Pittsburgh Industrial Insight & Statistics - Q2 2018
JLL Pittsburgh Industrial Insight & Statistics - Q2 2018JLL Pittsburgh Industrial Insight & Statistics - Q2 2018
JLL Pittsburgh Industrial Insight & Statistics - Q2 2018
 
JLL Houston 2018 Q1 Office Market Report
JLL Houston 2018 Q1 Office Market ReportJLL Houston 2018 Q1 Office Market Report
JLL Houston 2018 Q1 Office Market Report
 

Recently uploaded

Call Girls in shastri nagar Delhi 8264348440 ✅ call girls ❤️
Call Girls in shastri nagar Delhi 8264348440 ✅ call girls ❤️Call Girls in shastri nagar Delhi 8264348440 ✅ call girls ❤️
Call Girls in shastri nagar Delhi 8264348440 ✅ call girls ❤️soniya singh
 
Call Girls In Madipur Metro Delhi꧁ +91)8447779280꧂Low Rate 2 short 2000 full ...
Call Girls In Madipur Metro Delhi꧁ +91)8447779280꧂Low Rate 2 short 2000 full ...Call Girls In Madipur Metro Delhi꧁ +91)8447779280꧂Low Rate 2 short 2000 full ...
Call Girls In Madipur Metro Delhi꧁ +91)8447779280꧂Low Rate 2 short 2000 full ...asmaqueen5
 
Low Rate Call Girls in Tughlakabad Delhi Call 9990771857
Low Rate Call Girls in Tughlakabad Delhi Call 9990771857Low Rate Call Girls in Tughlakabad Delhi Call 9990771857
Low Rate Call Girls in Tughlakabad Delhi Call 9990771857delhimodel235
 
Building Dreams: Newman Leech's Visionary Approach to Real Estate Investment
Building Dreams: Newman Leech's Visionary Approach to Real Estate InvestmentBuilding Dreams: Newman Leech's Visionary Approach to Real Estate Investment
Building Dreams: Newman Leech's Visionary Approach to Real Estate InvestmentNewman George Leech
 
The Omaxe State Dwarka Delhi-broucher.pdf.pdf
The Omaxe State Dwarka Delhi-broucher.pdf.pdfThe Omaxe State Dwarka Delhi-broucher.pdf.pdf
The Omaxe State Dwarka Delhi-broucher.pdf.pdfkratirudram
 
9990771857 Call Girls in Noida Sector 34 Noida (Call Girls) Delhi
9990771857 Call Girls in Noida Sector 34 Noida (Call Girls) Delhi9990771857 Call Girls in Noida Sector 34 Noida (Call Girls) Delhi
9990771857 Call Girls in Noida Sector 34 Noida (Call Girls) Delhidelhimodel235
 
Omaxe Dwarka In Delhi E Brochure Pdf
Omaxe Dwarka In Delhi E Brochure     PdfOmaxe Dwarka In Delhi E Brochure     Pdf
Omaxe Dwarka In Delhi E Brochure Pdfashiyadav24
 
9990771857 Call Girls in Noida Sector 06 Noida (Call Girls) Delhi
9990771857 Call Girls in Noida Sector 06 Noida (Call Girls) Delhi9990771857 Call Girls in Noida Sector 06 Noida (Call Girls) Delhi
9990771857 Call Girls in Noida Sector 06 Noida (Call Girls) Delhidelhimodel235
 
Cashpay_Call Girls In Gaur City Mall Noida ❤️8860477959 Escorts Service In 24...
Cashpay_Call Girls In Gaur City Mall Noida ❤️8860477959 Escorts Service In 24...Cashpay_Call Girls In Gaur City Mall Noida ❤️8860477959 Escorts Service In 24...
Cashpay_Call Girls In Gaur City Mall Noida ❤️8860477959 Escorts Service In 24...lizamodels9
 
Call Girls in Pitampura Delhi 💯Call Us 🔝8264348440🔝
Call Girls in Pitampura Delhi 💯Call Us 🔝8264348440🔝Call Girls in Pitampura Delhi 💯Call Us 🔝8264348440🔝
Call Girls in Pitampura Delhi 💯Call Us 🔝8264348440🔝soniya singh
 
SSPL The Strand Abodes Kharadi Pune Brochure.pdf
SSPL The Strand Abodes Kharadi Pune Brochure.pdfSSPL The Strand Abodes Kharadi Pune Brochure.pdf
SSPL The Strand Abodes Kharadi Pune Brochure.pdfabbu831446
 
Call Girls In The Lalit New Delhi ❤️8860477959 Good Looking Escorts In 24/7 D...
Call Girls In The Lalit New Delhi ❤️8860477959 Good Looking Escorts In 24/7 D...Call Girls In The Lalit New Delhi ❤️8860477959 Good Looking Escorts In 24/7 D...
Call Girls In The Lalit New Delhi ❤️8860477959 Good Looking Escorts In 24/7 D...lizamodels9
 
Call Girls in Kashmiri Gate Delhi 💯Call Us 🔝8264348440🔝
Call Girls in Kashmiri Gate Delhi 💯Call Us 🔝8264348440🔝Call Girls in Kashmiri Gate Delhi 💯Call Us 🔝8264348440🔝
Call Girls in Kashmiri Gate Delhi 💯Call Us 🔝8264348440🔝soniya singh
 
Call Girls in Noida Sector 11 Noida 💯Call Us 🔝 9582086666 🔝 South Delhi Escor...
Call Girls in Noida Sector 11 Noida 💯Call Us 🔝 9582086666 🔝 South Delhi Escor...Call Girls in Noida Sector 11 Noida 💯Call Us 🔝 9582086666 🔝 South Delhi Escor...
Call Girls in Noida Sector 11 Noida 💯Call Us 🔝 9582086666 🔝 South Delhi Escor...delhimodel235
 
Call Girls in Model Town Delhi 💯Call Us 🔝8264348440🔝
Call Girls in Model Town Delhi 💯Call Us 🔝8264348440🔝Call Girls in Model Town Delhi 💯Call Us 🔝8264348440🔝
Call Girls in Model Town Delhi 💯Call Us 🔝8264348440🔝soniya singh
 
Call girls in Jeewan Park .Delhi↫8447779280↬ ꧂Escorts Service In Delhi Ncr
Call girls in Jeewan Park .Delhi↫8447779280↬ ꧂Escorts Service In Delhi NcrCall girls in Jeewan Park .Delhi↫8447779280↬ ꧂Escorts Service In Delhi Ncr
Call girls in Jeewan Park .Delhi↫8447779280↬ ꧂Escorts Service In Delhi Ncrasmaqueen5
 
9711199012 Call {Girls Delhi} Very Low rate Vaishali DownLoad PDF
9711199012 Call {Girls Delhi} Very Low rate Vaishali DownLoad PDF9711199012 Call {Girls Delhi} Very Low rate Vaishali DownLoad PDF
9711199012 Call {Girls Delhi} Very Low rate Vaishali DownLoad PDFMs Riya
 
Call Girls In Hari Nagar Dadb Block {8447779280}Hari Nagar {West Delhi Escort...
Call Girls In Hari Nagar Dadb Block {8447779280}Hari Nagar {West Delhi Escort...Call Girls In Hari Nagar Dadb Block {8447779280}Hari Nagar {West Delhi Escort...
Call Girls In Hari Nagar Dadb Block {8447779280}Hari Nagar {West Delhi Escort...asmaqueen5
 
Call Girls In Mayur Vihar-1 Delhi ❤️8860477959 Good Looking Escorts In 24/7 D...
Call Girls In Mayur Vihar-1 Delhi ❤️8860477959 Good Looking Escorts In 24/7 D...Call Girls In Mayur Vihar-1 Delhi ❤️8860477959 Good Looking Escorts In 24/7 D...
Call Girls In Mayur Vihar-1 Delhi ❤️8860477959 Good Looking Escorts In 24/7 D...lizamodels9
 
9990771857 Call Girls in Noida Sector 1 Noida (Call Girls) Delhi
9990771857 Call Girls in Noida Sector 1 Noida (Call Girls) Delhi9990771857 Call Girls in Noida Sector 1 Noida (Call Girls) Delhi
9990771857 Call Girls in Noida Sector 1 Noida (Call Girls) Delhidelhimodel235
 

Recently uploaded (20)

Call Girls in shastri nagar Delhi 8264348440 ✅ call girls ❤️
Call Girls in shastri nagar Delhi 8264348440 ✅ call girls ❤️Call Girls in shastri nagar Delhi 8264348440 ✅ call girls ❤️
Call Girls in shastri nagar Delhi 8264348440 ✅ call girls ❤️
 
Call Girls In Madipur Metro Delhi꧁ +91)8447779280꧂Low Rate 2 short 2000 full ...
Call Girls In Madipur Metro Delhi꧁ +91)8447779280꧂Low Rate 2 short 2000 full ...Call Girls In Madipur Metro Delhi꧁ +91)8447779280꧂Low Rate 2 short 2000 full ...
Call Girls In Madipur Metro Delhi꧁ +91)8447779280꧂Low Rate 2 short 2000 full ...
 
Low Rate Call Girls in Tughlakabad Delhi Call 9990771857
Low Rate Call Girls in Tughlakabad Delhi Call 9990771857Low Rate Call Girls in Tughlakabad Delhi Call 9990771857
Low Rate Call Girls in Tughlakabad Delhi Call 9990771857
 
Building Dreams: Newman Leech's Visionary Approach to Real Estate Investment
Building Dreams: Newman Leech's Visionary Approach to Real Estate InvestmentBuilding Dreams: Newman Leech's Visionary Approach to Real Estate Investment
Building Dreams: Newman Leech's Visionary Approach to Real Estate Investment
 
The Omaxe State Dwarka Delhi-broucher.pdf.pdf
The Omaxe State Dwarka Delhi-broucher.pdf.pdfThe Omaxe State Dwarka Delhi-broucher.pdf.pdf
The Omaxe State Dwarka Delhi-broucher.pdf.pdf
 
9990771857 Call Girls in Noida Sector 34 Noida (Call Girls) Delhi
9990771857 Call Girls in Noida Sector 34 Noida (Call Girls) Delhi9990771857 Call Girls in Noida Sector 34 Noida (Call Girls) Delhi
9990771857 Call Girls in Noida Sector 34 Noida (Call Girls) Delhi
 
Omaxe Dwarka In Delhi E Brochure Pdf
Omaxe Dwarka In Delhi E Brochure     PdfOmaxe Dwarka In Delhi E Brochure     Pdf
Omaxe Dwarka In Delhi E Brochure Pdf
 
9990771857 Call Girls in Noida Sector 06 Noida (Call Girls) Delhi
9990771857 Call Girls in Noida Sector 06 Noida (Call Girls) Delhi9990771857 Call Girls in Noida Sector 06 Noida (Call Girls) Delhi
9990771857 Call Girls in Noida Sector 06 Noida (Call Girls) Delhi
 
Cashpay_Call Girls In Gaur City Mall Noida ❤️8860477959 Escorts Service In 24...
Cashpay_Call Girls In Gaur City Mall Noida ❤️8860477959 Escorts Service In 24...Cashpay_Call Girls In Gaur City Mall Noida ❤️8860477959 Escorts Service In 24...
Cashpay_Call Girls In Gaur City Mall Noida ❤️8860477959 Escorts Service In 24...
 
Call Girls in Pitampura Delhi 💯Call Us 🔝8264348440🔝
Call Girls in Pitampura Delhi 💯Call Us 🔝8264348440🔝Call Girls in Pitampura Delhi 💯Call Us 🔝8264348440🔝
Call Girls in Pitampura Delhi 💯Call Us 🔝8264348440🔝
 
SSPL The Strand Abodes Kharadi Pune Brochure.pdf
SSPL The Strand Abodes Kharadi Pune Brochure.pdfSSPL The Strand Abodes Kharadi Pune Brochure.pdf
SSPL The Strand Abodes Kharadi Pune Brochure.pdf
 
Call Girls In The Lalit New Delhi ❤️8860477959 Good Looking Escorts In 24/7 D...
Call Girls In The Lalit New Delhi ❤️8860477959 Good Looking Escorts In 24/7 D...Call Girls In The Lalit New Delhi ❤️8860477959 Good Looking Escorts In 24/7 D...
Call Girls In The Lalit New Delhi ❤️8860477959 Good Looking Escorts In 24/7 D...
 
Call Girls in Kashmiri Gate Delhi 💯Call Us 🔝8264348440🔝
Call Girls in Kashmiri Gate Delhi 💯Call Us 🔝8264348440🔝Call Girls in Kashmiri Gate Delhi 💯Call Us 🔝8264348440🔝
Call Girls in Kashmiri Gate Delhi 💯Call Us 🔝8264348440🔝
 
Call Girls in Noida Sector 11 Noida 💯Call Us 🔝 9582086666 🔝 South Delhi Escor...
Call Girls in Noida Sector 11 Noida 💯Call Us 🔝 9582086666 🔝 South Delhi Escor...Call Girls in Noida Sector 11 Noida 💯Call Us 🔝 9582086666 🔝 South Delhi Escor...
Call Girls in Noida Sector 11 Noida 💯Call Us 🔝 9582086666 🔝 South Delhi Escor...
 
Call Girls in Model Town Delhi 💯Call Us 🔝8264348440🔝
Call Girls in Model Town Delhi 💯Call Us 🔝8264348440🔝Call Girls in Model Town Delhi 💯Call Us 🔝8264348440🔝
Call Girls in Model Town Delhi 💯Call Us 🔝8264348440🔝
 
Call girls in Jeewan Park .Delhi↫8447779280↬ ꧂Escorts Service In Delhi Ncr
Call girls in Jeewan Park .Delhi↫8447779280↬ ꧂Escorts Service In Delhi NcrCall girls in Jeewan Park .Delhi↫8447779280↬ ꧂Escorts Service In Delhi Ncr
Call girls in Jeewan Park .Delhi↫8447779280↬ ꧂Escorts Service In Delhi Ncr
 
9711199012 Call {Girls Delhi} Very Low rate Vaishali DownLoad PDF
9711199012 Call {Girls Delhi} Very Low rate Vaishali DownLoad PDF9711199012 Call {Girls Delhi} Very Low rate Vaishali DownLoad PDF
9711199012 Call {Girls Delhi} Very Low rate Vaishali DownLoad PDF
 
Call Girls In Hari Nagar Dadb Block {8447779280}Hari Nagar {West Delhi Escort...
Call Girls In Hari Nagar Dadb Block {8447779280}Hari Nagar {West Delhi Escort...Call Girls In Hari Nagar Dadb Block {8447779280}Hari Nagar {West Delhi Escort...
Call Girls In Hari Nagar Dadb Block {8447779280}Hari Nagar {West Delhi Escort...
 
Call Girls In Mayur Vihar-1 Delhi ❤️8860477959 Good Looking Escorts In 24/7 D...
Call Girls In Mayur Vihar-1 Delhi ❤️8860477959 Good Looking Escorts In 24/7 D...Call Girls In Mayur Vihar-1 Delhi ❤️8860477959 Good Looking Escorts In 24/7 D...
Call Girls In Mayur Vihar-1 Delhi ❤️8860477959 Good Looking Escorts In 24/7 D...
 
9990771857 Call Girls in Noida Sector 1 Noida (Call Girls) Delhi
9990771857 Call Girls in Noida Sector 1 Noida (Call Girls) Delhi9990771857 Call Girls in Noida Sector 1 Noida (Call Girls) Delhi
9990771857 Call Girls in Noida Sector 1 Noida (Call Girls) Delhi
 

JLL Detroit Office Insight & Statistics - Q1 2017

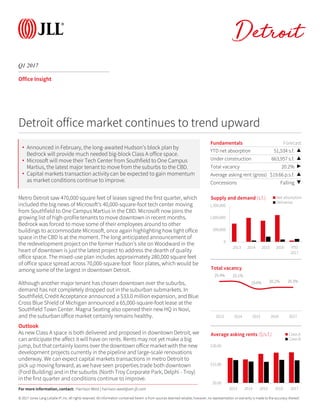
  • 1. © 2017 Jones Lang LaSalle IP, Inc. All rights reserved. All information contained herein is from sources deemed reliable; however, no representation or warranty is made to the accuracy thereof. Q1 2017 Detroit Office Insight Metro Detroit saw 470,000 square feet of leases signed the first quarter, which included the big news of Microsoft’s 40,000-square-foot tech center moving from Southfield to One Campus Martius in the CBD. Microsoft now joins the growing list of high-profile tenants to move downtown in recent months. Bedrock was forced to move some of their employees around to other buildings to accommodate Microsoft, once again highlighting how tight office space in the CBD is at the moment. The long anticipated announcement of the redevelopment project on the former Hudson’s site on Woodward in the heart of downtown is just the latest project to address the dearth of quality office space. The mixed-use plan includes approximately 280,000 square feet of office space spread across 70,000-square-foot floor plates, which would be among some of the largest in downtown Detroit. Although another major tenant has chosen downtown over the suburbs, demand has not completely dropped out in the suburban submarkets. In Southfield, Credit Acceptance announced a $33.0 million expansion, and Blue Cross Blue Shield of Michigan announced a 65,000-square-foot lease at the Southfield Town Center. Magna Seating also opened their new HQ in Novi, and the suburban office market certainly remains healthy. Outlook As new Class A space is both delivered and proposed in downtown Detroit, we can anticipate the affect it will have on rents. Rents may not yet make a big jump, but that certainly looms over the downtown office market with the new development projects currently in the pipeline and large-scale renovations underway. We can expect capital markets transactions in metro Detroit to pick up moving forward, as we have seen properties trade both downtown (Ford Building) and in the suburbs (North Troy Corporate Park, Delphi - Troy) in the first quarter and conditions continue to improve. Fundamentals Forecast YTD net absorption 51,534 s.f. ▲ Under construction 663,957 s.f. ▲ Total vacancy 20.2% ▶ Average asking rent (gross) $19.66 p.s.f. ▲ Concessions Falling ▼ 0 500,000 1,000,000 1,500,000 2013 2014 2015 2016 YTD 2017 Supply and demand (s.f.) Net absorption Deliveries Detroit office market continues to trend upward 25.4% 25.1% 19.0% 20.2% 20.3% 2013 2014 2015 2016 2017 Total vacancy $0.00 $15.00 $30.00 2013 2014 2015 2016 2017 Average asking rents ($/s.f.) Class A Class B For more information, contact: Harrison West | harrison.west@am.jll.com • Announced in February, the long-awaited Hudson’s block plan by Bedrock will provide much needed big-block Class A office space. • Microsoft will move their Tech Center from Southfield to One Campus Martius, the latest major tenant to move from the suburbs to the CBD. • Capital markets transaction activity can be expected to gain momentum as market conditions continue to improve.
  • 2. © 2017 Jones Lang LaSalle IP, Inc. All rights reserved. All information contained herein is from sources deemed reliable; however, no representation or warranty is made to the accuracy thereof. Q1 2017 Detroit Office Statistics For more information, contact: Harrison West | harrison.west@am.jll.com Class Inventory (s.f.) Total net absorption (s.f.) YTD total net absorption (s.f.) YTD total net absorption (% of stock) Direct vacancy (%) Total vacancy (%) Average direct asking rent ($ p.s.f.) YTD completions (s.f.) Under construction (s.f.) CBD Totals 13,376,542 -61,955 -61,955 -0.5% 13.2% 13.8% $22.38 0 301,430 New Center Totals 1,142,100 50,792 50,792 4.4% 20.8% 20.8% $20.64 0 0 Urban Totals 14,518,642 -11,163 -11,163 -0.1% 13.8% 14.4% $22.17 0 301,430 Birmingham/Bloomfield Totals 3,919,028 -6,927 -6,927 -0.2% 11.4% 15.7% $25.32 0 0 Dearborn Totals 2,648,025 26,867 26,867 1.0% 29.0% 29.7% $17.07 0 0 Downriver Totals 483,772 -10,987 -10,987 -2.3% 43.4% 43.4% $17.29 0 0 Farmington/Farmington Hills Totals 4,658,516 19,638 19,638 0.4% 16.4% 16.4% $19.05 0 30,000 Macomb Totals 1,296,675 -6,594 -6,594 -0.5% 19.3% 19.3% $18.65 0 0 Northern I-275 Corridor Totals 4,467,691 43,576 43,576 1.0% 11.3% 13.0% $20.22 120,000 332,527 North Oakland Totals 2,845,648 -165,975 -165,975 -5.8% 17.6% 19.9% $18.84 0 0 Royal Oak/Southeast Oakland Totals 638,607 1,412 1,412 0.2% 7.7% 7.7% $19.67 0 0 Southern I-275 Corridor Totals 1,077,525 0 0 0.0% 0.4% 0.4% $0.00 0 0 Southfield Totals 13,602,449 -540 -540 0.0% 30.1% 31.8% $18.26 0 0 Troy Totals 10,965,343 160,491 160,491 1.5% 23.4% 24.1% $19.16 0 0 Washtenaw Totals 5,530,591 1,736 1,736 0.0% 9.8% 11.3% $25.03 0 0 Suburbs Totals 52,133,870 62,697 62,697 0.1% 20.5% 21.9% $19.19 120,000 362,527 Detroit Totals 66,652,512 51,534 51,534 0.1% 19.1% 20.3% $19.66 120,000 663,957 CBD A 6,194,047 -81,865 -81,865 -1.3% 9.7% 10.9% $22.83 0 301,430 Urban A 6,194,047 -81,865 -81,865 -1.3% 9.7% 10.9% $22.83 0 301,430 Birmingham/Bloomfield A 1,569,497 -18,492 -18,492 -1.2% 13.6% 24.2% $27.96 0 0 Dearborn A 446,890 1,619 1,619 0.4% 10.9% 10.9% $27.83 0 0 Farmington/Farmington Hills A 618,109 0 0 0.0% 6.8% 6.8% $21.79 0 0 Macomb A 295,494 8,164 8,164 2.8% 1.6% 1.6% $19.32 0 0 Northern I-275 Corridor A 1,113,719 8,002 8,002 0.7% 5.8% 6.9% $18.57 120,000 75,980 North Oakland A 488,665 28,344 28,344 5.8% 13.6% 13.6% $20.92 0 0 Southern I-275 Corridor A 832,753 0 0 0.0% 0.0% 0.0% NA 0 0 Southfield A 2,970,217 89,108 89,108 3.0% 23.9% 24.3% $25.45 0 0 Troy A 2,230,851 -48,841 -48,841 -2.2% 22.1% 22.7% $26.57 0 0 Washtenaw A 3,221,589 -24,636 -24,636 -0.8% 11.2% 13.4% $24.62 0 0 Suburbs A 13,787,784 43,268 43,268 0.3% 14.5% 16.5% $25.44 120,000 75,980 Detroit A 19,981,831 -38,597 -38,597 -0.2% 13.0% 14.8% $24.83 120,000 377,410 CBD B 7,182,495 19,910 19,910 0.3% 16.2% 16.4% $22.15 0 0 New Center B 1,142,100 50,792 50,792 4.4% 20.8% 20.8% $20.64 0 0 Urban B 8,324,595 70,702 70,702 0.8% 16.8% 17.0% $21.89 0 0 Birmingham/Bloomfield B 2,349,531 11,565 11,565 0.5% 10.0% 10.1% $22.91 0 0 Dearborn B 2,201,135 25,248 25,248 1.1% 32.7% 33.5% $16.35 0 0 Downriver B 483,772 -10,987 -10,987 -2.3% 43.4% 43.4% $17.29 0 0 Farmington/Farmington Hills B 4,040,407 19,638 19,638 0.5% 17.8% 17.9% $18.89 0 30,000 Macomb B 1,001,181 -14,758 -14,758 -1.5% 24.5% 24.5% $18.64 0 0 Northern I-275 Corridor B 3,353,972 35,574 35,574 1.1% 13.1% 15.0% $20.47 0 256,547 North Oakland B 2,356,983 -194,319 -194,319 -8.2% 18.4% 21.3% $18.52 0 0 Royal Oak/Southeast Oakland B 638,607 1,412 1,412 0.2% 7.7% 7.7% $19.67 0 0 Southern I-275 Corridor B 244,772 0 0 0.0% 1.9% 1.9% NA 0 0 Southfield B 10,632,232 -89,648 -89,648 -0.8% 31.9% 33.8% $16.75 0 0 Troy B 8,734,492 209,332 209,332 2.4% 23.8% 24.5% $17.40 0 0 Washtenaw B 2,309,002 26,372 26,372 1.1% 8.0% 8.3% $25.82 0 0 Suburbs B 38,346,086 19,429 19,429 0.1% 22.7% 23.8% $17.75 0 286,547 Detroit B 46,670,681 90,131 90,131 0.2% 21.6% 22.6% $18.33 0 286,547