Submit Search
Upload
JLL Pittsburgh Office Insight & Statistics - Q2 2019
•
1 like
•
90 views
T
Tobiah Bilski
Follow
Vacancy increases across the market as new leasing activity slows down in existing product.
Read less
Read more
Real Estate
Report
Share
Report
Share
1 of 2
Download now
Download to read offline
Recommended
JLL Pittsburgh Office Insight & Statistics - Q2 2018
Tobiah Bilski
JLL Pittsburgh Office Insight & Statistics - Q4 2018
Tobiah Bilski
JLL Pittsburgh Office Insight & Statistics - Q2 2020
Tobiah Bilski
JLL Pittsburgh Office Insight & Statistics - Q1 2020
Tobiah Bilski
JLL Pittsburgh Office Insight & Statistics - Q3 2018
Tobiah Bilski
JLL Pittsburgh Office Insight & Statistics - Q4 2019
Tobiah Bilski
JLL Pittsburgh Office Insight & Statistics - Q1 2018
Tobiah Bilski
JLL Pittsburgh Office Insight & Statistics - Q3 2019
Tobiah Bilski
JLL Pittsburgh Office Insight & Statistics - Q1 2019
Tobiah Bilski
JLL Pittsburgh Office Insight & Statistics - Q2 2021
Tobiah Bilski
JLL Pittsburgh Office Outlook - Q4 2015
Andrew Batson
JLL Pittsburgh Office Insight & Statistics - Q1 2021
Tobiah Bilski
JLL Louisville Office Outlook Q4 2017
Alex Westcott
JLL Pittsburgh Office Insight & Statistics - Q4 2017
Tobiah Bilski
JLL Houston 2018 Q1 Office Market Report
Kenneth Levenson, MAI, FRICS
JLL Cleveland Office Outlook: Q3 2020
Andrew Batson
JLL Louisville Office Outlook - Q3 2019
Alex Westcott
JLL Louisville Office Outlook - Q2 2018
Alex Westcott
JLL Detroit Office Insight & Statistics – Q2 2016
Aaron Moore
JLL Pittsburgh Office Insight & Statistics - Q3 2021
Tobiah Bilski
JLL Cincinnati Office Insight & Statistics - Q2 2016
Ross Bratcher
JLL Cleveland Office Outlook: Q4 2018
Andrew Batson
Jll cincinnati office outlook q2 2017
Abby Armbruster
JLL Columbus Office Outlook: Q2 2016
Peter McStravick
JLL Cleveland Office Outlook: Q2 2018
Andrew Batson
JLL Detroit Office Insight & Statistics - Q1 2018
Harrison West
JLL Columbus Office Outlook - Q4 2020
Emma Gresky
St. Louis Office Outlook Q3 2016
Blaise Tomazic
JLL Pittsburgh Office Insight & Statistics - Q1 2017
Tobiah Bilski
JLL Pittsburgh Office Insight & Statistics - Q3 2017
Tobiah Bilski
More Related Content
What's hot
JLL Pittsburgh Office Insight & Statistics - Q1 2019
Tobiah Bilski
JLL Pittsburgh Office Insight & Statistics - Q2 2021
Tobiah Bilski
JLL Pittsburgh Office Outlook - Q4 2015
Andrew Batson
JLL Pittsburgh Office Insight & Statistics - Q1 2021
Tobiah Bilski
JLL Louisville Office Outlook Q4 2017
Alex Westcott
JLL Pittsburgh Office Insight & Statistics - Q4 2017
Tobiah Bilski
JLL Houston 2018 Q1 Office Market Report
Kenneth Levenson, MAI, FRICS
JLL Cleveland Office Outlook: Q3 2020
Andrew Batson
JLL Louisville Office Outlook - Q3 2019
Alex Westcott
JLL Louisville Office Outlook - Q2 2018
Alex Westcott
JLL Detroit Office Insight & Statistics – Q2 2016
Aaron Moore
JLL Pittsburgh Office Insight & Statistics - Q3 2021
Tobiah Bilski
JLL Cincinnati Office Insight & Statistics - Q2 2016
Ross Bratcher
JLL Cleveland Office Outlook: Q4 2018
Andrew Batson
Jll cincinnati office outlook q2 2017
Abby Armbruster
JLL Columbus Office Outlook: Q2 2016
Peter McStravick
JLL Cleveland Office Outlook: Q2 2018
Andrew Batson
JLL Detroit Office Insight & Statistics - Q1 2018
Harrison West
JLL Columbus Office Outlook - Q4 2020
Emma Gresky
St. Louis Office Outlook Q3 2016
Blaise Tomazic
What's hot
(20)
JLL Pittsburgh Office Insight & Statistics - Q1 2019
JLL Pittsburgh Office Insight & Statistics - Q2 2021
JLL Pittsburgh Office Outlook - Q4 2015
JLL Pittsburgh Office Insight & Statistics - Q1 2021
JLL Louisville Office Outlook Q4 2017
JLL Pittsburgh Office Insight & Statistics - Q4 2017
JLL Houston 2018 Q1 Office Market Report
JLL Cleveland Office Outlook: Q3 2020
JLL Louisville Office Outlook - Q3 2019
JLL Louisville Office Outlook - Q2 2018
JLL Detroit Office Insight & Statistics – Q2 2016
JLL Pittsburgh Office Insight & Statistics - Q3 2021
JLL Cincinnati Office Insight & Statistics - Q2 2016
JLL Cleveland Office Outlook: Q4 2018
Jll cincinnati office outlook q2 2017
JLL Columbus Office Outlook: Q2 2016
JLL Cleveland Office Outlook: Q2 2018
JLL Detroit Office Insight & Statistics - Q1 2018
JLL Columbus Office Outlook - Q4 2020
St. Louis Office Outlook Q3 2016
Similar to JLL Pittsburgh Office Insight & Statistics - Q2 2019
JLL Pittsburgh Office Insight & Statistics - Q1 2017
Tobiah Bilski
JLL Pittsburgh Office Insight & Statistics - Q3 2017
Tobiah Bilski
Q2 2023 Pittsburgh Office Insight & Stats
Caitlin Fadgen
Pittsburgh Office Insight & Stats Q4 2021
Tobiah Bilski
JLL Pittsburgh Industrial Insight & Statistics - Q3 2018
Tobiah Bilski
JLL Louisville Office Outlook - Q4 2018
Alex Westcott
JLL Louisville Office Outlook - Q4 2019
Alex Westcott
JLL Cleveland Office Outlook: Q4 2020
Andrew Batson
JLL West Michigan Industrial Insight & Statistics - Q1 2020
Harrison West
Q1 2017 - Chicago Suburbs Office Reports
Hailey Harrington
JLL Pittsburgh Industrial Insight & Statistics - Q4 2019
Tobiah Bilski
JLL Louisville Office Outlook - Q1 2019
Alex Westcott
Pittsburgh Office Insight & Stats Q1 2022
Tobiah Bilski
JLL Pittsburgh Industrial Insight & Statistics - Q3 2019
Tobiah Bilski
Jll cincinnati office outlook q1 2017
Abby Armbruster
JLL Grand Rapids Office Insight & Statistics - Q3 2018
Harrison West
JLL Cincinnati Industrial Outlook Q4 2020
Abby Armbruster
JLL Cincinnati Office Outlook Q4 2020
Abby Armbruster
Similar to JLL Pittsburgh Office Insight & Statistics - Q2 2019
(18)
JLL Pittsburgh Office Insight & Statistics - Q1 2017
JLL Pittsburgh Office Insight & Statistics - Q3 2017
Q2 2023 Pittsburgh Office Insight & Stats
Pittsburgh Office Insight & Stats Q4 2021
JLL Pittsburgh Industrial Insight & Statistics - Q3 2018
JLL Louisville Office Outlook - Q4 2018
JLL Louisville Office Outlook - Q4 2019
JLL Cleveland Office Outlook: Q4 2020
JLL West Michigan Industrial Insight & Statistics - Q1 2020
Q1 2017 - Chicago Suburbs Office Reports
JLL Pittsburgh Industrial Insight & Statistics - Q4 2019
JLL Louisville Office Outlook - Q1 2019
Pittsburgh Office Insight & Stats Q1 2022
JLL Pittsburgh Industrial Insight & Statistics - Q3 2019
Jll cincinnati office outlook q1 2017
JLL Grand Rapids Office Insight & Statistics - Q3 2018
JLL Cincinnati Industrial Outlook Q4 2020
JLL Cincinnati Office Outlook Q4 2020
More from Tobiah Bilski
JLL Pittsburgh Industrial Insight & Statistics - Q4 2021
Tobiah Bilski
JLL Pittsburgh Industrial Insight & Statistics - Q3 2021
Tobiah Bilski
JLL Pittsburgh Industrial Insight & Statistics - Q2 2021
Tobiah Bilski
JLL Pittsburgh Industrial Insight & Statistics - Q1 2021
Tobiah Bilski
JLL Pittsburgh Industrial Insight & Statistics - Q4 2020
Tobiah Bilski
JLL Pittsburgh Industrial Insight & Statistics - Q3 2020
Tobiah Bilski
JLL Pittsburgh Industrial Insight & Statistics - Q2 2020
Tobiah Bilski
JLL Pittsburgh Industrial Insight & Statistics - Q1 2020
Tobiah Bilski
JLL Pittsburgh Industrial Insight & Statistics - Q2 2019
Tobiah Bilski
JLL Pittsburgh Industrial Insight & Statistics - Q1 2019
Tobiah Bilski
JLL Pittsburgh Industrial Insight & Statistics - Q4 2018
Tobiah Bilski
JLL Pittsburgh Industrial Insight & Statistics - Q2 2018
Tobiah Bilski
JLL Pittsburgh Industrial Insight & Statistics - Q1 2018
Tobiah Bilski
More from Tobiah Bilski
(13)
JLL Pittsburgh Industrial Insight & Statistics - Q4 2021
JLL Pittsburgh Industrial Insight & Statistics - Q3 2021
JLL Pittsburgh Industrial Insight & Statistics - Q2 2021
JLL Pittsburgh Industrial Insight & Statistics - Q1 2021
JLL Pittsburgh Industrial Insight & Statistics - Q4 2020
JLL Pittsburgh Industrial Insight & Statistics - Q3 2020
JLL Pittsburgh Industrial Insight & Statistics - Q2 2020
JLL Pittsburgh Industrial Insight & Statistics - Q1 2020
JLL Pittsburgh Industrial Insight & Statistics - Q2 2019
JLL Pittsburgh Industrial Insight & Statistics - Q1 2019
JLL Pittsburgh Industrial Insight & Statistics - Q4 2018
JLL Pittsburgh Industrial Insight & Statistics - Q2 2018
JLL Pittsburgh Industrial Insight & Statistics - Q1 2018
Recently uploaded
Nanke Area Estate commercial ( Dir. Kat Kuo)
jessica288382
Model Call Girl in Shastri Nagar Delhi reach out to us at 🔝8264348440🔝
soniya singh
Call Girls in Model Town Delhi 💯Call Us 🔝8264348440🔝
soniya singh
9990771857 Call Girls in Noida Sector 1 Noida (Call Girls) Delhi
delhimodel235
Call Girls in Nehru Place Delhi 💯Call Us 🔝8264348440🔝
soniya singh
9990771857 Call Girls in Noida Sector 11 Noida (Call Girls) Delhi
delhimodel235
Call Girls in Noida Sector 11 Noida 💯Call Us 🔝 9582086666 🔝 South Delhi Escor...
delhimodel235
Call Girls In Sahibabad Ghaziabad ❤️8860477959 Low Rate Escorts Service In 24...
lizamodels9
Call Girls in Kashmiri Gate Delhi 💯Call Us 🔝8264348440🔝
soniya singh
9990771857 Call Girls in Noida Sector 06 Noida (Call Girls) Delhi
delhimodel235
83770-87607 ۞Call Girls In Near The Park Hotel (Cp) Delhi
dollysharma2066
8 Key Elements for Comfortable Farmland Living
Farmland Bazaar
Call girls in Jeewan Park .Delhi↫8447779280↬ ꧂Escorts Service In Delhi Ncr
asmaqueen5
Call Girls in Sarai Kale Khan Delhi 💯Call Us 🔝8264348440🔝
soniya singh
How to Build Multifamily and Laneway Suites in Toronto!! (feat. Expert Archi...
Volition Properties
9711199012 Call {Girls Delhi} Very Low rate Vaishali DownLoad PDF
Ms Riya
Low Rate Call Girls in Tughlakabad Delhi Call 9990771857
delhimodel235
Call Girls In Vasundhara Ghaziabad ❤️8860477959 Low Rate Escorts Service In 2...
lizamodels9
Call Girls in Mahavir Nagar whatsaap call US +919953056974
9953056974 Low Rate Call Girls In Saket, Delhi NCR
9990771857 Call Girls in Noida Sector 34 Noida (Call Girls) Delhi
delhimodel235
Recently uploaded
(20)
Nanke Area Estate commercial ( Dir. Kat Kuo)
Model Call Girl in Shastri Nagar Delhi reach out to us at 🔝8264348440🔝
Call Girls in Model Town Delhi 💯Call Us 🔝8264348440🔝
9990771857 Call Girls in Noida Sector 1 Noida (Call Girls) Delhi
Call Girls in Nehru Place Delhi 💯Call Us 🔝8264348440🔝
9990771857 Call Girls in Noida Sector 11 Noida (Call Girls) Delhi
Call Girls in Noida Sector 11 Noida 💯Call Us 🔝 9582086666 🔝 South Delhi Escor...
Call Girls In Sahibabad Ghaziabad ❤️8860477959 Low Rate Escorts Service In 24...
Call Girls in Kashmiri Gate Delhi 💯Call Us 🔝8264348440🔝
9990771857 Call Girls in Noida Sector 06 Noida (Call Girls) Delhi
83770-87607 ۞Call Girls In Near The Park Hotel (Cp) Delhi
8 Key Elements for Comfortable Farmland Living
Call girls in Jeewan Park .Delhi↫8447779280↬ ꧂Escorts Service In Delhi Ncr
Call Girls in Sarai Kale Khan Delhi 💯Call Us 🔝8264348440🔝
How to Build Multifamily and Laneway Suites in Toronto!! (feat. Expert Archi...
9711199012 Call {Girls Delhi} Very Low rate Vaishali DownLoad PDF
Low Rate Call Girls in Tughlakabad Delhi Call 9990771857
Call Girls In Vasundhara Ghaziabad ❤️8860477959 Low Rate Escorts Service In 2...
Call Girls in Mahavir Nagar whatsaap call US +919953056974
9990771857 Call Girls in Noida Sector 34 Noida (Call Girls) Delhi
JLL Pittsburgh Office Insight & Statistics - Q2 2019
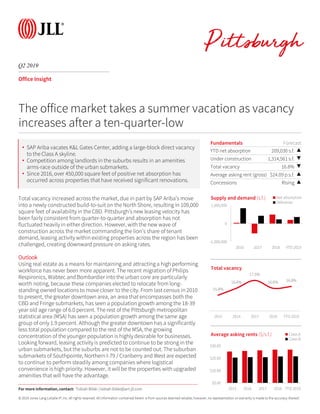
1.
© 2019 Jones
Lang LaSalle IP, Inc. All rights reserved. All information contained herein is from sources deemed reliable; however, no representation or warranty is made to the accuracy thereof. Fundamentals Forecast YTD net absorption 209,030 s.f. ▲ Under construction 1,314,561 s.f. ▼ Total vacancy 16.8% ▼ Average asking rent (gross) $24.09 p.s.f. ▲ Concessions Rising ▲ Q2 2019 Office Insight Total vacancy increased across the market, due in part by SAP Ariba’s move into a newly constructed build-to-suit on the North Shore, resulting in 109,000 square feet of availability in the CBD. Pittsburgh’s new leasing velocity has been fairly consistent from quarter-to-quarter and absorption has not fluctuated heavily in either direction. However, with the new wave of construction across the market commanding the lion’s share of tenant demand, leasing activity within existing properties across the region has been challenged, creating downward pressure on asking rates. Outlook Using real estate as a means for maintaining and attracting a high performing workforce has never been more apparent. The recent migration of Philips Respironics, Wabtec and Bombardier into the urban core are particularly worth noting, because these companies elected to relocate from long- standing owned locations to move closer to the city. From last census in 2010 to present, the greater downtown area, an area that encompasses both the CBD and Fringe submarkets, has seen a population growth among the 18-39 year old age range of 6.0 percent. The rest of the Pittsburgh metropolitan statistical area (MSA) has seen a population growth among the same age group of only 1.9 percent. Although the greater downtown has a significantly less total population compared to the rest of the MSA, the growing concentration of the younger population is highly desirable for businesses. Looking forward, leasing activity is predicted to continue to be strong in the urban submarkets, but the suburbs are not to be counted out. The suburban submarkets of Southpointe, Northern I-79 / Cranberry and West are expected to continue to perform steadily among companies where logistical convenience is high priority. However, it will be the properties with upgraded amenities that will have the advantage. -1,000,000 0 1,000,000 2016 2017 2018 YTD 2019 Supply and demand (s.f.) Net absorption Deliveries The office market takes a summer vacation as vacancy increases after a ten-quarter-low 15.8% 16.6% 17.5% 16.6% 16.8% 2015 2016 2017 2018 YTD 2019 Total vacancy $0.00 $10.00 $20.00 $30.00 2015 2016 2017 2018 YTD 2019 Average asking rents ($/s.f.) Class A Class B For more information, contact: Tobiah Bilski | tobiah.bilski@am.jll.com • SAP Ariba vacates K&L Gates Center, adding a large-block direct vacancy to the Class A skyline. • Competition among landlords in the suburbs results in an amenities arms-race outside of the urban submarkets. • Since 2016, over 450,000 square feet of positive net absorption has occurred across properties that have received significant renovations.
2.
© 2019 Jones
Lang LaSalle IP, Inc. All rights reserved. All information contained herein is from sources deemed reliable; however, no representation or warranty is made to the accuracy thereof. Class Inventory (s.f.) Total net absorption (s.f.) YTD total net absorption (s.f.) YTD total net absorption (% of stock) Direct vacancy (%) Total vacancy (%) Average direct asking rent ($ p.s.f.) YTD Completions (s.f.) Under Development (s.f.) Northern I-79 / Cranberry Totals 4,286,907 -136,170 -66,240 -1.5% 17.5% 19.9% $24.30 0 90,000 East Totals 3,053,814 21,117 34,293 1.1% 25.6% 25.8% $19.48 0 0 North Totals 3,751,808 7,078 14,055 0.4% 10.6% 10.7% $19.60 0 0 South Totals 2,311,420 -48,101 -32,660 -1.4% 13.2% 13.7% $19.76 0 0 Southpointe Totals 2,972,107 -17,852 57,751 1.9% 16.0% 17.0% $21.79 0 0 West Totals 7,055,933 -115,721 -151,844 -2.2% 19.1% 22.0% $21.65 0 220,000 Suburban Totals 23,431,989 -289,649 -144,645 -0.6% 17.3% 18.8% $21.15 0 310,000 CBD Totals 18,969,985 -64,215 -111,300 -0.6% 14.6% 15.7% $27.37 0 50,000 Fringe Totals 8,510,066 29,857 367,047 4.3% 13.4% 17.3% $25.33 277,000 408,408 Oakland / East End Totals 2,198,256 106,662 97,928 4.5% 3.0% 3.0% $26.64 86,500 546,153 Urban Totals 29,678,307 72,304 353,675 1.2% 13.4% 15.2% $26.71 363,500 1,004,561 Pittsburgh Totals 53,110,296 -217,345 209,030 0.4% 15.1% 16.8% $24.09 363,500 1,314,561 Northern I-79 / Cranberry A 3,601,749 -136,913 -66,983 -1.9% 16.8% 19.6% $25.90 0 90,000 East A 1,580,784 24,544 47,619 3.0% 28.6% 28.9% $20.54 0 0 North A 809,347 7,963 1,901 0.2% 10.3% 10.5% $25.02 0 0 Southpointe A 1,909,754 11,859 55,207 2.9% 7.4% 9.0% $23.51 0 0 West A 3,767,504 43,656 8,903 0.2% 16.1% 19.5% $23.12 0 220,000 Suburban A 11,669,138 -48,891 46,647 0.4% 16.2% 18.5% $23.00 0 310,000 CBD A 13,498,998 -74,975 -151,726 -1.1% 13.0% 14.2% $29.96 0 50,000 Fringe A 2,665,470 45,049 384,389 14.4% 3.3% 8.4% $30.01 277,000 408,408 Oakland / East End A 1,055,743 74,862 65,383 6.2% 4.4% 4.4% $28.12 86,500 504,153 Urban A 17,220,211 44,936 298,046 1.7% 11.0% 12.7% $29.93 363,500 962,561 Pittsburgh A 28,889,349 -3,955 344,693 1.2% 13.1% 15.0% $27.00 363,500 1,272,561 Northern I-79 / Cranberry B 685,158 743 743 0.1% 21.5% 21.5% $21.11 0 0 East B 1,473,030 -3,427 -13,326 -0.9% 22.4% 22.4% $18.05 0 0 North B 2,942,461 -885 12,154 0.4% 10.7% 10.7% $18.14 0 0 South B 2,311,420 -48,101 -32,660 -1.4% 13.2% 13.7% $19.76 0 0 Southpointe B 1,062,353 -29,711 2,544 0.2% 31.3% 31.3% $21.07 0 0 West B 3,288,429 -159,377 -160,747 -4.9% 22.4% 24.9% $20.47 0 0 Suburban B 11,762,851 -240,758 -191,292 -1.6% 18.4% 19.2% $19.80 0 0 CBD B 5,470,987 10,760 40,426 0.7% 18.8% 19.5% $22.35 0 0 Fringe B 5,844,596 -15,192 -17,342 -0.3% 18.0% 21.4% $24.30 0 0 Oakland / East End B 1,142,513 31,800 32,545 2.8% 1.7% 1.7% $23.27 0 42,000 Urban B 12,458,096 27,368 55,629 0.4% 16.8% 18.8% $23.39 0 42,000 Pittsburgh B 24,220,947 -213,390 -135,663 -0.6% 17.6% 19.0% $21.55 0 42,000 Q2 2019 Office Statistics For more information, contact: Tobiah Bilski | tobiah.bilski@am.jll.com
Download now