The St. Louis office market summary document reports:
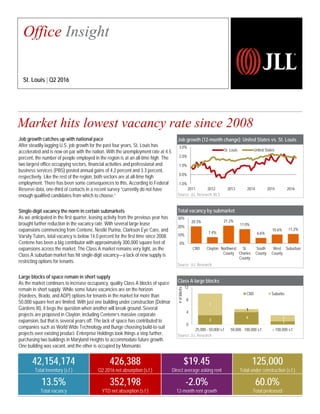
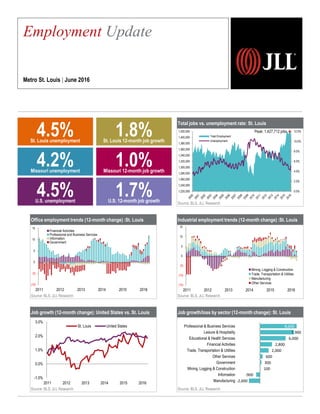
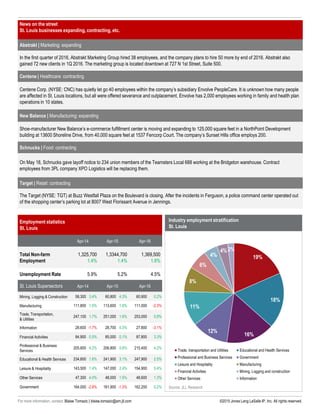
1) Job growth in St. Louis has accelerated and is now on par with national growth rates, with financial activities and professional services posting annual gains.
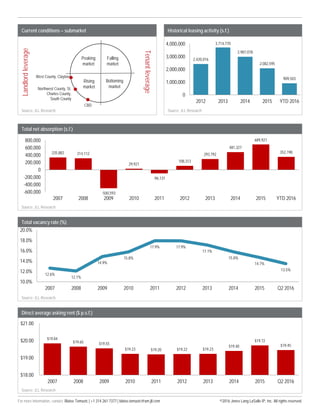
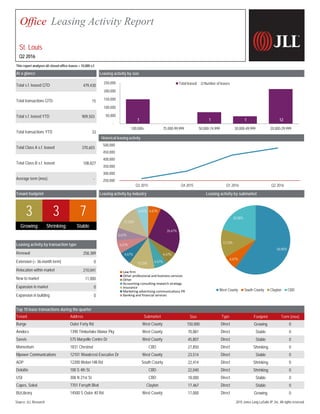
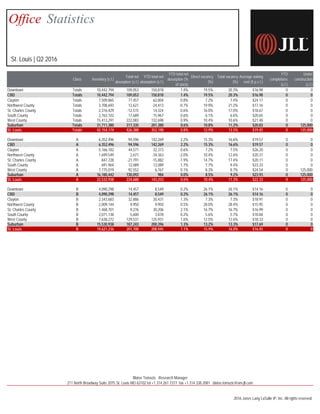
2) Vacancy rates have fallen below 14% for the first time since 2008 due to several large lease expansions. Class A suburban vacancy has hit single digits.
3) Large blocks of Class A office space remain scarce due to limited new construction supply, restricting options for tenants seeking over 50,000 square feet.
2. Job growth (12-month change): United States vs. St. Louis
Source: JLL Research, BLS
Total vacancy by submarket
Source: JLL Research
Class A large blocks
Source: JLL Research
Market hits lowest vacancy rate since 2008
2,257
20.3%
7.4%
21.2%
17.0%
6.6%
10.6% 11.2%
0%
10%
20%
30%
CBD Clayton Northwest
County
St.
Charles
County
South
County
West
County
Suburban
3
4
1
7
1
2
0
4
8
12
25,000 - 50,000 s.f. 50,000 - 100,000 s.f. > 100,000 s.f.
#ofblocks
CBD Suburbs
Office Insight
St. Louis | Q2 2016
42,154,174
Total inventory (s.f.)
426,388
Q2 2016 net absorption (s.f.)
$19.45
Direct average asking rent
125,000
Total under construction (s.f.)
13.5%
Total vacancy
352,198
YTD net absorption (s.f.)
-2.0%
12-month rent growth
60.0%
Total preleased
Job growth catches up with national pace
After steadily lagging U.S. job growth for the past four years, St. Louis has
accelerated and is now on par with the nation. With the unemployment rate at 4.5
percent, the number of people employed in the region is at an all-time high. The
two largest office occupying sectors, financial activities and professional and
business services (PBS) posted annual gains of 4.2 percent and 3.3 percent,
respectively. Like the rest of the region, both sectors are at all-time high
employment. There has been some consequences to this. According to Federal
Reserve data, one-third of contacts in a recent survey “currently do not have
enough qualified candidates from which to choose.”
Single-digit vacancy the norm in certain submarkets
As we anticipated in the first quarter, leasing activity from the previous year has
brought further reduction in the vacancy rate. With several large lease
expansions commencing from Centene, Nestlé Purina, Clarkson Eye Care, and
Varsity Tutors, total vacancy is below 14.0 percent for the first time since 2008.
Centene has been a big contributor with approximately 300,000 square feet of
expansions across the market. The Class A market remains very tight, as the
Class A suburban market has hit single-digit vacancy—a lack of new supply is
restricting options for tenants.
Large blocks of space remain in short supply
As the market continues to increase occupancy, quality Class A blocks of space
remain in short supply. While some future vacancies are on the horizon
(Hardees, Brado, and ADP) options for tenants in the market for more than
50,000 square feet are limited. With just one building under construction (Delmar
Gardens III), it begs the question when another will break ground. Several
projects are proposed in Clayton, including Centene’s massive corporate
expansion, but that is several years off. The lack of space has contributed to
companies such as World Wide Technology and Bunge choosing build-to-suit
projects over existing product. Enterprise Holdings took things a step further,
purchasing two buildings in Maryland Heights to accommodate future growth.
One building was vacant, and the other is occupied by Monsanto.
-1.0%
0.0%
1.0%
2.0%
3.0%
2011 2012 2013 2014 2015 2016
St. Louis United States
4. Office Leasing Activity Report
St. Louis
Q2 2016
This report analyzes all closed office leases > 10,000 s.f.
Leasing activity by size
479,430
15
909,503
33
370,603
108,827
-
Growing Shrinking Stable
258,389
0
210,041
11,000
0
0
Top 10 lease transactions during the quarter
Size Footprint Term (mos)
150,000 Growing 0
70,881 Stable 0
45,807 Stable 0
27,850 Shrinking 0
23,514 Stable 0
22,414 Shrinking 0
22,040 Shrinking 0
18,000 Stable 0
17,467 Stable 0
17,000 Growing 0
Leasing activity by submarketLeasing activity by industry
Total Class A s.f. leased
Expansion in market
Expansion in building
Renewal
Extension (< 36-month term)
Relocation within market
New to market
Average term (mos)
Total Class B s.f. leased
Direct
575 Maryville Centre Dr West County
At a glance
Total s.f. leased QTD
Total transactions QTD
Total s.f. leased YTD
Tenant footprint
3 3 7
Total transactions YTD
Leasing activity by transaction type
Type
Outer Forty Rd West County DirectBunge
Tenant Address Submarket
Direct
1831 Chestnut CBD Direct
12101 Woodcrest Executive Dr West County
1390 Timberlake Manor Pky West CountyAmdocs
Savvis
Momentum
Mpower Communications
Direct
Deloitte 100 S 4th St CBD Direct
Direct
BizLibrary 14500 S Outer 40 Rd West County Direct
USI 308 N 21st St CBD Direct
Capes, Sokol 7701 Forsyth Blvd Clayton Direct
ADP 12200 Weber Hill Rd South County
1 - 1 1 12
-
50,000
100,000
150,000
200,000
250,000
100,000+ 75,000-99,999 50,000-74,999 30,000-49,999 20,000-29,999
Total leased Number of leases
60.00%
6.67%
13.33%
20.00%
West County South County Clayton CBD
6.67%
26.67%
6.67%
6.67%13.33%
6.67%
6.67%
6.67%
13.33%
6.67%
Law firm
Other professional and business services
Other
Accounting consulting research strategy
Insurance
Marketing advertising communications PR
Banking and financial services
250,000
300,000
350,000
400,000
450,000
500,000
Q3 2015 Q4 2015 Q1 2016 Q2 2016
Historical leasing activity
Source: JLL Research 2015 Jones Lang LaSalle IP, Inc. All rights reserved.
5. Office Statistics
St. Louis | Q2 2016
Class Inventory (s.f.)
Total net
absorption (s.f.)
YTD total net
absorption (s.f.)
YTD total net
absorption (%
of stock)
Direct vacancy
(%)
Total vacancy
(%)
Average asking
rent ($ p.s.f.)
YTD
completions
(s.f.)
Under
construction
(s.f.)
Downtown Totals 10,442,794 109,053 150,818 1.4% 19.5% 20.3% $16.98 0 0
CBD Totals 10,442,794 109,053 150,818 1.4% 19.5% 20.3% $16.98 0 0
Clayton Totals 7,509,865 77,457 62,804 0.8% 7.2% 7.4% $24.17 0 0
Northwest County Totals 3,708,693 12,621 -24,413 -0.7% 19.9% 21.2% $17.16 0 0
St. Charles County Totals 2,316,429 -12,515 14,324 0.6% 16.0% 17.0% $18.67 0 0
South County Totals 2,763,102 17,689 15,967 0.6% 6.1% 6.6% $20.65 0 0
West County Totals 15,413,291 222,083 132,698 0.9% 10.4% 10.6% $21.48 0 0
Suburban Totals 31,711,380 317,335 201,380 0.6% 10.8% 11.2% $20.83 0 125,000
St. Louis Totals 42,154,174 426,388 352,198 0.8% 12.9% 13.5% $19.45 0 125,000
Downtown A 6,352,496 94,596 142,269 2.2% 15.3% 16.6% $19.57 0 0
CBD A 6,352,496 94,596 142,269 2.2% 15.3% 16.6% $19.57 0 0
Clayton A 5,166,182 44,571 32,373 0.6% 7.2% 7.5% $26.20 0 0
Northwest County A 1,699,549 2,671 -34,363 -2.0% 10.4% 12.6% $20.31 0 0
St. Charles County A 847,728 -21,791 -15,882 -1.9% 14.7% 17.4% $20.11 0 0
South County A 691,964 12,089 12,089 1.7% 7.7% 9.4% $23.33 0 0
West County A 7,775,019 92,552 6,767 0.1% 8.3% 8.7% $24.54 0 125,000
Suburban A 16,180,442 130,092 984 0.0% 8.5% 9.2% $23.93 0 125,000
St. Louis A 22,532,938 224,688 143,253 0.6% 10.4% 11.3% $22.33 0 125,000
Downtown B 4,090,298 14,457 8,549 0.2% 26.1% 26.1% $14.16 0 0
CBD B 4,090,298 14,457 8,549 0.2% 26.1% 26.1% $14.16 0 0
Clayton B 2,343,683 32,886 30,431 1.3% 7.3% 7.3% $18.91 0 0
Northwest County B 2,009,144 9,950 9,950 0.5% 28.0% 28.4% $15.95 0 0
St. Charles County B 1,468,701 9,276 30,206 2.1% 16.7% 16.7% $16.99 0 0
South County B 2,071,138 5,600 3,878 0.2% 5.6% 5.7% $18.84 0 0
West County B 7,638,272 129,531 125,931 1.6% 12.5% 12.6% $18.33 0 0
Suburban B 15,530,938 187,243 200,396 1.3% 13.2% 13.3% $17.69 0 0
St. Louis B 19,621,236 201,700 208,945 1.1% 15.9% 16.0% $16.45 0 0
211 North Broadway Suite 2075 St. Louis MO 63102 tel +1 314 261 7377 fax +1 314 338 2081 blaise.tomazic@am.jll.com
2016 Jones Lang LaSalle IP, Inc. All rights reserved.
Blaise Tomazic Research Manager
6. Office employment trends (12-month change) :St. Louis
Source: BLS, JLL Research
Job growth (12-month change): United States vs. St. Louis
Source: BLS, JLL Research
Total jobs vs. unemployment rate: St. Louis
Source: BLS, JLL Research
Industrial employment trends (12-month change) :St. Louis
Source: BLS, JLL Research
Job growth/loss by sector (12-month change): St. Louis
Source: BLS, JLL Research
Employment Update
Metro St. Louis | June 2016
3.1%
4.5%U.S. unemployment
1.7%U.S. 12-month job growth
4.5%St. Louis unemployment
1.8%St. Louis 12-month job growth
4.2%Missouri unemployment
1.0%Missouri 12-month job growth
0.0%
2.0%
4.0%
6.0%
8.0%
10.0%
12.0%
1,220,000
1,240,000
1,260,000
1,280,000
1,300,000
1,320,000
1,340,000
1,360,000
1,380,000
1,400,000
1,420,000
Total Employment
Unemployment
Peak: 1,427,712 jobs
-2,600
-900
100
300
600
2,000
2,800
6,000
7,900
8,600
Manufacturing
Information
Mining, Logging & Construction
Government
Other Services
Trade, Transportation & Utilities
Financial Activities
Educational & Health Services
Leisure & Hospitality
Professional & Business Services
(10)
(5)
0
5
10
15
2011 2012 2013 2014 2015 2016
Financial Activities
Professional and Business Services
Information
Government
(15)
(10)
(5)
0
5
10
15
2011 2012 2013 2014 2015 2016
Mining, Logging & Construction
Trade, Transportation & Utilities
Manufacturing
Other Services
-1.0%
0.0%
1.0%
2.0%
3.0%
2011 2012 2013 2014 2015 2016
St. Louis United States