SlideShare a Scribd company logo
1 of 2
Download to read offline
© 2020 Jones Lang LaSalle IP, Inc. All rights reserved. All information contained herein is from sources deemed reliable; however, no representation or warranty is made to the accuracy thereof.
Q2 2020
Pittsburgh
Office Insight
Across the country, available sublease space is increasing. COVID-19 and the
move towards working remote has had a profound impact on the U.S. office
market. In Pittsburgh, the impact is noticeable, but not as severe. Less than
1.0 percent of the office inventory was made available through subleases in
the second quarter.
Although leasing activity declined in April and May, June showed a return
towards normal levels. As construction restrictions were lifted, several
speculative office projects in Pittsburgh resumed. The Vision on Fifteenth and
Liberty East both began site preparation, while Walnut Capital began
demolition of the existing buildings on the Innovation District site in Oakland.
Outlook
Absorption for the second quarter was negative by more than 500,000 square
feet due to several large blocks of sublease space becoming available, as well
as leasing activity taking a pause. But as construction picks back up and the
region moves towards the next normal, leasing activity is expected to
rebound.
Local investors are still bullish on the Pittsburgh market as Burns and Scalo,
LG Realty, and Walnut Capital continue development on the three largest
speculative office projects in the region. Demand is still evident for the new
construction projects as tenants emphasize a need for higher levels of safety
due to COVID-19. Touchless technologies and upgraded mechanicals are top-
of-mind, and landlords are adjusting accordingly. As the summer continues,
re-entry strategies will be implemented and the economy will regain some
footing. While this year may lag previous years due to uncontrollable
variables, Pittsburgh’s foundation remains strong and a recovery is not far
away.
Fundamentals Forecast
YTD net absorption -308,955 s.f. ▲
Under construction 1,941,708 s.f. ▶
Total vacancy 18.3% ▼
Sublease vacancy 1,354,142 s.f. ▲
Direct asking rent $25.46 p.s.f. ▶
Sublease asking rent $20.81 p.s.f. ▶
Concessions Increasing ▲
-1,000,000
0
1,000,000
2016 2017 2018 2019 YTD
2020
Supply and demand (s.f.) Net absorption
Deliveries
Sublease availability increases as the early impacts of
COVID-19 become apparent
12%
14%
16%
18%
20%
2006 2008 2010 2012 2014 2016 2018 2020
Total vacancy
For more information, contact: Justin Simakas | justin.simakas@am.jll.com
• Leasing slowed in the first two months of the second quarter, but activity
showed signs of return in June. Renewals saw a noticeable uptick.
• Construction resumed in May as regulations eased across the state.
Several speculative office buildings are currently under construction.
• UPMC and EQT among several large sublease availabilities added.
Additional sublease space is likely to be added in the coming quarters.
$10
$15
$20
$25
$30
2006 2008 2010 2012 2014 2016 2018 2020
Average asking rent ($ p.s.f.) Direct
Sublease
The health, policy, economic and financialdisruption stemming from the COVID-19 pandemic continues to
create a fluid and evolving environment for the office market. Although data from Q2 is providing greater
clarity about conditions and the short-term real estate outlook, there remains significant uncertainty
surrounding market dynamics and long-term trajectories and, as a result, we will continue to monitor
fundamentalsclosely as the situation unfolds. Please feel free to contact us if we can assist.
© 2020 Jones Lang LaSalle IP, Inc. All rights reserved. All information contained herein is from sources deemed reliable; however, no representation or warranty is made to the accuracy thereof.
Class
Inventory
(s.f.)
Total net
absorption
(s.f.)
YTD total net
absorption
(s.f.)
YTD total net
absorption (%
of stock)
Direct
vacancy (%)
Total
vacancy (%)
Average
direct asking
rent ($ p.s.f.)
YTD
Completions
(s.f.)
Under
Development
(s.f.)
Northern I-79 / Cranberry Totals 4,376,907 5,577 106,081 2.4% 15.0% 21.0% $25.75 0 0
East Totals 3,053,814 -56,532 -35,774 -1.2% 26.1% 26.4% $20.13 0 0
North Totals 3,751,808 -71,273 -109,279 -2.9% 12.9% 13.5% $19.33 0 0
South Totals 2,311,420 -41,091 -14,121 -0.6% 14.1% 14.2% $20.15 0 140,000
Southpointe Totals 2,972,107 -8,184 -11,978 -0.4% 16.7% 19.5% $21.57 0 40,000
West Totals 7,229,171 -131,194 -73,032 -1.0% 17.4% 20.9% $22.00 0 220,000
Suburban Totals 23,695,227 -302,697 -138,103 -0.6% 17.0% 19.7% $21.67 0 400,000
CBD Totals 18,969,985 -244,900 -273,241 -1.4% 16.1% 18.3% $27.87 0 0
Fringe Totals 8,715,084 -32,640 106,542 1.2% 14.9% 18.4% $29.01 214,671 648,737
Oakland / East End Totals 2,334,209 -9,059 -4,153 -0.2% 4.4% 4.4% $35.72 0 892,971
Urban Totals 30,019,278 -286,599 -170,852 -0.6% 14.9% 17.3% $28.54 214,671 1,541,708
Pittsburgh Totals 53,714,505 -589,296 -308,955 -0.6% 15.8% 18.3% $25.46 214,671 1,941,708
Northern I-79 / Cranberry A 3,691,749 -10,935 93,582 2.5% 14.0% 21.2% $26.46 0 0
East A 1,580,784 -52,639 -32,220 -2.0% 31.1% 31.5% $21.46 0 0
North A 809,347 -15,618 -4,321 -0.5% 11.1% 11.3% $23.84 0 0
South A 0 0 0 0.0% 0.0% 0.0% $0.00 0 140,000
Southpointe A 1,909,754 -61,505 -57,893 -3.0% 10.1% 13.9% $22.97 0 40,000
West A 3,943,914 -88,831 -67,566 -1.7% 13.7% 18.6% $24.24 0 220,000
Suburban A 11,935,548 -229,528 -68,418 -0.6% 15.3% 19.9% $23.93 0 400,000
CBD A 13,498,998 -253,980 -315,733 -2.3% 15.4% 18.3% $30.42 0 0
Fringe A 2,880,141 -872 103,394 3.6% 8.0% 12.0% $36.96 214,671 648,737
Oakland / East End A 1,149,696 4,133 6,272 0.5% 6.4% 6.4% $38.35 0 892,971
Urban A 17,528,835 -250,719 -206,067 -1.2% 13.6% 16.5% $32.27 214,671 1,541,708
Pittsburgh A 29,464,383 -480,247 -274,485 -0.9% 14.3% 17.8% $28.97 214,671 1,941,708
Northern I-79 / Cranberry B 685,158 16,512 12,499 1.8% 20.4% 20.4% $22.38 0 0
East B 1,473,030 -3,893 -3,554 -0.2% 20.7% 21.1% $17.84 0 0
North B 2,942,461 -55,655 -104,958 -3.6% 13.4% 14.0% $17.92 0 0
South B 2,311,420 -41,091 -14,121 -0.6% 14.1% 14.2% $20.15 0 0
Southpointe B 1,062,353 53,321 45,915 4.3% 28.7% 29.7% $20.71 0 0
West B 3,285,257 -42,363 -5,466 -0.2% 21.9% 23.7% $20.47 0 0
Suburban B 11,759,679 -73,169 -69,685 -0.6% 18.6% 19.4% $19.75 0 0
CBD B 5,470,987 9,080 42,492 0.8% 18.0% 18.4% $22.85 0 0
Fringe B 5,834,943 -31,768 3,148 0.1% 18.3% 21.6% $24.47 0 0
Oakland / East End B 1,184,513 -13,192 -10,425 -0.9% 2.5% 2.5% $22.71 0 0
Urban B 12,490,443 -35,880 35,215 0.3% 16.7% 18.4% $23.66 0 0
Pittsburgh B 24,250,122 -109,049 -34,470 -0.1% 17.6% 18.9% $21.69 0 0
Q2 2020
Office Statistics
Pittsburgh
For more information, contact: Justin Simakas | justin.simakas@am.jll.com

More Related Content

What's hot

JLL Pittsburgh Office Insight & Statistics - Q3 2018
JLL Pittsburgh Office Insight & Statistics - Q3 2018JLL Pittsburgh Office Insight & Statistics - Q3 2018
JLL Pittsburgh Office Insight & Statistics - Q3 2018Tobiah Bilski
 
JLL Pittsburgh Office Insight & Statistics - Q4 2017
JLL Pittsburgh Office Insight & Statistics - Q4 2017JLL Pittsburgh Office Insight & Statistics - Q4 2017
JLL Pittsburgh Office Insight & Statistics - Q4 2017Tobiah Bilski
 
JLL Pittsburgh Office Insight & Statistics - Q4 2019
JLL Pittsburgh Office Insight & Statistics - Q4 2019JLL Pittsburgh Office Insight & Statistics - Q4 2019
JLL Pittsburgh Office Insight & Statistics - Q4 2019Tobiah Bilski
 
JLL Detroit Office Insight & Statistics – Q2 2016
JLL Detroit Office Insight & Statistics – Q2 2016JLL Detroit Office Insight & Statistics – Q2 2016
JLL Detroit Office Insight & Statistics – Q2 2016Aaron Moore
 
JLL Pittsburgh Office Insight & Statistics - Q3 2019
 JLL Pittsburgh Office Insight & Statistics - Q3 2019 JLL Pittsburgh Office Insight & Statistics - Q3 2019
JLL Pittsburgh Office Insight & Statistics - Q3 2019Tobiah Bilski
 
Q1 2017 - Chicago Suburbs Office Reports
Q1 2017 - Chicago Suburbs Office ReportsQ1 2017 - Chicago Suburbs Office Reports
Q1 2017 - Chicago Suburbs Office ReportsHailey Harrington
 
JLL Pittsburgh Office Insight & Statistics - Q1 2019
JLL Pittsburgh Office Insight & Statistics - Q1 2019JLL Pittsburgh Office Insight & Statistics - Q1 2019
JLL Pittsburgh Office Insight & Statistics - Q1 2019Tobiah Bilski
 
JLL Grand Rapids Office Insight & Statistics - Q4 2019
JLL Grand Rapids Office Insight & Statistics - Q4 2019JLL Grand Rapids Office Insight & Statistics - Q4 2019
JLL Grand Rapids Office Insight & Statistics - Q4 2019Harrison West
 
JLL Cleveland Office Outlook: Q3 2020
JLL Cleveland Office Outlook: Q3 2020JLL Cleveland Office Outlook: Q3 2020
JLL Cleveland Office Outlook: Q3 2020Andrew Batson
 
JLL Cincinnati Office Outlook Q4 2020
JLL Cincinnati Office Outlook Q4 2020JLL Cincinnati Office Outlook Q4 2020
JLL Cincinnati Office Outlook Q4 2020Abby Armbruster
 
Cushman & Wakefield Montreal Americas Marketbeat Office Q12019 #CRE #RealEstate
Cushman & Wakefield Montreal Americas Marketbeat Office Q12019  #CRE #RealEstateCushman & Wakefield Montreal Americas Marketbeat Office Q12019  #CRE #RealEstate
Cushman & Wakefield Montreal Americas Marketbeat Office Q12019 #CRE #RealEstateGuy Masse
 
JLL Louisville Office Outlook - Q2 2018
JLL Louisville Office Outlook - Q2 2018JLL Louisville Office Outlook - Q2 2018
JLL Louisville Office Outlook - Q2 2018Alex Westcott
 
St. Louis Office Outlook Q3 2016
St. Louis Office Outlook Q3 2016St. Louis Office Outlook Q3 2016
St. Louis Office Outlook Q3 2016Blaise Tomazic
 
JLL Detroit Office Insight & Statistics - Q1 2018
JLL Detroit Office Insight & Statistics - Q1 2018JLL Detroit Office Insight & Statistics - Q1 2018
JLL Detroit Office Insight & Statistics - Q1 2018Harrison West
 
JLL Detroit Office Insight & Statistics - Q2 2017
JLL Detroit Office Insight & Statistics - Q2 2017JLL Detroit Office Insight & Statistics - Q2 2017
JLL Detroit Office Insight & Statistics - Q2 2017Harrison West
 
JLL Cincinnati Office Insight & Statistics - Q2 2016
JLL Cincinnati Office Insight & Statistics - Q2 2016JLL Cincinnati Office Insight & Statistics - Q2 2016
JLL Cincinnati Office Insight & Statistics - Q2 2016Ross Bratcher
 
JLL Detroit Office Insight & Statistics - Q3 2018
JLL Detroit Office Insight & Statistics - Q3 2018JLL Detroit Office Insight & Statistics - Q3 2018
JLL Detroit Office Insight & Statistics - Q3 2018Harrison West
 
Q4 2014 San Francisco Office Report
Q4 2014 San Francisco Office ReportQ4 2014 San Francisco Office Report
Q4 2014 San Francisco Office ReportCoy Davidson
 
Tampa Bay 2018 Q1 Office Outlook
Tampa Bay 2018 Q1 Office OutlookTampa Bay 2018 Q1 Office Outlook
Tampa Bay 2018 Q1 Office OutlookKyle Koller
 

What's hot (20)

JLL Pittsburgh Office Insight & Statistics - Q3 2018
JLL Pittsburgh Office Insight & Statistics - Q3 2018JLL Pittsburgh Office Insight & Statistics - Q3 2018
JLL Pittsburgh Office Insight & Statistics - Q3 2018
 
JLL Pittsburgh Office Insight & Statistics - Q4 2017
JLL Pittsburgh Office Insight & Statistics - Q4 2017JLL Pittsburgh Office Insight & Statistics - Q4 2017
JLL Pittsburgh Office Insight & Statistics - Q4 2017
 
JLL Pittsburgh Office Insight & Statistics - Q4 2019
JLL Pittsburgh Office Insight & Statistics - Q4 2019JLL Pittsburgh Office Insight & Statistics - Q4 2019
JLL Pittsburgh Office Insight & Statistics - Q4 2019
 
JLL Detroit Office Insight & Statistics – Q2 2016
JLL Detroit Office Insight & Statistics – Q2 2016JLL Detroit Office Insight & Statistics – Q2 2016
JLL Detroit Office Insight & Statistics – Q2 2016
 
JLL Pittsburgh Office Insight & Statistics - Q3 2019
 JLL Pittsburgh Office Insight & Statistics - Q3 2019 JLL Pittsburgh Office Insight & Statistics - Q3 2019
JLL Pittsburgh Office Insight & Statistics - Q3 2019
 
Q1 2017 - Chicago Suburbs Office Reports
Q1 2017 - Chicago Suburbs Office ReportsQ1 2017 - Chicago Suburbs Office Reports
Q1 2017 - Chicago Suburbs Office Reports
 
JLL Pittsburgh Office Insight & Statistics - Q1 2019
JLL Pittsburgh Office Insight & Statistics - Q1 2019JLL Pittsburgh Office Insight & Statistics - Q1 2019
JLL Pittsburgh Office Insight & Statistics - Q1 2019
 
JLL Grand Rapids Office Insight & Statistics - Q4 2019
JLL Grand Rapids Office Insight & Statistics - Q4 2019JLL Grand Rapids Office Insight & Statistics - Q4 2019
JLL Grand Rapids Office Insight & Statistics - Q4 2019
 
JLL Cleveland Office Outlook: Q3 2020
JLL Cleveland Office Outlook: Q3 2020JLL Cleveland Office Outlook: Q3 2020
JLL Cleveland Office Outlook: Q3 2020
 
JLL Cincinnati Office Outlook Q4 2020
JLL Cincinnati Office Outlook Q4 2020JLL Cincinnati Office Outlook Q4 2020
JLL Cincinnati Office Outlook Q4 2020
 
Cushman & Wakefield Montreal Americas Marketbeat Office Q12019 #CRE #RealEstate
Cushman & Wakefield Montreal Americas Marketbeat Office Q12019  #CRE #RealEstateCushman & Wakefield Montreal Americas Marketbeat Office Q12019  #CRE #RealEstate
Cushman & Wakefield Montreal Americas Marketbeat Office Q12019 #CRE #RealEstate
 
JLL Louisville Office Outlook - Q2 2018
JLL Louisville Office Outlook - Q2 2018JLL Louisville Office Outlook - Q2 2018
JLL Louisville Office Outlook - Q2 2018
 
JLL Houston 2018 Q1 Office Market Report
JLL Houston 2018 Q1 Office Market ReportJLL Houston 2018 Q1 Office Market Report
JLL Houston 2018 Q1 Office Market Report
 
St. Louis Office Outlook Q3 2016
St. Louis Office Outlook Q3 2016St. Louis Office Outlook Q3 2016
St. Louis Office Outlook Q3 2016
 
JLL Detroit Office Insight & Statistics - Q1 2018
JLL Detroit Office Insight & Statistics - Q1 2018JLL Detroit Office Insight & Statistics - Q1 2018
JLL Detroit Office Insight & Statistics - Q1 2018
 
JLL Detroit Office Insight & Statistics - Q2 2017
JLL Detroit Office Insight & Statistics - Q2 2017JLL Detroit Office Insight & Statistics - Q2 2017
JLL Detroit Office Insight & Statistics - Q2 2017
 
JLL Cincinnati Office Insight & Statistics - Q2 2016
JLL Cincinnati Office Insight & Statistics - Q2 2016JLL Cincinnati Office Insight & Statistics - Q2 2016
JLL Cincinnati Office Insight & Statistics - Q2 2016
 
JLL Detroit Office Insight & Statistics - Q3 2018
JLL Detroit Office Insight & Statistics - Q3 2018JLL Detroit Office Insight & Statistics - Q3 2018
JLL Detroit Office Insight & Statistics - Q3 2018
 
Q4 2014 San Francisco Office Report
Q4 2014 San Francisco Office ReportQ4 2014 San Francisco Office Report
Q4 2014 San Francisco Office Report
 
Tampa Bay 2018 Q1 Office Outlook
Tampa Bay 2018 Q1 Office OutlookTampa Bay 2018 Q1 Office Outlook
Tampa Bay 2018 Q1 Office Outlook
 

Similar to JLL Pittsburgh Office Insight & Statistics - Q2 2020

JLL Pittsburgh Office Insight & Statistics - Q1 2020
JLL Pittsburgh Office Insight & Statistics - Q1 2020JLL Pittsburgh Office Insight & Statistics - Q1 2020
JLL Pittsburgh Office Insight & Statistics - Q1 2020Tobiah Bilski
 
JLL West Michigan Industrial Insight & Statistics - Q1 2020
JLL West Michigan Industrial Insight & Statistics - Q1 2020JLL West Michigan Industrial Insight & Statistics - Q1 2020
JLL West Michigan Industrial Insight & Statistics - Q1 2020Harrison West
 
Pittsburgh Office Insight & Stats Q4 2021
Pittsburgh Office Insight & Stats Q4 2021Pittsburgh Office Insight & Stats Q4 2021
Pittsburgh Office Insight & Stats Q4 2021Tobiah Bilski
 
JLL Pittsburgh Industrial Insight & Statistics - Q2 2020
JLL Pittsburgh Industrial Insight & Statistics - Q2 2020JLL Pittsburgh Industrial Insight & Statistics - Q2 2020
JLL Pittsburgh Industrial Insight & Statistics - Q2 2020Tobiah Bilski
 
JLL Pittsburgh Office Insight & Statistics - Q3 2021
JLL Pittsburgh Office Insight & Statistics - Q3 2021JLL Pittsburgh Office Insight & Statistics - Q3 2021
JLL Pittsburgh Office Insight & Statistics - Q3 2021Tobiah Bilski
 
JLL Cincinnati Office Outlook Q2 2020
JLL Cincinnati Office Outlook Q2 2020JLL Cincinnati Office Outlook Q2 2020
JLL Cincinnati Office Outlook Q2 2020Abby Armbruster
 
Pittsburgh Office Insight & Stats Q1 2022
Pittsburgh Office Insight & Stats Q1 2022Pittsburgh Office Insight & Stats Q1 2022
Pittsburgh Office Insight & Stats Q1 2022Tobiah Bilski
 
JLL Pittsburgh Industrial Insight & Statistics - Q1 2020
JLL Pittsburgh Industrial Insight & Statistics - Q1 2020JLL Pittsburgh Industrial Insight & Statistics - Q1 2020
JLL Pittsburgh Industrial Insight & Statistics - Q1 2020Tobiah Bilski
 
Q2 2023 Pittsburgh Office Insight & Stats
Q2 2023 Pittsburgh Office Insight & StatsQ2 2023 Pittsburgh Office Insight & Stats
Q2 2023 Pittsburgh Office Insight & StatsCaitlin Fadgen
 
JLL Cincinnati Industrial Outlook Q4 2020
JLL Cincinnati Industrial Outlook Q4 2020JLL Cincinnati Industrial Outlook Q4 2020
JLL Cincinnati Industrial Outlook Q4 2020Abby Armbruster
 
JLL Cleveland Office Outlook: Q2 2018
JLL Cleveland Office Outlook: Q2 2018JLL Cleveland Office Outlook: Q2 2018
JLL Cleveland Office Outlook: Q2 2018Andrew Batson
 
Jll cincinnati office outlook q2 2017
Jll cincinnati office outlook   q2 2017Jll cincinnati office outlook   q2 2017
Jll cincinnati office outlook q2 2017Abby Armbruster
 
JLL Grand Rapids Office Insight & Statistics - Q2 2018
JLL Grand Rapids Office Insight & Statistics - Q2 2018JLL Grand Rapids Office Insight & Statistics - Q2 2018
JLL Grand Rapids Office Insight & Statistics - Q2 2018Harrison West
 
JLL Pittsburgh Office Insight & Statistics - Q1 2017
JLL Pittsburgh Office Insight & Statistics - Q1 2017JLL Pittsburgh Office Insight & Statistics - Q1 2017
JLL Pittsburgh Office Insight & Statistics - Q1 2017Tobiah Bilski
 
Broward County Office Outlook - Q4 2018
Broward County Office Outlook - Q4 2018Broward County Office Outlook - Q4 2018
Broward County Office Outlook - Q4 2018JLL Florida
 
JLL Grand Rapids Office Insight & Statistics - Q3 2018
JLL Grand Rapids Office Insight & Statistics - Q3 2018JLL Grand Rapids Office Insight & Statistics - Q3 2018
JLL Grand Rapids Office Insight & Statistics - Q3 2018Harrison West
 
JLL Cincinnati Industrial Outlook Q3 2020
JLL Cincinnati Industrial Outlook Q3 2020JLL Cincinnati Industrial Outlook Q3 2020
JLL Cincinnati Industrial Outlook Q3 2020Abby Armbruster
 
JLL Pittsburgh Office Insight & Statistics - Q3 2017
JLL Pittsburgh Office Insight & Statistics - Q3 2017JLL Pittsburgh Office Insight & Statistics - Q3 2017
JLL Pittsburgh Office Insight & Statistics - Q3 2017Tobiah Bilski
 
JLL Columbus Office Outlook - Q4 2020
JLL Columbus Office Outlook - Q4 2020JLL Columbus Office Outlook - Q4 2020
JLL Columbus Office Outlook - Q4 2020Emma Gresky
 
JLL Pittsburgh Industrial Insight & Statistics - Q4 2019
JLL Pittsburgh Industrial Insight & Statistics - Q4 2019JLL Pittsburgh Industrial Insight & Statistics - Q4 2019
JLL Pittsburgh Industrial Insight & Statistics - Q4 2019Tobiah Bilski
 

Similar to JLL Pittsburgh Office Insight & Statistics - Q2 2020 (20)

JLL Pittsburgh Office Insight & Statistics - Q1 2020
JLL Pittsburgh Office Insight & Statistics - Q1 2020JLL Pittsburgh Office Insight & Statistics - Q1 2020
JLL Pittsburgh Office Insight & Statistics - Q1 2020
 
JLL West Michigan Industrial Insight & Statistics - Q1 2020
JLL West Michigan Industrial Insight & Statistics - Q1 2020JLL West Michigan Industrial Insight & Statistics - Q1 2020
JLL West Michigan Industrial Insight & Statistics - Q1 2020
 
Pittsburgh Office Insight & Stats Q4 2021
Pittsburgh Office Insight & Stats Q4 2021Pittsburgh Office Insight & Stats Q4 2021
Pittsburgh Office Insight & Stats Q4 2021
 
JLL Pittsburgh Industrial Insight & Statistics - Q2 2020
JLL Pittsburgh Industrial Insight & Statistics - Q2 2020JLL Pittsburgh Industrial Insight & Statistics - Q2 2020
JLL Pittsburgh Industrial Insight & Statistics - Q2 2020
 
JLL Pittsburgh Office Insight & Statistics - Q3 2021
JLL Pittsburgh Office Insight & Statistics - Q3 2021JLL Pittsburgh Office Insight & Statistics - Q3 2021
JLL Pittsburgh Office Insight & Statistics - Q3 2021
 
JLL Cincinnati Office Outlook Q2 2020
JLL Cincinnati Office Outlook Q2 2020JLL Cincinnati Office Outlook Q2 2020
JLL Cincinnati Office Outlook Q2 2020
 
Pittsburgh Office Insight & Stats Q1 2022
Pittsburgh Office Insight & Stats Q1 2022Pittsburgh Office Insight & Stats Q1 2022
Pittsburgh Office Insight & Stats Q1 2022
 
JLL Pittsburgh Industrial Insight & Statistics - Q1 2020
JLL Pittsburgh Industrial Insight & Statistics - Q1 2020JLL Pittsburgh Industrial Insight & Statistics - Q1 2020
JLL Pittsburgh Industrial Insight & Statistics - Q1 2020
 
Q2 2023 Pittsburgh Office Insight & Stats
Q2 2023 Pittsburgh Office Insight & StatsQ2 2023 Pittsburgh Office Insight & Stats
Q2 2023 Pittsburgh Office Insight & Stats
 
JLL Cincinnati Industrial Outlook Q4 2020
JLL Cincinnati Industrial Outlook Q4 2020JLL Cincinnati Industrial Outlook Q4 2020
JLL Cincinnati Industrial Outlook Q4 2020
 
JLL Cleveland Office Outlook: Q2 2018
JLL Cleveland Office Outlook: Q2 2018JLL Cleveland Office Outlook: Q2 2018
JLL Cleveland Office Outlook: Q2 2018
 
Jll cincinnati office outlook q2 2017
Jll cincinnati office outlook   q2 2017Jll cincinnati office outlook   q2 2017
Jll cincinnati office outlook q2 2017
 
JLL Grand Rapids Office Insight & Statistics - Q2 2018
JLL Grand Rapids Office Insight & Statistics - Q2 2018JLL Grand Rapids Office Insight & Statistics - Q2 2018
JLL Grand Rapids Office Insight & Statistics - Q2 2018
 
JLL Pittsburgh Office Insight & Statistics - Q1 2017
JLL Pittsburgh Office Insight & Statistics - Q1 2017JLL Pittsburgh Office Insight & Statistics - Q1 2017
JLL Pittsburgh Office Insight & Statistics - Q1 2017
 
Broward County Office Outlook - Q4 2018
Broward County Office Outlook - Q4 2018Broward County Office Outlook - Q4 2018
Broward County Office Outlook - Q4 2018
 
JLL Grand Rapids Office Insight & Statistics - Q3 2018
JLL Grand Rapids Office Insight & Statistics - Q3 2018JLL Grand Rapids Office Insight & Statistics - Q3 2018
JLL Grand Rapids Office Insight & Statistics - Q3 2018
 
JLL Cincinnati Industrial Outlook Q3 2020
JLL Cincinnati Industrial Outlook Q3 2020JLL Cincinnati Industrial Outlook Q3 2020
JLL Cincinnati Industrial Outlook Q3 2020
 
JLL Pittsburgh Office Insight & Statistics - Q3 2017
JLL Pittsburgh Office Insight & Statistics - Q3 2017JLL Pittsburgh Office Insight & Statistics - Q3 2017
JLL Pittsburgh Office Insight & Statistics - Q3 2017
 
JLL Columbus Office Outlook - Q4 2020
JLL Columbus Office Outlook - Q4 2020JLL Columbus Office Outlook - Q4 2020
JLL Columbus Office Outlook - Q4 2020
 
JLL Pittsburgh Industrial Insight & Statistics - Q4 2019
JLL Pittsburgh Industrial Insight & Statistics - Q4 2019JLL Pittsburgh Industrial Insight & Statistics - Q4 2019
JLL Pittsburgh Industrial Insight & Statistics - Q4 2019
 

More from Tobiah Bilski

JLL Pittsburgh Industrial Insight & Statistics - Q4 2021
JLL Pittsburgh Industrial Insight & Statistics - Q4 2021JLL Pittsburgh Industrial Insight & Statistics - Q4 2021
JLL Pittsburgh Industrial Insight & Statistics - Q4 2021Tobiah Bilski
 
JLL Pittsburgh Industrial Insight & Statistics - Q3 2021
JLL Pittsburgh Industrial Insight & Statistics - Q3 2021JLL Pittsburgh Industrial Insight & Statistics - Q3 2021
JLL Pittsburgh Industrial Insight & Statistics - Q3 2021Tobiah Bilski
 
JLL Pittsburgh Industrial Insight & Statistics - Q2 2021
JLL Pittsburgh Industrial Insight & Statistics - Q2 2021JLL Pittsburgh Industrial Insight & Statistics - Q2 2021
JLL Pittsburgh Industrial Insight & Statistics - Q2 2021Tobiah Bilski
 
JLL Pittsburgh Industrial Insight & Statistics - Q1 2021
JLL Pittsburgh Industrial Insight & Statistics - Q1 2021JLL Pittsburgh Industrial Insight & Statistics - Q1 2021
JLL Pittsburgh Industrial Insight & Statistics - Q1 2021Tobiah Bilski
 
JLL Pittsburgh Industrial Insight & Statistics - Q4 2020
JLL Pittsburgh Industrial Insight & Statistics - Q4 2020JLL Pittsburgh Industrial Insight & Statistics - Q4 2020
JLL Pittsburgh Industrial Insight & Statistics - Q4 2020Tobiah Bilski
 
JLL Pittsburgh Industrial Insight & Statistics - Q3 2020
JLL Pittsburgh Industrial Insight & Statistics - Q3 2020JLL Pittsburgh Industrial Insight & Statistics - Q3 2020
JLL Pittsburgh Industrial Insight & Statistics - Q3 2020Tobiah Bilski
 
JLL Pittsburgh Industrial Insight & Statistics - Q3 2019
JLL Pittsburgh Industrial Insight & Statistics - Q3 2019JLL Pittsburgh Industrial Insight & Statistics - Q3 2019
JLL Pittsburgh Industrial Insight & Statistics - Q3 2019Tobiah Bilski
 
JLL Pittsburgh Industrial Insight & Statistics - Q2 2019
JLL Pittsburgh Industrial Insight & Statistics - Q2 2019JLL Pittsburgh Industrial Insight & Statistics - Q2 2019
JLL Pittsburgh Industrial Insight & Statistics - Q2 2019Tobiah Bilski
 
JLL Pittsburgh Industrial Insight & Statistics - Q1 2019
JLL Pittsburgh Industrial Insight & Statistics - Q1 2019JLL Pittsburgh Industrial Insight & Statistics - Q1 2019
JLL Pittsburgh Industrial Insight & Statistics - Q1 2019Tobiah Bilski
 
JLL Pittsburgh Industrial Insight & Statistics - Q4 2018
JLL Pittsburgh Industrial Insight & Statistics - Q4 2018JLL Pittsburgh Industrial Insight & Statistics - Q4 2018
JLL Pittsburgh Industrial Insight & Statistics - Q4 2018Tobiah Bilski
 
JLL Pittsburgh Industrial Insight & Statistics - Q3 2018
JLL Pittsburgh Industrial Insight & Statistics - Q3 2018JLL Pittsburgh Industrial Insight & Statistics - Q3 2018
JLL Pittsburgh Industrial Insight & Statistics - Q3 2018Tobiah Bilski
 
JLL Pittsburgh Industrial Insight & Statistics - Q2 2018
JLL Pittsburgh Industrial Insight & Statistics - Q2 2018JLL Pittsburgh Industrial Insight & Statistics - Q2 2018
JLL Pittsburgh Industrial Insight & Statistics - Q2 2018Tobiah Bilski
 
JLL Pittsburgh Industrial Insight & Statistics - Q1 2018
JLL Pittsburgh Industrial Insight & Statistics - Q1 2018JLL Pittsburgh Industrial Insight & Statistics - Q1 2018
JLL Pittsburgh Industrial Insight & Statistics - Q1 2018Tobiah Bilski
 

More from Tobiah Bilski (13)

JLL Pittsburgh Industrial Insight & Statistics - Q4 2021
JLL Pittsburgh Industrial Insight & Statistics - Q4 2021JLL Pittsburgh Industrial Insight & Statistics - Q4 2021
JLL Pittsburgh Industrial Insight & Statistics - Q4 2021
 
JLL Pittsburgh Industrial Insight & Statistics - Q3 2021
JLL Pittsburgh Industrial Insight & Statistics - Q3 2021JLL Pittsburgh Industrial Insight & Statistics - Q3 2021
JLL Pittsburgh Industrial Insight & Statistics - Q3 2021
 
JLL Pittsburgh Industrial Insight & Statistics - Q2 2021
JLL Pittsburgh Industrial Insight & Statistics - Q2 2021JLL Pittsburgh Industrial Insight & Statistics - Q2 2021
JLL Pittsburgh Industrial Insight & Statistics - Q2 2021
 
JLL Pittsburgh Industrial Insight & Statistics - Q1 2021
JLL Pittsburgh Industrial Insight & Statistics - Q1 2021JLL Pittsburgh Industrial Insight & Statistics - Q1 2021
JLL Pittsburgh Industrial Insight & Statistics - Q1 2021
 
JLL Pittsburgh Industrial Insight & Statistics - Q4 2020
JLL Pittsburgh Industrial Insight & Statistics - Q4 2020JLL Pittsburgh Industrial Insight & Statistics - Q4 2020
JLL Pittsburgh Industrial Insight & Statistics - Q4 2020
 
JLL Pittsburgh Industrial Insight & Statistics - Q3 2020
JLL Pittsburgh Industrial Insight & Statistics - Q3 2020JLL Pittsburgh Industrial Insight & Statistics - Q3 2020
JLL Pittsburgh Industrial Insight & Statistics - Q3 2020
 
JLL Pittsburgh Industrial Insight & Statistics - Q3 2019
JLL Pittsburgh Industrial Insight & Statistics - Q3 2019JLL Pittsburgh Industrial Insight & Statistics - Q3 2019
JLL Pittsburgh Industrial Insight & Statistics - Q3 2019
 
JLL Pittsburgh Industrial Insight & Statistics - Q2 2019
JLL Pittsburgh Industrial Insight & Statistics - Q2 2019JLL Pittsburgh Industrial Insight & Statistics - Q2 2019
JLL Pittsburgh Industrial Insight & Statistics - Q2 2019
 
JLL Pittsburgh Industrial Insight & Statistics - Q1 2019
JLL Pittsburgh Industrial Insight & Statistics - Q1 2019JLL Pittsburgh Industrial Insight & Statistics - Q1 2019
JLL Pittsburgh Industrial Insight & Statistics - Q1 2019
 
JLL Pittsburgh Industrial Insight & Statistics - Q4 2018
JLL Pittsburgh Industrial Insight & Statistics - Q4 2018JLL Pittsburgh Industrial Insight & Statistics - Q4 2018
JLL Pittsburgh Industrial Insight & Statistics - Q4 2018
 
JLL Pittsburgh Industrial Insight & Statistics - Q3 2018
JLL Pittsburgh Industrial Insight & Statistics - Q3 2018JLL Pittsburgh Industrial Insight & Statistics - Q3 2018
JLL Pittsburgh Industrial Insight & Statistics - Q3 2018
 
JLL Pittsburgh Industrial Insight & Statistics - Q2 2018
JLL Pittsburgh Industrial Insight & Statistics - Q2 2018JLL Pittsburgh Industrial Insight & Statistics - Q2 2018
JLL Pittsburgh Industrial Insight & Statistics - Q2 2018
 
JLL Pittsburgh Industrial Insight & Statistics - Q1 2018
JLL Pittsburgh Industrial Insight & Statistics - Q1 2018JLL Pittsburgh Industrial Insight & Statistics - Q1 2018
JLL Pittsburgh Industrial Insight & Statistics - Q1 2018
 

Recently uploaded

Call Girls in Khan Market 9654467111 ESCORTS SERVICE
Call Girls in Khan Market 9654467111 ESCORTS SERVICECall Girls in Khan Market 9654467111 ESCORTS SERVICE
Call Girls in Khan Market 9654467111 ESCORTS SERVICESapana Sha
 
Rustomjee The Panorama At Pali Hill, Bandra West, Mumbai - Brochure.pdf
Rustomjee The Panorama At Pali Hill, Bandra West, Mumbai - Brochure.pdfRustomjee The Panorama At Pali Hill, Bandra West, Mumbai - Brochure.pdf
Rustomjee The Panorama At Pali Hill, Bandra West, Mumbai - Brochure.pdfmonikasharma630
 
Nanke Area Estate commercial ( Dir. Kat Kuo)
Nanke Area Estate commercial ( Dir. Kat Kuo)Nanke Area Estate commercial ( Dir. Kat Kuo)
Nanke Area Estate commercial ( Dir. Kat Kuo)jessica288382
 
Namrata 7 Plumeria Drive Pimpri Chinchwad Pune Brochure.pdf
Namrata 7 Plumeria Drive Pimpri Chinchwad Pune Brochure.pdfNamrata 7 Plumeria Drive Pimpri Chinchwad Pune Brochure.pdf
Namrata 7 Plumeria Drive Pimpri Chinchwad Pune Brochure.pdfPrachiRudram
 
83770-87607 ۞Call Girls In Near The Park Hotel (Cp) Delhi
83770-87607 ۞Call Girls In Near The Park Hotel (Cp) Delhi83770-87607 ۞Call Girls In Near The Park Hotel (Cp) Delhi
83770-87607 ۞Call Girls In Near The Park Hotel (Cp) Delhidollysharma2066
 
Managed Farmland Brochures to get more in
Managed Farmland Brochures to get more inManaged Farmland Brochures to get more in
Managed Farmland Brochures to get more inknoxdigital1
 
MADHUGIRI FARM LAND BROCHURES (11)_compressed (1).pdf
MADHUGIRI FARM LAND BROCHURES (11)_compressed (1).pdfMADHUGIRI FARM LAND BROCHURES (11)_compressed (1).pdf
MADHUGIRI FARM LAND BROCHURES (11)_compressed (1).pdfknoxdigital1
 
Call Girls In Mayur Vihar-1 Delhi ❤️8860477959 Good Looking Escorts In 24/7 D...
Call Girls In Mayur Vihar-1 Delhi ❤️8860477959 Good Looking Escorts In 24/7 D...Call Girls In Mayur Vihar-1 Delhi ❤️8860477959 Good Looking Escorts In 24/7 D...
Call Girls In Mayur Vihar-1 Delhi ❤️8860477959 Good Looking Escorts In 24/7 D...lizamodels9
 
Call Girls In The Lalit New Delhi ❤️8860477959 Good Looking Escorts In 24/7 D...
Call Girls In The Lalit New Delhi ❤️8860477959 Good Looking Escorts In 24/7 D...Call Girls In The Lalit New Delhi ❤️8860477959 Good Looking Escorts In 24/7 D...
Call Girls In The Lalit New Delhi ❤️8860477959 Good Looking Escorts In 24/7 D...lizamodels9
 
SVN Live 4.22.24 Weekly Property Broadcast
SVN Live 4.22.24 Weekly Property BroadcastSVN Live 4.22.24 Weekly Property Broadcast
SVN Live 4.22.24 Weekly Property BroadcastSVN International Corp.
 
Low Rate Call Girls in Tughlakabad Delhi Call 9990771857
Low Rate Call Girls in Tughlakabad Delhi Call 9990771857Low Rate Call Girls in Tughlakabad Delhi Call 9990771857
Low Rate Call Girls in Tughlakabad Delhi Call 9990771857delhimodel235
 
Low Rate Call Girls in Akshardham Delhi Call 9990771857
Low Rate Call Girls in Akshardham   Delhi Call 9990771857Low Rate Call Girls in Akshardham   Delhi Call 9990771857
Low Rate Call Girls in Akshardham Delhi Call 9990771857delhimodel235
 
Ajmera Prive at Juhu, Mumbai E-Brochure.pdf
Ajmera Prive at Juhu, Mumbai  E-Brochure.pdfAjmera Prive at Juhu, Mumbai  E-Brochure.pdf
Ajmera Prive at Juhu, Mumbai E-Brochure.pdfManishSaxena95
 
9990771857 Call Girls in Noida Sector 03 Noida (Call Girls) Delhi
9990771857 Call Girls in Noida Sector 03 Noida (Call Girls) Delhi9990771857 Call Girls in Noida Sector 03 Noida (Call Girls) Delhi
9990771857 Call Girls in Noida Sector 03 Noida (Call Girls) Delhidelhimodel235
 
Call Girls In Peeragarhi, Delhi↫8447779280↬Call Girls in Peeragarhi Delhi NCR
Call Girls In Peeragarhi, Delhi↫8447779280↬Call Girls in Peeragarhi Delhi NCRCall Girls In Peeragarhi, Delhi↫8447779280↬Call Girls in Peeragarhi Delhi NCR
Call Girls In Peeragarhi, Delhi↫8447779280↬Call Girls in Peeragarhi Delhi NCRasmaqueen5
 
How to Build Multifamily and Laneway Suites in Toronto!! (feat. Expert Archi...
How to Build Multifamily and Laneway Suites  in Toronto!! (feat. Expert Archi...How to Build Multifamily and Laneway Suites  in Toronto!! (feat. Expert Archi...
How to Build Multifamily and Laneway Suites in Toronto!! (feat. Expert Archi...Volition Properties
 
Call Girls In Sahibabad Ghaziabad ❤️8860477959 Low Rate Escorts Service In 24...
Call Girls In Sahibabad Ghaziabad ❤️8860477959 Low Rate Escorts Service In 24...Call Girls In Sahibabad Ghaziabad ❤️8860477959 Low Rate Escorts Service In 24...
Call Girls In Sahibabad Ghaziabad ❤️8860477959 Low Rate Escorts Service In 24...lizamodels9
 
Ryan Mahoney - How Property Technology Is Altering the Real Estate Market
Ryan Mahoney - How Property Technology Is Altering the Real Estate MarketRyan Mahoney - How Property Technology Is Altering the Real Estate Market
Ryan Mahoney - How Property Technology Is Altering the Real Estate MarketRyan Mahoney
 

Recently uploaded (20)

Call Girls in Khan Market 9654467111 ESCORTS SERVICE
Call Girls in Khan Market 9654467111 ESCORTS SERVICECall Girls in Khan Market 9654467111 ESCORTS SERVICE
Call Girls in Khan Market 9654467111 ESCORTS SERVICE
 
Rustomjee The Panorama At Pali Hill, Bandra West, Mumbai - Brochure.pdf
Rustomjee The Panorama At Pali Hill, Bandra West, Mumbai - Brochure.pdfRustomjee The Panorama At Pali Hill, Bandra West, Mumbai - Brochure.pdf
Rustomjee The Panorama At Pali Hill, Bandra West, Mumbai - Brochure.pdf
 
Nanke Area Estate commercial ( Dir. Kat Kuo)
Nanke Area Estate commercial ( Dir. Kat Kuo)Nanke Area Estate commercial ( Dir. Kat Kuo)
Nanke Area Estate commercial ( Dir. Kat Kuo)
 
Namrata 7 Plumeria Drive Pimpri Chinchwad Pune Brochure.pdf
Namrata 7 Plumeria Drive Pimpri Chinchwad Pune Brochure.pdfNamrata 7 Plumeria Drive Pimpri Chinchwad Pune Brochure.pdf
Namrata 7 Plumeria Drive Pimpri Chinchwad Pune Brochure.pdf
 
Call Girls in Mahavir Nagar whatsaap call US +919953056974
Call Girls in Mahavir Nagar  whatsaap call US  +919953056974Call Girls in Mahavir Nagar  whatsaap call US  +919953056974
Call Girls in Mahavir Nagar whatsaap call US +919953056974
 
83770-87607 ۞Call Girls In Near The Park Hotel (Cp) Delhi
83770-87607 ۞Call Girls In Near The Park Hotel (Cp) Delhi83770-87607 ۞Call Girls In Near The Park Hotel (Cp) Delhi
83770-87607 ۞Call Girls In Near The Park Hotel (Cp) Delhi
 
Managed Farmland Brochures to get more in
Managed Farmland Brochures to get more inManaged Farmland Brochures to get more in
Managed Farmland Brochures to get more in
 
MADHUGIRI FARM LAND BROCHURES (11)_compressed (1).pdf
MADHUGIRI FARM LAND BROCHURES (11)_compressed (1).pdfMADHUGIRI FARM LAND BROCHURES (11)_compressed (1).pdf
MADHUGIRI FARM LAND BROCHURES (11)_compressed (1).pdf
 
Call Girls In Mayur Vihar-1 Delhi ❤️8860477959 Good Looking Escorts In 24/7 D...
Call Girls In Mayur Vihar-1 Delhi ❤️8860477959 Good Looking Escorts In 24/7 D...Call Girls In Mayur Vihar-1 Delhi ❤️8860477959 Good Looking Escorts In 24/7 D...
Call Girls In Mayur Vihar-1 Delhi ❤️8860477959 Good Looking Escorts In 24/7 D...
 
Call Girls In The Lalit New Delhi ❤️8860477959 Good Looking Escorts In 24/7 D...
Call Girls In The Lalit New Delhi ❤️8860477959 Good Looking Escorts In 24/7 D...Call Girls In The Lalit New Delhi ❤️8860477959 Good Looking Escorts In 24/7 D...
Call Girls In The Lalit New Delhi ❤️8860477959 Good Looking Escorts In 24/7 D...
 
9953056974 Low Rate Call Girls In Saket, Delhi NCR
9953056974 Low Rate Call Girls In Saket, Delhi NCR9953056974 Low Rate Call Girls In Saket, Delhi NCR
9953056974 Low Rate Call Girls In Saket, Delhi NCR
 
SVN Live 4.22.24 Weekly Property Broadcast
SVN Live 4.22.24 Weekly Property BroadcastSVN Live 4.22.24 Weekly Property Broadcast
SVN Live 4.22.24 Weekly Property Broadcast
 
Low Rate Call Girls in Tughlakabad Delhi Call 9990771857
Low Rate Call Girls in Tughlakabad Delhi Call 9990771857Low Rate Call Girls in Tughlakabad Delhi Call 9990771857
Low Rate Call Girls in Tughlakabad Delhi Call 9990771857
 
Low Rate Call Girls in Akshardham Delhi Call 9990771857
Low Rate Call Girls in Akshardham   Delhi Call 9990771857Low Rate Call Girls in Akshardham   Delhi Call 9990771857
Low Rate Call Girls in Akshardham Delhi Call 9990771857
 
Ajmera Prive at Juhu, Mumbai E-Brochure.pdf
Ajmera Prive at Juhu, Mumbai  E-Brochure.pdfAjmera Prive at Juhu, Mumbai  E-Brochure.pdf
Ajmera Prive at Juhu, Mumbai E-Brochure.pdf
 
9990771857 Call Girls in Noida Sector 03 Noida (Call Girls) Delhi
9990771857 Call Girls in Noida Sector 03 Noida (Call Girls) Delhi9990771857 Call Girls in Noida Sector 03 Noida (Call Girls) Delhi
9990771857 Call Girls in Noida Sector 03 Noida (Call Girls) Delhi
 
Call Girls In Peeragarhi, Delhi↫8447779280↬Call Girls in Peeragarhi Delhi NCR
Call Girls In Peeragarhi, Delhi↫8447779280↬Call Girls in Peeragarhi Delhi NCRCall Girls In Peeragarhi, Delhi↫8447779280↬Call Girls in Peeragarhi Delhi NCR
Call Girls In Peeragarhi, Delhi↫8447779280↬Call Girls in Peeragarhi Delhi NCR
 
How to Build Multifamily and Laneway Suites in Toronto!! (feat. Expert Archi...
How to Build Multifamily and Laneway Suites  in Toronto!! (feat. Expert Archi...How to Build Multifamily and Laneway Suites  in Toronto!! (feat. Expert Archi...
How to Build Multifamily and Laneway Suites in Toronto!! (feat. Expert Archi...
 
Call Girls In Sahibabad Ghaziabad ❤️8860477959 Low Rate Escorts Service In 24...
Call Girls In Sahibabad Ghaziabad ❤️8860477959 Low Rate Escorts Service In 24...Call Girls In Sahibabad Ghaziabad ❤️8860477959 Low Rate Escorts Service In 24...
Call Girls In Sahibabad Ghaziabad ❤️8860477959 Low Rate Escorts Service In 24...
 
Ryan Mahoney - How Property Technology Is Altering the Real Estate Market
Ryan Mahoney - How Property Technology Is Altering the Real Estate MarketRyan Mahoney - How Property Technology Is Altering the Real Estate Market
Ryan Mahoney - How Property Technology Is Altering the Real Estate Market
 

JLL Pittsburgh Office Insight & Statistics - Q2 2020

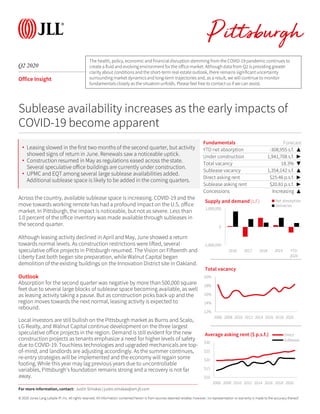
  • 1. © 2020 Jones Lang LaSalle IP, Inc. All rights reserved. All information contained herein is from sources deemed reliable; however, no representation or warranty is made to the accuracy thereof. Q2 2020 Pittsburgh Office Insight Across the country, available sublease space is increasing. COVID-19 and the move towards working remote has had a profound impact on the U.S. office market. In Pittsburgh, the impact is noticeable, but not as severe. Less than 1.0 percent of the office inventory was made available through subleases in the second quarter. Although leasing activity declined in April and May, June showed a return towards normal levels. As construction restrictions were lifted, several speculative office projects in Pittsburgh resumed. The Vision on Fifteenth and Liberty East both began site preparation, while Walnut Capital began demolition of the existing buildings on the Innovation District site in Oakland. Outlook Absorption for the second quarter was negative by more than 500,000 square feet due to several large blocks of sublease space becoming available, as well as leasing activity taking a pause. But as construction picks back up and the region moves towards the next normal, leasing activity is expected to rebound. Local investors are still bullish on the Pittsburgh market as Burns and Scalo, LG Realty, and Walnut Capital continue development on the three largest speculative office projects in the region. Demand is still evident for the new construction projects as tenants emphasize a need for higher levels of safety due to COVID-19. Touchless technologies and upgraded mechanicals are top- of-mind, and landlords are adjusting accordingly. As the summer continues, re-entry strategies will be implemented and the economy will regain some footing. While this year may lag previous years due to uncontrollable variables, Pittsburgh’s foundation remains strong and a recovery is not far away. Fundamentals Forecast YTD net absorption -308,955 s.f. ▲ Under construction 1,941,708 s.f. ▶ Total vacancy 18.3% ▼ Sublease vacancy 1,354,142 s.f. ▲ Direct asking rent $25.46 p.s.f. ▶ Sublease asking rent $20.81 p.s.f. ▶ Concessions Increasing ▲ -1,000,000 0 1,000,000 2016 2017 2018 2019 YTD 2020 Supply and demand (s.f.) Net absorption Deliveries Sublease availability increases as the early impacts of COVID-19 become apparent 12% 14% 16% 18% 20% 2006 2008 2010 2012 2014 2016 2018 2020 Total vacancy For more information, contact: Justin Simakas | justin.simakas@am.jll.com • Leasing slowed in the first two months of the second quarter, but activity showed signs of return in June. Renewals saw a noticeable uptick. • Construction resumed in May as regulations eased across the state. Several speculative office buildings are currently under construction. • UPMC and EQT among several large sublease availabilities added. Additional sublease space is likely to be added in the coming quarters. $10 $15 $20 $25 $30 2006 2008 2010 2012 2014 2016 2018 2020 Average asking rent ($ p.s.f.) Direct Sublease The health, policy, economic and financialdisruption stemming from the COVID-19 pandemic continues to create a fluid and evolving environment for the office market. Although data from Q2 is providing greater clarity about conditions and the short-term real estate outlook, there remains significant uncertainty surrounding market dynamics and long-term trajectories and, as a result, we will continue to monitor fundamentalsclosely as the situation unfolds. Please feel free to contact us if we can assist.
  • 2. © 2020 Jones Lang LaSalle IP, Inc. All rights reserved. All information contained herein is from sources deemed reliable; however, no representation or warranty is made to the accuracy thereof. Class Inventory (s.f.) Total net absorption (s.f.) YTD total net absorption (s.f.) YTD total net absorption (% of stock) Direct vacancy (%) Total vacancy (%) Average direct asking rent ($ p.s.f.) YTD Completions (s.f.) Under Development (s.f.) Northern I-79 / Cranberry Totals 4,376,907 5,577 106,081 2.4% 15.0% 21.0% $25.75 0 0 East Totals 3,053,814 -56,532 -35,774 -1.2% 26.1% 26.4% $20.13 0 0 North Totals 3,751,808 -71,273 -109,279 -2.9% 12.9% 13.5% $19.33 0 0 South Totals 2,311,420 -41,091 -14,121 -0.6% 14.1% 14.2% $20.15 0 140,000 Southpointe Totals 2,972,107 -8,184 -11,978 -0.4% 16.7% 19.5% $21.57 0 40,000 West Totals 7,229,171 -131,194 -73,032 -1.0% 17.4% 20.9% $22.00 0 220,000 Suburban Totals 23,695,227 -302,697 -138,103 -0.6% 17.0% 19.7% $21.67 0 400,000 CBD Totals 18,969,985 -244,900 -273,241 -1.4% 16.1% 18.3% $27.87 0 0 Fringe Totals 8,715,084 -32,640 106,542 1.2% 14.9% 18.4% $29.01 214,671 648,737 Oakland / East End Totals 2,334,209 -9,059 -4,153 -0.2% 4.4% 4.4% $35.72 0 892,971 Urban Totals 30,019,278 -286,599 -170,852 -0.6% 14.9% 17.3% $28.54 214,671 1,541,708 Pittsburgh Totals 53,714,505 -589,296 -308,955 -0.6% 15.8% 18.3% $25.46 214,671 1,941,708 Northern I-79 / Cranberry A 3,691,749 -10,935 93,582 2.5% 14.0% 21.2% $26.46 0 0 East A 1,580,784 -52,639 -32,220 -2.0% 31.1% 31.5% $21.46 0 0 North A 809,347 -15,618 -4,321 -0.5% 11.1% 11.3% $23.84 0 0 South A 0 0 0 0.0% 0.0% 0.0% $0.00 0 140,000 Southpointe A 1,909,754 -61,505 -57,893 -3.0% 10.1% 13.9% $22.97 0 40,000 West A 3,943,914 -88,831 -67,566 -1.7% 13.7% 18.6% $24.24 0 220,000 Suburban A 11,935,548 -229,528 -68,418 -0.6% 15.3% 19.9% $23.93 0 400,000 CBD A 13,498,998 -253,980 -315,733 -2.3% 15.4% 18.3% $30.42 0 0 Fringe A 2,880,141 -872 103,394 3.6% 8.0% 12.0% $36.96 214,671 648,737 Oakland / East End A 1,149,696 4,133 6,272 0.5% 6.4% 6.4% $38.35 0 892,971 Urban A 17,528,835 -250,719 -206,067 -1.2% 13.6% 16.5% $32.27 214,671 1,541,708 Pittsburgh A 29,464,383 -480,247 -274,485 -0.9% 14.3% 17.8% $28.97 214,671 1,941,708 Northern I-79 / Cranberry B 685,158 16,512 12,499 1.8% 20.4% 20.4% $22.38 0 0 East B 1,473,030 -3,893 -3,554 -0.2% 20.7% 21.1% $17.84 0 0 North B 2,942,461 -55,655 -104,958 -3.6% 13.4% 14.0% $17.92 0 0 South B 2,311,420 -41,091 -14,121 -0.6% 14.1% 14.2% $20.15 0 0 Southpointe B 1,062,353 53,321 45,915 4.3% 28.7% 29.7% $20.71 0 0 West B 3,285,257 -42,363 -5,466 -0.2% 21.9% 23.7% $20.47 0 0 Suburban B 11,759,679 -73,169 -69,685 -0.6% 18.6% 19.4% $19.75 0 0 CBD B 5,470,987 9,080 42,492 0.8% 18.0% 18.4% $22.85 0 0 Fringe B 5,834,943 -31,768 3,148 0.1% 18.3% 21.6% $24.47 0 0 Oakland / East End B 1,184,513 -13,192 -10,425 -0.9% 2.5% 2.5% $22.71 0 0 Urban B 12,490,443 -35,880 35,215 0.3% 16.7% 18.4% $23.66 0 0 Pittsburgh B 24,250,122 -109,049 -34,470 -0.1% 17.6% 18.9% $21.69 0 0 Q2 2020 Office Statistics Pittsburgh For more information, contact: Justin Simakas | justin.simakas@am.jll.com