SlideShare a Scribd company logo
1 of 3
Download to read offline
SUBMITTED BY: MARK FREIBERG, CCIM | SVN-RICORE| 11500 NORTHLAKE DR. #100 | CINCINNATI, OH 45249
513 886 3303 | MFREIBERG@SVN.COM |WWW.SVN-RICORE.COM
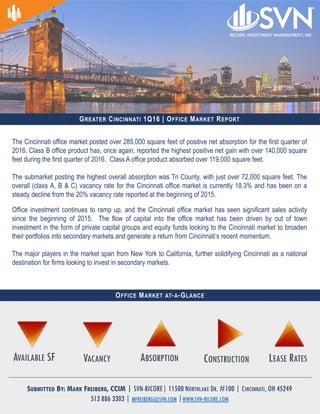
The Cincinnati office market posted over 285,000 square feet of positive net absorption for the first quarter of
2016. Class B office product has, once again, reported the highest positive net gain with over 140,000 square
feet during the first quarter of 2016. Class A office product absorbed over 119,000 square feet.
The submarket posting the highest overall absorption was Tri County, with just over 72,000 square feet. The
overall (class A, B & C) vacancy rate for the Cincinnati office market is currently 18.3% and has been on a
steady decline from the 20% vacancy rate reported at the beginning of 2015.
GREATER CINCINNATI 1Q16 | OFFICE MARKET REPORT
Office investment continues to ramp up, and the Cincinnati office market has seen significant sales activity
since the beginning of 2015. The flow of capital into the office market has been driven by out of town
investment in the form of private capital groups and equity funds looking to the Cincinnati market to broaden
their portfolios into secondary markets and generate a return from Cincinnati’s recent momentum.
The major players in the market span from New York to California, further solidifying Cincinnati as a national
destination for firms looking to invest in secondary markets.
OFFICE MARKET AT-A-GLANCE
ABSORPTION CONSTRUCTIONVACANCY LEASE RATESAVAILABLE SF
WEIGHTED TOTAL QUARTERLY NET YTD NET
SUBMARKET # of BLDGS. TOTAL SF VACANT SF ASKING RATE* VACANCY ABSORPTION ABSORPTION
CBD 13 6,567,213 1,115,336 $23.77 17.0% (36,440) (36,440)
CBD Peripheral 5 789,967 226,978 $21.25 28.7% 2,637 2,637
Midtown 10 965,259 101,034 $26.15 10.5% 27,234 27,234
Northern Kentucky 24 1,405,627 231,541 $19.69 16.5% 13,322 13,322
NKY Riverfront 5 1,464,284 561,427 I$22.19 38.3% 3,571 3,571
Kenwood 6 996,823 126,786 $28.14 12.7% 63,851 63,851
Blue Ash/Montgomery 21 2,547,280 118,976 $21.91 4.7% 2,442 2,442
Fields Ertel/Mason 11 1,553,238 195,516 $20.24 12.6% 38,693 38,693
Tri County 7 1,001,196 144,307 $19.08 14.4% (4,006) (4,006)
West Chester 21 1,429,502 194,897 $23.61 13.6% (3,615) (3,615)
*Full Service Gross
Tenant Address Size Submarket
WEIGHTED TOTAL QUARTERLY NET YTD NET
SUBMARKET # of BLDGS. TOTAL SF VACANT SF ASKING RATE* VACANCY ABSORPTION ABSORPTION
CBD 37 5,356,818 1,031,485 $17.23 19.3% 24,231 24,231
CBD Peripheral 12 757,194 179,395 $15.03 23.7% 3,917 3,917
Midtown 15 995,934 82,812 $18.52 8.3% 11,100 11,100
Northern Kentucky 33 1,282,637 282,138 $16.40 22% 1,192 1,192
NKY Riverfront 3 115,500 18,683 $17.95 16.2% 2,280 2,280
Kenwood 15 454,693 45,066 $20.70 9.9% (1,953) (1,953)
Blue Ash/Montgomery 56 2,415,011 384,000 $16.99 15.9% 23,602 23,602
Fields Ertel/Mason 26 1,069,291 237,931 $17.11 22.3% (4,118) (4,118)
Tri County 32 2,156,694 671,378 $13.85 31.1% 87,110 87,110
West Chester 9 212,163 43,555 $16.85 20.5% (6,360) (6,360)
*Full Service Gross
CBD
CBD PERIPHERAL
MIDTOWN
NKY RIVERFRONT
NORTHERN KENTUCKY
KENWOOD
BLUE ASH/MONTGOMERY
FIELDS ERTEL/MASON
TRI COUNTY
WEST CHESTER
EAST
WEST
18.4%
21.2%
10.0%
35.7%
19.8%
11.8%
10.8%
23.4%
25.6%
14.5%
14.6%
21.9%
CLASS A SUBMARKET OVERVIEW:
CLASS B SUBMARKET OVERVIEW:
SUBMARKET VACANCY (CLASS A, B & C):
Tenant Address Size Submarket
Blue Ash
16%
CBD
30%
Mason
11%
Midtown
35%
NKY
4%
Tri County
4%
On the Horizon…
MARKET ACTIVITY
1Q16 New Construction (1,209,157 SF)
NOTEWORTHY TRANSACTIONS
Sale Transactions 1Q16
Class Submarket Property Name Sale Price SF Sold Buyer Seller
A Blue Ash/Montgomery The Landings I $31,165,000 175,695 Blue Ash Landings RT Landings I
A Blue Ash/Montgomery McAuley Place $28,700,000 190,733 McAuley Place RT McAuley Place
A Blue Ash/Montgomery The Landings II $27,135,000 175,695 Blue Ash Landings RT Landings II
B CBD Textile Building $12,000,000 215,000 HH Cincinnati Textile Hertz Textile
B CBD Hartford Building $2,800,000 64,000 Drea 7 Main Place Vulcan Co
300,000 SF | VANDERCAR & AL NEYER
Madisonville 250,000 SF | RBM DEVELOPMENT
55,000 SF | 3CDC15th & Vine
Oakley Station
221 West 12th 88,000 SF | Grandin Properties
Landings Blue Ash
North Pointe
143,000 SF | Van Trust
300,000 SF | Kubicki Partners
Lease Transactions 1Q16
Class Submarket Property Name SF Occupied Tenant
0 Tri County Gilmore Pointe 74,500 Veritiv
A Kenwood The Kenwood Collection 70,387 Patient Point; Quotient Technology
A Fields Ertel/Mason Governor's Pointe 44,092 Strayer University; Mercy; BioRx
B CBD AT 580 32,000 Fifth Third Bank
C CBD Peripheral Longworth Hall 24,717 Interbrand
SUBMITTED BY: MARK FREIBERG, CCIM | SVN-RICORE| 11500 NORTHLAKE DR. #100 | CINCINNATI, OH 45249
513 886 3303 | MFREIBERG@SVN.COM |WWW.SVN-RICORE.COM

More Related Content

What's hot

JLL Pittsburgh Office Insight & Statistics - Q1 2019
JLL Pittsburgh Office Insight & Statistics - Q1 2019JLL Pittsburgh Office Insight & Statistics - Q1 2019
JLL Pittsburgh Office Insight & Statistics - Q1 2019Tobiah Bilski
 
National Dashboard Report | Office - Metro Areas with Population < 1M
National Dashboard Report | Office - Metro Areas with Population < 1MNational Dashboard Report | Office - Metro Areas with Population < 1M
National Dashboard Report | Office - Metro Areas with Population < 1MDarren Shaw, SIOR
 
Cushman & Wakefield Montreal Americas Marketbeat Office Q12019 #CRE #RealEstate
Cushman & Wakefield Montreal Americas Marketbeat Office Q12019  #CRE #RealEstateCushman & Wakefield Montreal Americas Marketbeat Office Q12019  #CRE #RealEstate
Cushman & Wakefield Montreal Americas Marketbeat Office Q12019 #CRE #RealEstateGuy Masse
 
JLL Pittsburgh Office Insight & Statistics - Q3 2021
JLL Pittsburgh Office Insight & Statistics - Q3 2021JLL Pittsburgh Office Insight & Statistics - Q3 2021
JLL Pittsburgh Office Insight & Statistics - Q3 2021Tobiah Bilski
 
JLL Cleveland Office Outlook: Q2 2018
JLL Cleveland Office Outlook: Q2 2018JLL Cleveland Office Outlook: Q2 2018
JLL Cleveland Office Outlook: Q2 2018Andrew Batson
 
Jll cincinnati office outlook q2 2017
Jll cincinnati office outlook   q2 2017Jll cincinnati office outlook   q2 2017
Jll cincinnati office outlook q2 2017Abby Armbruster
 
JLL Cleveland Office Outlook: Q4 2020
JLL Cleveland Office Outlook: Q4 2020JLL Cleveland Office Outlook: Q4 2020
JLL Cleveland Office Outlook: Q4 2020Andrew Batson
 
JLL Grand Rapids Office Insight & Statistics - Q4 2019
JLL Grand Rapids Office Insight & Statistics - Q4 2019JLL Grand Rapids Office Insight & Statistics - Q4 2019
JLL Grand Rapids Office Insight & Statistics - Q4 2019Harrison West
 
JLL Pittsburgh Office Insight & Statistics - Q4 2019
JLL Pittsburgh Office Insight & Statistics - Q4 2019JLL Pittsburgh Office Insight & Statistics - Q4 2019
JLL Pittsburgh Office Insight & Statistics - Q4 2019Tobiah Bilski
 
JLL Pittsburgh Office Insight & Statistics - Q4 2018
JLL Pittsburgh Office Insight & Statistics - Q4 2018JLL Pittsburgh Office Insight & Statistics - Q4 2018
JLL Pittsburgh Office Insight & Statistics - Q4 2018Tobiah Bilski
 
JLL Cleveland Office Outlook: Q2 2018
JLL Cleveland Office Outlook: Q2 2018JLL Cleveland Office Outlook: Q2 2018
JLL Cleveland Office Outlook: Q2 2018Andrew Batson
 
3Q08 Results Presentation
3Q08 Results Presentation 3Q08 Results Presentation
3Q08 Results Presentation RiRossi
 
Jll cincinnati office outlook q1 2017
Jll cincinnati office outlook   q1 2017Jll cincinnati office outlook   q1 2017
Jll cincinnati office outlook q1 2017Abby Armbruster
 
JLL Detroit Office Insight & Statistics - Q1 2017
JLL Detroit Office Insight & Statistics - Q1 2017JLL Detroit Office Insight & Statistics - Q1 2017
JLL Detroit Office Insight & Statistics - Q1 2017Harrison West
 
2019 golf industry report - Alley Pond Golf Center
2019 golf industry report - Alley Pond Golf Center2019 golf industry report - Alley Pond Golf Center
2019 golf industry report - Alley Pond Golf CenterSpring Rock Golf Center
 
JLL Cincinnati Office Outlook Q2 2020
JLL Cincinnati Office Outlook Q2 2020JLL Cincinnati Office Outlook Q2 2020
JLL Cincinnati Office Outlook Q2 2020Abby Armbruster
 
Q1 2017 - Chicago Suburbs Office Reports
Q1 2017 - Chicago Suburbs Office ReportsQ1 2017 - Chicago Suburbs Office Reports
Q1 2017 - Chicago Suburbs Office ReportsHailey Harrington
 
Naibg atlanta-3 q2011
Naibg atlanta-3 q2011Naibg atlanta-3 q2011
Naibg atlanta-3 q2011bcraig
 
JLL Louisville Office Outlook Q4 2017
JLL Louisville Office Outlook Q4 2017JLL Louisville Office Outlook Q4 2017
JLL Louisville Office Outlook Q4 2017Alex Westcott
 

What's hot (20)

JLL Pittsburgh Office Insight & Statistics - Q1 2019
JLL Pittsburgh Office Insight & Statistics - Q1 2019JLL Pittsburgh Office Insight & Statistics - Q1 2019
JLL Pittsburgh Office Insight & Statistics - Q1 2019
 
National Dashboard Report | Office - Metro Areas with Population < 1M
National Dashboard Report | Office - Metro Areas with Population < 1MNational Dashboard Report | Office - Metro Areas with Population < 1M
National Dashboard Report | Office - Metro Areas with Population < 1M
 
Cushman & Wakefield Montreal Americas Marketbeat Office Q12019 #CRE #RealEstate
Cushman & Wakefield Montreal Americas Marketbeat Office Q12019  #CRE #RealEstateCushman & Wakefield Montreal Americas Marketbeat Office Q12019  #CRE #RealEstate
Cushman & Wakefield Montreal Americas Marketbeat Office Q12019 #CRE #RealEstate
 
JLL Pittsburgh Office Insight & Statistics - Q3 2021
JLL Pittsburgh Office Insight & Statistics - Q3 2021JLL Pittsburgh Office Insight & Statistics - Q3 2021
JLL Pittsburgh Office Insight & Statistics - Q3 2021
 
JLL Cleveland Office Outlook: Q2 2018
JLL Cleveland Office Outlook: Q2 2018JLL Cleveland Office Outlook: Q2 2018
JLL Cleveland Office Outlook: Q2 2018
 
Jll cincinnati office outlook q2 2017
Jll cincinnati office outlook   q2 2017Jll cincinnati office outlook   q2 2017
Jll cincinnati office outlook q2 2017
 
JLL Cleveland Office Outlook: Q4 2020
JLL Cleveland Office Outlook: Q4 2020JLL Cleveland Office Outlook: Q4 2020
JLL Cleveland Office Outlook: Q4 2020
 
JLL Grand Rapids Office Insight & Statistics - Q4 2019
JLL Grand Rapids Office Insight & Statistics - Q4 2019JLL Grand Rapids Office Insight & Statistics - Q4 2019
JLL Grand Rapids Office Insight & Statistics - Q4 2019
 
JLL Pittsburgh Office Insight & Statistics - Q4 2019
JLL Pittsburgh Office Insight & Statistics - Q4 2019JLL Pittsburgh Office Insight & Statistics - Q4 2019
JLL Pittsburgh Office Insight & Statistics - Q4 2019
 
JLL Pittsburgh Office Insight & Statistics - Q4 2018
JLL Pittsburgh Office Insight & Statistics - Q4 2018JLL Pittsburgh Office Insight & Statistics - Q4 2018
JLL Pittsburgh Office Insight & Statistics - Q4 2018
 
JLL Cleveland Office Outlook: Q2 2018
JLL Cleveland Office Outlook: Q2 2018JLL Cleveland Office Outlook: Q2 2018
JLL Cleveland Office Outlook: Q2 2018
 
3Q08 Results Presentation
3Q08 Results Presentation 3Q08 Results Presentation
3Q08 Results Presentation
 
Jll cincinnati office outlook q1 2017
Jll cincinnati office outlook   q1 2017Jll cincinnati office outlook   q1 2017
Jll cincinnati office outlook q1 2017
 
JLL Detroit Office Insight & Statistics - Q1 2017
JLL Detroit Office Insight & Statistics - Q1 2017JLL Detroit Office Insight & Statistics - Q1 2017
JLL Detroit Office Insight & Statistics - Q1 2017
 
2019 golf industry report - Alley Pond Golf Center
2019 golf industry report - Alley Pond Golf Center2019 golf industry report - Alley Pond Golf Center
2019 golf industry report - Alley Pond Golf Center
 
JLL Cincinnati Office Outlook Q2 2020
JLL Cincinnati Office Outlook Q2 2020JLL Cincinnati Office Outlook Q2 2020
JLL Cincinnati Office Outlook Q2 2020
 
Gnp approach lesson
Gnp approach lesson Gnp approach lesson
Gnp approach lesson
 
Q1 2017 - Chicago Suburbs Office Reports
Q1 2017 - Chicago Suburbs Office ReportsQ1 2017 - Chicago Suburbs Office Reports
Q1 2017 - Chicago Suburbs Office Reports
 
Naibg atlanta-3 q2011
Naibg atlanta-3 q2011Naibg atlanta-3 q2011
Naibg atlanta-3 q2011
 
JLL Louisville Office Outlook Q4 2017
JLL Louisville Office Outlook Q4 2017JLL Louisville Office Outlook Q4 2017
JLL Louisville Office Outlook Q4 2017
 

Similar to Cincinnati Office Market Absorbs 285K SF in 1Q16

JLL Cincinnati Office Insight & Statistics - Q3 2016
JLL Cincinnati Office Insight & Statistics - Q3 2016JLL Cincinnati Office Insight & Statistics - Q3 2016
JLL Cincinnati Office Insight & Statistics - Q3 2016Ross Bratcher
 
Q42012 Cincinnati Market Tr
Q42012 Cincinnati Market TrQ42012 Cincinnati Market Tr
Q42012 Cincinnati Market Trcolliersohio
 
JLL Cleveland Office Outlook: Q4 2018
JLL Cleveland Office Outlook: Q4 2018JLL Cleveland Office Outlook: Q4 2018
JLL Cleveland Office Outlook: Q4 2018Andrew Batson
 
Q4 2014 san_francisco_office
Q4 2014 san_francisco_officeQ4 2014 san_francisco_office
Q4 2014 san_francisco_officeCoy Davidson
 
JLL Detroit Office Insight & Statistics - Q2 2017
JLL Detroit Office Insight & Statistics - Q2 2017JLL Detroit Office Insight & Statistics - Q2 2017
JLL Detroit Office Insight & Statistics - Q2 2017Harrison West
 
JLL Cleveland Office Outlook: Q1 2018
JLL Cleveland Office Outlook: Q1 2018JLL Cleveland Office Outlook: Q1 2018
JLL Cleveland Office Outlook: Q1 2018Andrew Batson
 
JLL Cleveland Office Outlook: Q1 2018
JLL Cleveland Office Outlook: Q1 2018JLL Cleveland Office Outlook: Q1 2018
JLL Cleveland Office Outlook: Q1 2018Andrew Batson
 
Q2 2017: Columbus Industrial Trends 2017
Q2 2017: Columbus Industrial Trends 2017Q2 2017: Columbus Industrial Trends 2017
Q2 2017: Columbus Industrial Trends 2017Kyle Ghiloni
 
JLL Detroit Office Insight & Statistics – Q2 2016
JLL Detroit Office Insight & Statistics – Q2 2016JLL Detroit Office Insight & Statistics – Q2 2016
JLL Detroit Office Insight & Statistics – Q2 2016Aaron Moore
 
JLL Detroit Office Insight & Statistics - Q1 2018
JLL Detroit Office Insight & Statistics - Q1 2018JLL Detroit Office Insight & Statistics - Q1 2018
JLL Detroit Office Insight & Statistics - Q1 2018Harrison West
 
JLL Pittsburgh Office Insight & Statistics - Q1 2018
JLL Pittsburgh Office Insight & Statistics - Q1 2018JLL Pittsburgh Office Insight & Statistics - Q1 2018
JLL Pittsburgh Office Insight & Statistics - Q1 2018Tobiah Bilski
 
Q4-Kzoo Overall Market Report
Q4-Kzoo Overall Market ReportQ4-Kzoo Overall Market Report
Q4-Kzoo Overall Market ReportAllison Seeley
 
JLL Cleveland Office Outlook: Q1 2018
JLL Cleveland Office Outlook: Q1 2018JLL Cleveland Office Outlook: Q1 2018
JLL Cleveland Office Outlook: Q1 2018Andrew Batson
 
JLL Cincinnati Office Outlook Q4 2020
JLL Cincinnati Office Outlook Q4 2020JLL Cincinnati Office Outlook Q4 2020
JLL Cincinnati Office Outlook Q4 2020Abby Armbruster
 
JLL Detroit Office Insight & Statistics - Q3 2018
JLL Detroit Office Insight & Statistics - Q3 2018JLL Detroit Office Insight & Statistics - Q3 2018
JLL Detroit Office Insight & Statistics - Q3 2018Harrison West
 
JLL Pittsburgh Office Insight & Statistics - Q3 2019
 JLL Pittsburgh Office Insight & Statistics - Q3 2019 JLL Pittsburgh Office Insight & Statistics - Q3 2019
JLL Pittsburgh Office Insight & Statistics - Q3 2019Tobiah Bilski
 
JLL Pittsburgh Office Insight & Statistics - Q1 2020
JLL Pittsburgh Office Insight & Statistics - Q1 2020JLL Pittsburgh Office Insight & Statistics - Q1 2020
JLL Pittsburgh Office Insight & Statistics - Q1 2020Tobiah Bilski
 
2019 Q4 Industrial St. Louis Report Colliers
2019 Q4 Industrial St. Louis Report Colliers2019 Q4 Industrial St. Louis Report Colliers
2019 Q4 Industrial St. Louis Report ColliersColliersSTL
 
JLL Detroit Office Insight & Statistics - Q1 2019
JLL Detroit Office Insight & Statistics - Q1 2019JLL Detroit Office Insight & Statistics - Q1 2019
JLL Detroit Office Insight & Statistics - Q1 2019Harrison West
 
JLL Cleveland Office Outlook: Q3 2018
JLL Cleveland Office Outlook: Q3 2018JLL Cleveland Office Outlook: Q3 2018
JLL Cleveland Office Outlook: Q3 2018Andrew Batson
 

Similar to Cincinnati Office Market Absorbs 285K SF in 1Q16 (20)

JLL Cincinnati Office Insight & Statistics - Q3 2016
JLL Cincinnati Office Insight & Statistics - Q3 2016JLL Cincinnati Office Insight & Statistics - Q3 2016
JLL Cincinnati Office Insight & Statistics - Q3 2016
 
Q42012 Cincinnati Market Tr
Q42012 Cincinnati Market TrQ42012 Cincinnati Market Tr
Q42012 Cincinnati Market Tr
 
JLL Cleveland Office Outlook: Q4 2018
JLL Cleveland Office Outlook: Q4 2018JLL Cleveland Office Outlook: Q4 2018
JLL Cleveland Office Outlook: Q4 2018
 
Q4 2014 san_francisco_office
Q4 2014 san_francisco_officeQ4 2014 san_francisco_office
Q4 2014 san_francisco_office
 
JLL Detroit Office Insight & Statistics - Q2 2017
JLL Detroit Office Insight & Statistics - Q2 2017JLL Detroit Office Insight & Statistics - Q2 2017
JLL Detroit Office Insight & Statistics - Q2 2017
 
JLL Cleveland Office Outlook: Q1 2018
JLL Cleveland Office Outlook: Q1 2018JLL Cleveland Office Outlook: Q1 2018
JLL Cleveland Office Outlook: Q1 2018
 
JLL Cleveland Office Outlook: Q1 2018
JLL Cleveland Office Outlook: Q1 2018JLL Cleveland Office Outlook: Q1 2018
JLL Cleveland Office Outlook: Q1 2018
 
Q2 2017: Columbus Industrial Trends 2017
Q2 2017: Columbus Industrial Trends 2017Q2 2017: Columbus Industrial Trends 2017
Q2 2017: Columbus Industrial Trends 2017
 
JLL Detroit Office Insight & Statistics – Q2 2016
JLL Detroit Office Insight & Statistics – Q2 2016JLL Detroit Office Insight & Statistics – Q2 2016
JLL Detroit Office Insight & Statistics – Q2 2016
 
JLL Detroit Office Insight & Statistics - Q1 2018
JLL Detroit Office Insight & Statistics - Q1 2018JLL Detroit Office Insight & Statistics - Q1 2018
JLL Detroit Office Insight & Statistics - Q1 2018
 
JLL Pittsburgh Office Insight & Statistics - Q1 2018
JLL Pittsburgh Office Insight & Statistics - Q1 2018JLL Pittsburgh Office Insight & Statistics - Q1 2018
JLL Pittsburgh Office Insight & Statistics - Q1 2018
 
Q4-Kzoo Overall Market Report
Q4-Kzoo Overall Market ReportQ4-Kzoo Overall Market Report
Q4-Kzoo Overall Market Report
 
JLL Cleveland Office Outlook: Q1 2018
JLL Cleveland Office Outlook: Q1 2018JLL Cleveland Office Outlook: Q1 2018
JLL Cleveland Office Outlook: Q1 2018
 
JLL Cincinnati Office Outlook Q4 2020
JLL Cincinnati Office Outlook Q4 2020JLL Cincinnati Office Outlook Q4 2020
JLL Cincinnati Office Outlook Q4 2020
 
JLL Detroit Office Insight & Statistics - Q3 2018
JLL Detroit Office Insight & Statistics - Q3 2018JLL Detroit Office Insight & Statistics - Q3 2018
JLL Detroit Office Insight & Statistics - Q3 2018
 
JLL Pittsburgh Office Insight & Statistics - Q3 2019
 JLL Pittsburgh Office Insight & Statistics - Q3 2019 JLL Pittsburgh Office Insight & Statistics - Q3 2019
JLL Pittsburgh Office Insight & Statistics - Q3 2019
 
JLL Pittsburgh Office Insight & Statistics - Q1 2020
JLL Pittsburgh Office Insight & Statistics - Q1 2020JLL Pittsburgh Office Insight & Statistics - Q1 2020
JLL Pittsburgh Office Insight & Statistics - Q1 2020
 
2019 Q4 Industrial St. Louis Report Colliers
2019 Q4 Industrial St. Louis Report Colliers2019 Q4 Industrial St. Louis Report Colliers
2019 Q4 Industrial St. Louis Report Colliers
 
JLL Detroit Office Insight & Statistics - Q1 2019
JLL Detroit Office Insight & Statistics - Q1 2019JLL Detroit Office Insight & Statistics - Q1 2019
JLL Detroit Office Insight & Statistics - Q1 2019
 
JLL Cleveland Office Outlook: Q3 2018
JLL Cleveland Office Outlook: Q3 2018JLL Cleveland Office Outlook: Q3 2018
JLL Cleveland Office Outlook: Q3 2018
 

Cincinnati Office Market Absorbs 285K SF in 1Q16

  • 1. SUBMITTED BY: MARK FREIBERG, CCIM | SVN-RICORE| 11500 NORTHLAKE DR. #100 | CINCINNATI, OH 45249 513 886 3303 | MFREIBERG@SVN.COM |WWW.SVN-RICORE.COM The Cincinnati office market posted over 285,000 square feet of positive net absorption for the first quarter of 2016. Class B office product has, once again, reported the highest positive net gain with over 140,000 square feet during the first quarter of 2016. Class A office product absorbed over 119,000 square feet. The submarket posting the highest overall absorption was Tri County, with just over 72,000 square feet. The overall (class A, B & C) vacancy rate for the Cincinnati office market is currently 18.3% and has been on a steady decline from the 20% vacancy rate reported at the beginning of 2015. GREATER CINCINNATI 1Q16 | OFFICE MARKET REPORT Office investment continues to ramp up, and the Cincinnati office market has seen significant sales activity since the beginning of 2015. The flow of capital into the office market has been driven by out of town investment in the form of private capital groups and equity funds looking to the Cincinnati market to broaden their portfolios into secondary markets and generate a return from Cincinnati’s recent momentum. The major players in the market span from New York to California, further solidifying Cincinnati as a national destination for firms looking to invest in secondary markets. OFFICE MARKET AT-A-GLANCE ABSORPTION CONSTRUCTIONVACANCY LEASE RATESAVAILABLE SF
  • 2. WEIGHTED TOTAL QUARTERLY NET YTD NET SUBMARKET # of BLDGS. TOTAL SF VACANT SF ASKING RATE* VACANCY ABSORPTION ABSORPTION CBD 13 6,567,213 1,115,336 $23.77 17.0% (36,440) (36,440) CBD Peripheral 5 789,967 226,978 $21.25 28.7% 2,637 2,637 Midtown 10 965,259 101,034 $26.15 10.5% 27,234 27,234 Northern Kentucky 24 1,405,627 231,541 $19.69 16.5% 13,322 13,322 NKY Riverfront 5 1,464,284 561,427 I$22.19 38.3% 3,571 3,571 Kenwood 6 996,823 126,786 $28.14 12.7% 63,851 63,851 Blue Ash/Montgomery 21 2,547,280 118,976 $21.91 4.7% 2,442 2,442 Fields Ertel/Mason 11 1,553,238 195,516 $20.24 12.6% 38,693 38,693 Tri County 7 1,001,196 144,307 $19.08 14.4% (4,006) (4,006) West Chester 21 1,429,502 194,897 $23.61 13.6% (3,615) (3,615) *Full Service Gross Tenant Address Size Submarket WEIGHTED TOTAL QUARTERLY NET YTD NET SUBMARKET # of BLDGS. TOTAL SF VACANT SF ASKING RATE* VACANCY ABSORPTION ABSORPTION CBD 37 5,356,818 1,031,485 $17.23 19.3% 24,231 24,231 CBD Peripheral 12 757,194 179,395 $15.03 23.7% 3,917 3,917 Midtown 15 995,934 82,812 $18.52 8.3% 11,100 11,100 Northern Kentucky 33 1,282,637 282,138 $16.40 22% 1,192 1,192 NKY Riverfront 3 115,500 18,683 $17.95 16.2% 2,280 2,280 Kenwood 15 454,693 45,066 $20.70 9.9% (1,953) (1,953) Blue Ash/Montgomery 56 2,415,011 384,000 $16.99 15.9% 23,602 23,602 Fields Ertel/Mason 26 1,069,291 237,931 $17.11 22.3% (4,118) (4,118) Tri County 32 2,156,694 671,378 $13.85 31.1% 87,110 87,110 West Chester 9 212,163 43,555 $16.85 20.5% (6,360) (6,360) *Full Service Gross CBD CBD PERIPHERAL MIDTOWN NKY RIVERFRONT NORTHERN KENTUCKY KENWOOD BLUE ASH/MONTGOMERY FIELDS ERTEL/MASON TRI COUNTY WEST CHESTER EAST WEST 18.4% 21.2% 10.0% 35.7% 19.8% 11.8% 10.8% 23.4% 25.6% 14.5% 14.6% 21.9% CLASS A SUBMARKET OVERVIEW: CLASS B SUBMARKET OVERVIEW: SUBMARKET VACANCY (CLASS A, B & C):
  • 3. Tenant Address Size Submarket Blue Ash 16% CBD 30% Mason 11% Midtown 35% NKY 4% Tri County 4% On the Horizon… MARKET ACTIVITY 1Q16 New Construction (1,209,157 SF) NOTEWORTHY TRANSACTIONS Sale Transactions 1Q16 Class Submarket Property Name Sale Price SF Sold Buyer Seller A Blue Ash/Montgomery The Landings I $31,165,000 175,695 Blue Ash Landings RT Landings I A Blue Ash/Montgomery McAuley Place $28,700,000 190,733 McAuley Place RT McAuley Place A Blue Ash/Montgomery The Landings II $27,135,000 175,695 Blue Ash Landings RT Landings II B CBD Textile Building $12,000,000 215,000 HH Cincinnati Textile Hertz Textile B CBD Hartford Building $2,800,000 64,000 Drea 7 Main Place Vulcan Co 300,000 SF | VANDERCAR & AL NEYER Madisonville 250,000 SF | RBM DEVELOPMENT 55,000 SF | 3CDC15th & Vine Oakley Station 221 West 12th 88,000 SF | Grandin Properties Landings Blue Ash North Pointe 143,000 SF | Van Trust 300,000 SF | Kubicki Partners Lease Transactions 1Q16 Class Submarket Property Name SF Occupied Tenant 0 Tri County Gilmore Pointe 74,500 Veritiv A Kenwood The Kenwood Collection 70,387 Patient Point; Quotient Technology A Fields Ertel/Mason Governor's Pointe 44,092 Strayer University; Mercy; BioRx B CBD AT 580 32,000 Fifth Third Bank C CBD Peripheral Longworth Hall 24,717 Interbrand SUBMITTED BY: MARK FREIBERG, CCIM | SVN-RICORE| 11500 NORTHLAKE DR. #100 | CINCINNATI, OH 45249 513 886 3303 | MFREIBERG@SVN.COM |WWW.SVN-RICORE.COM