SlideShare a Scribd company logo
1 of 2
Download to read offline
© 2017 Jones Lang LaSalle IP, Inc. All rights reserved. All information contained herein is from sources deemed reliable; however, no representation or warranty is made to the accuracy thereof.
Q4 2017
Detroit
Office Insight
The fourth quarter marked a strong finish for the metro Detroit office market.
Total vacancy fell to 18.5 percent across the metro, while average asking rents
rose to $19.18. In total, 885,582 square feet of office space was absorbed in
2017. Multiple significant lease transactions took place in the fourth quarter,
perhaps most notably Google’s announcement to move from Birmingham to
a 17,000-square-foot space at the office component of the new Little Caesars
Arena. UBS announced plans to open a 13,000-square-foot office downtown
on Woodward, while WJR extended their lease at the Fisher Building. In the
suburbs, Village Green moved their offices into a 35,000-square-foot space at
28411 Northwestern Highway, and DXC signed a 122,000-square-foot lease at
3000 University Drive in Auburn Hills.
In what has become a growing trend throughout the year, significant
investment and user sales continued in the fourth quarter. Bedrock
purchased the Buhl Building and Harvard Square center downtown, and
Foster Financial bought Central Park Plaza in Southfield for $5.1 million.
Beaumont purchased First Center in Southfield and will initially occupy
360,000 square feet. On the development front, the ceremonial
groundbreaking for the Hudson’s site development took place in December
with demolition and site work set to begin in early 2018.
Outlook
Looking ahead into the New Year, we can expect rent and vacancy trends to
stay on course. We’ll look for tenants to continue their flight to quality while
landlords upgrade and modernize their assets in an attempt to capture this
movement. Expect user sales (similar to Beaumont’s and United Shore
Mortgage’s acquisitions) to remain somewhat common, as users see the
benefits of owning their space. The development pipeline will likely continue
to grow given the demand and health of the market, and the sight of cranes in
the downtown skyline will be more than welcome in 2018.
Fundamentals Forecast
2017 absorption 885,582 s.f. ▲
Under construction 471,288 s.f. ▲
Total vacancy 18.5 % ▶
Average asking rent (gross) $19.18 p.s.f. ▲
Concessions Falling ▼
0
500,000
1,000,000
1,500,000
2013 2014 2015 2016 2017
Supply and demand (s.f.) Net absorption
Deliveries
Strong finish to the year for Detroit’s office market
25.4% 25.1%
19.0% 20.2% 18.5%
2013 2014 2015 2016 2017
Total vacancy
$0.00
$15.00
$30.00
2013 2014 2015 2016 2017
Average asking rents ($/s.f.) Class A
Class B
For more information, contact: Harrison West | harrison.west@am.jll.com
• Notable downtown moves like Google and UBS highlight fourth quarter
leasing activity
• User sales and investment sales make up transaction activity, with First
Center and Buhl Building trading, among others
• Flight to quality continues for tenants, as market awaits new class A
office construction
© 2017 Jones Lang LaSalle IP, Inc. All rights reserved. All information contained herein is from sources deemed reliable; however, no representation or warranty is made to the accuracy thereof.
Q4 2017
Detroit
Office Statistics
For more information, contact: Harrison West | harrison.west@am.jll.com
Class
Inventory
(s.f.)
Total net
absorption
(s.f.)
YTD total net
absorption
(s.f.)
YTD total net
absorption (%
of stock)
Direct vacancy
(%)
Total vacancy
(%)
Average
direct asking
rent ($ p.s.f.)
YTD
Completions
(s.f.)
Under
Development
(s.f.)
CBD Totals 13,317,209 -46,634 -14,412 -0.1% 12.9% 13.5% $21.68 67,430 160,000
New Center Totals 1,142,100 -25,345 29,183 2.6% 21.3% 21.3% $18.62 0 0
Urban Totals 14,459,309 -71,979 14,771 0.1% 13.5% 14.1% $21.25 67,430 160,000
Birmingham/Bloomfield Totals 3,979,668 -10,638 -23,120 -0.6% 16.6% 16.9% $26.25 0 0
Dearborn Totals 2,705,625 41,202 163,855 6.1% 27.7% 27.9% $16.26 0 150,000
Downriver Totals 483,907 -242 -2,157 -0.4% 40.6% 41.2% $14.75 0 0
Farmington/Farmington Hills Totals 4,658,516 1,155 -36,669 -0.8% 18.0% 18.1% $19.32 30,000 0
Macomb Totals 1,286,875 23,703 -565 0.0% 19.2% 19.2% $16.29 0 0
North Oakland Totals 2,207,648 150,476 -20,803 -0.9% 20.2% 20.8% $19.13 0 0
Northern I-275 Corridor Totals 4,467,691 20,700 107,441 2.4% 10.3% 11.7% $18.68 255,980 0
Royal Oak / SE Oakland Totals 706,710 13,141 2,946 0.4% 6.3% 6.3% $15.76 0 131,288
Southern I-275 Corridor Totals 1,077,525 0 -6,917 -0.6% 0.1% 1.1% $15.00 0 0
Southfield Totals 13,595,696 616,243 568,477 4.2% 25.6% 26.5% $17.90 0 0
Troy Totals 11,003,062 106,374 245,194 2.2% 21.5% 22.1% $18.57 0 0
Washtenaw Totals 6,613,772 120,289 148,129 2.2% 8.7% 9.4% $22.57 0 30,000
Suburbs Totals 52,786,695 807,403 870,811 1.6% 19.1% 19.7% $18.88 285,980 311,288
Detroit Totals 67,246,004 735,424 885,582 1.3% 17.9% 18.5% $19.18 353,410 471,288
CBD A 6,194,714 -31,611 -34,835 -0.6% 8.9% 10.1% $23.63 67,430 160,000
Urban A 6,194,714 -31,611 -34,835 -0.6% 8.9% 10.1% $23.63 67,430 160,000
Birmingham/Bloomfield A 1,569,497 -11,170 2,464 0.2% 23.3% 23.7% $28.63 0 0
Dearborn A 446,890 45,313 46,932 10.5% 0.8% 0.8% $27.50 0 150,000
Farmington/Farmington Hills A 618,109 -15,157 -42,362 -6.9% 19.9% 19.9% $24.39 0 0
Macomb A 295,494 2,647 14,359 4.9% 0.7% 0.7% $19.62 0 0
North Oakland A 488,665 11,013 2,546 0.5% 22.2% 22.2% $21.02 0 0
Northern I-275 Corridor A 1,113,719 10,091 4,559 0.4% 5.6% 7.0% $18.85 255,980 0
Southern I-275 Corridor A 832,753 0 -10,217 -1.2% 0.0% 1.2% $0.00 0 0
Southfield A 2,970,217 63,964 28,160 0.9% 23.5% 24.1% $22.42 0 0
Troy A 1,924,131 -74,546 -49,642 -2.6% 18.6% 20.3% $22.00 0 0
Washtenaw A 3,218,983 44,893 58,017 1.8% 10.5% 11.6% $26.06 0 0
Suburbs A 13,478,458 77,048 54,816 0.4% 15.3% 16.1% $23.88 255,980 150,000
Detroit A 19,673,172 45,437 19,981 0.1% 13.3% 14.2% $23.84 323,410 310,000
CBD B 7,122,495 -15,023 20,423 0.3% 16.3% 16.5% $20.61 0 0
New Center B 1,142,100 -25,345 29,183 2.6% 21.3% 21.3% $18.62 0 0
Urban B 8,264,595 -40,368 49,606 0.6% 17.0% 17.2% $20.21 0 0
Birmingham/Bloomfield B 2,410,171 532 -25,584 -1.1% 12.2% 12.4% $22.76 0 0
Dearborn B 2,258,735 -4,111 116,923 5.2% 33.0% 33.3% $16.21 0 0
Downriver B 483,907 -242 -2,157 -0.4% 40.6% 41.2% $14.75 0 0
Farmington/Farmington Hills B 4,040,407 16,312 5,693 0.1% 17.7% 17.8% $18.36 30,000 0
Macomb B 991,381 21,056 -14,924 -1.5% 24.8% 24.8% $16.17 0 0
North Oakland B 1,718,983 139,463 -23,349 -1.4% 19.7% 20.4% $18.51 0 0
Northern I-275 Corridor B 3,353,972 10,609 102,882 3.1% 11.8% 13.3% $18.66 0 0
Royal Oak / SE Oakland B 706,710 13,141 2,946 0.4% 6.3% 6.3% $15.76 0 131,288
Southern I-275 Corridor B 244,772 0 3,300 1.3% 0.5% 0.5% $15.00 0 0
Southfield B 10,625,479 552,279 540,317 5.1% 26.1% 27.1% $16.86 0 0
Troy B 9,078,931 180,920 294,836 3.2% 22.1% 22.4% $17.59 0 0
Washtenaw B 3,394,789 75,396 90,112 2.7% 7.1% 7.3% $18.14 0 30,000
Suburbs B 39,308,237 1,005,355 1,090,995 2.8% 20.4% 20.9% $17.45 30,000 161,288
Detroit B 47,572,832 964,987 1,140,601 2.4% 19.8% 20.3% $17.77 30,000 161,288

More Related Content

What's hot

JLL Pittsburgh Office Outlook - Q4 2015
JLL Pittsburgh Office Outlook - Q4 2015JLL Pittsburgh Office Outlook - Q4 2015
JLL Pittsburgh Office Outlook - Q4 2015Andrew Batson
 
JLL Pittsburgh Office Insight & Statistics - Q3 2019
 JLL Pittsburgh Office Insight & Statistics - Q3 2019 JLL Pittsburgh Office Insight & Statistics - Q3 2019
JLL Pittsburgh Office Insight & Statistics - Q3 2019Tobiah Bilski
 
Pittsburgh Office Insight & Stats Q1 2022
Pittsburgh Office Insight & Stats Q1 2022Pittsburgh Office Insight & Stats Q1 2022
Pittsburgh Office Insight & Stats Q1 2022Tobiah Bilski
 
JLL Cleveland Office Outlook: Q4 2018
JLL Cleveland Office Outlook: Q4 2018JLL Cleveland Office Outlook: Q4 2018
JLL Cleveland Office Outlook: Q4 2018Andrew Batson
 
JLL Pittsburgh Office Insight & Statistics - Q1 2021
JLL Pittsburgh Office Insight & Statistics - Q1 2021JLL Pittsburgh Office Insight & Statistics - Q1 2021
JLL Pittsburgh Office Insight & Statistics - Q1 2021Tobiah Bilski
 
JLL Houston Office Market Report - Q4 2018
JLL Houston Office Market Report - Q4 2018JLL Houston Office Market Report - Q4 2018
JLL Houston Office Market Report - Q4 2018DavidDominy1
 
JLL Grand Rapids Office Insight & Statistics - Q2 2019
JLL Grand Rapids Office Insight & Statistics - Q2 2019JLL Grand Rapids Office Insight & Statistics - Q2 2019
JLL Grand Rapids Office Insight & Statistics - Q2 2019Harrison West
 
JLL Pittsburgh Office Insight & Statistics - Q2 2021
JLL Pittsburgh Office Insight & Statistics - Q2 2021JLL Pittsburgh Office Insight & Statistics - Q2 2021
JLL Pittsburgh Office Insight & Statistics - Q2 2021Tobiah Bilski
 
JLL Grand Rapids Office Insight & Statistics - Q3 2019
JLL Grand Rapids Office Insight & Statistics - Q3 2019JLL Grand Rapids Office Insight & Statistics - Q3 2019
JLL Grand Rapids Office Insight & Statistics - Q3 2019Harrison West
 
JLL Cincinnati Office Insight & Statistics - Q3 2016
JLL Cincinnati Office Insight & Statistics - Q3 2016JLL Cincinnati Office Insight & Statistics - Q3 2016
JLL Cincinnati Office Insight & Statistics - Q3 2016Ross Bratcher
 
JLL Cincinnati Office Insight & Statistics - Q2 2016
JLL Cincinnati Office Insight & Statistics - Q2 2016JLL Cincinnati Office Insight & Statistics - Q2 2016
JLL Cincinnati Office Insight & Statistics - Q2 2016Ross Bratcher
 
JLL Cleveland Office Outlook: Q3 2018
JLL Cleveland Office Outlook: Q3 2018JLL Cleveland Office Outlook: Q3 2018
JLL Cleveland Office Outlook: Q3 2018Andrew Batson
 
JLL Grand Rapids Office Insight & Statistics - Q3 2018
JLL Grand Rapids Office Insight & Statistics - Q3 2018JLL Grand Rapids Office Insight & Statistics - Q3 2018
JLL Grand Rapids Office Insight & Statistics - Q3 2018Harrison West
 
JLL Cleveland Office Outlook: Q2 2018
JLL Cleveland Office Outlook: Q2 2018JLL Cleveland Office Outlook: Q2 2018
JLL Cleveland Office Outlook: Q2 2018Andrew Batson
 
JLL Pittsburgh Office Insight & Statistics - Q1 2019
JLL Pittsburgh Office Insight & Statistics - Q1 2019JLL Pittsburgh Office Insight & Statistics - Q1 2019
JLL Pittsburgh Office Insight & Statistics - Q1 2019Tobiah Bilski
 
JLL Pittsburgh Office Insight & Statistics - Q3 2021
JLL Pittsburgh Office Insight & Statistics - Q3 2021JLL Pittsburgh Office Insight & Statistics - Q3 2021
JLL Pittsburgh Office Insight & Statistics - Q3 2021Tobiah Bilski
 
JLL Pittsburgh Office Insight & Statistics - Q2 2018
JLL Pittsburgh Office Insight & Statistics - Q2 2018 JLL Pittsburgh Office Insight & Statistics - Q2 2018
JLL Pittsburgh Office Insight & Statistics - Q2 2018 Tobiah Bilski
 
JLL Cleveland Office Outlook: Q1 2017
JLL Cleveland Office Outlook: Q1 2017JLL Cleveland Office Outlook: Q1 2017
JLL Cleveland Office Outlook: Q1 2017Andrew Batson
 
JLL Pittsburgh Office Insight & Statistics - Q4 2017
JLL Pittsburgh Office Insight & Statistics - Q4 2017JLL Pittsburgh Office Insight & Statistics - Q4 2017
JLL Pittsburgh Office Insight & Statistics - Q4 2017Tobiah Bilski
 

What's hot (20)

JLL Pittsburgh Office Outlook - Q4 2015
JLL Pittsburgh Office Outlook - Q4 2015JLL Pittsburgh Office Outlook - Q4 2015
JLL Pittsburgh Office Outlook - Q4 2015
 
JLL Pittsburgh Office Insight & Statistics - Q3 2019
 JLL Pittsburgh Office Insight & Statistics - Q3 2019 JLL Pittsburgh Office Insight & Statistics - Q3 2019
JLL Pittsburgh Office Insight & Statistics - Q3 2019
 
Pittsburgh Office Insight & Stats Q1 2022
Pittsburgh Office Insight & Stats Q1 2022Pittsburgh Office Insight & Stats Q1 2022
Pittsburgh Office Insight & Stats Q1 2022
 
JLL Cleveland Office Outlook: Q4 2018
JLL Cleveland Office Outlook: Q4 2018JLL Cleveland Office Outlook: Q4 2018
JLL Cleveland Office Outlook: Q4 2018
 
JLL Pittsburgh Office Insight & Statistics - Q1 2021
JLL Pittsburgh Office Insight & Statistics - Q1 2021JLL Pittsburgh Office Insight & Statistics - Q1 2021
JLL Pittsburgh Office Insight & Statistics - Q1 2021
 
JLL Houston Office Report Q4
JLL Houston Office Report Q4JLL Houston Office Report Q4
JLL Houston Office Report Q4
 
JLL Houston Office Market Report - Q4 2018
JLL Houston Office Market Report - Q4 2018JLL Houston Office Market Report - Q4 2018
JLL Houston Office Market Report - Q4 2018
 
JLL Grand Rapids Office Insight & Statistics - Q2 2019
JLL Grand Rapids Office Insight & Statistics - Q2 2019JLL Grand Rapids Office Insight & Statistics - Q2 2019
JLL Grand Rapids Office Insight & Statistics - Q2 2019
 
JLL Pittsburgh Office Insight & Statistics - Q2 2021
JLL Pittsburgh Office Insight & Statistics - Q2 2021JLL Pittsburgh Office Insight & Statistics - Q2 2021
JLL Pittsburgh Office Insight & Statistics - Q2 2021
 
JLL Grand Rapids Office Insight & Statistics - Q3 2019
JLL Grand Rapids Office Insight & Statistics - Q3 2019JLL Grand Rapids Office Insight & Statistics - Q3 2019
JLL Grand Rapids Office Insight & Statistics - Q3 2019
 
JLL Cincinnati Office Insight & Statistics - Q3 2016
JLL Cincinnati Office Insight & Statistics - Q3 2016JLL Cincinnati Office Insight & Statistics - Q3 2016
JLL Cincinnati Office Insight & Statistics - Q3 2016
 
JLL Cincinnati Office Insight & Statistics - Q2 2016
JLL Cincinnati Office Insight & Statistics - Q2 2016JLL Cincinnati Office Insight & Statistics - Q2 2016
JLL Cincinnati Office Insight & Statistics - Q2 2016
 
JLL Cleveland Office Outlook: Q3 2018
JLL Cleveland Office Outlook: Q3 2018JLL Cleveland Office Outlook: Q3 2018
JLL Cleveland Office Outlook: Q3 2018
 
JLL Grand Rapids Office Insight & Statistics - Q3 2018
JLL Grand Rapids Office Insight & Statistics - Q3 2018JLL Grand Rapids Office Insight & Statistics - Q3 2018
JLL Grand Rapids Office Insight & Statistics - Q3 2018
 
JLL Cleveland Office Outlook: Q2 2018
JLL Cleveland Office Outlook: Q2 2018JLL Cleveland Office Outlook: Q2 2018
JLL Cleveland Office Outlook: Q2 2018
 
JLL Pittsburgh Office Insight & Statistics - Q1 2019
JLL Pittsburgh Office Insight & Statistics - Q1 2019JLL Pittsburgh Office Insight & Statistics - Q1 2019
JLL Pittsburgh Office Insight & Statistics - Q1 2019
 
JLL Pittsburgh Office Insight & Statistics - Q3 2021
JLL Pittsburgh Office Insight & Statistics - Q3 2021JLL Pittsburgh Office Insight & Statistics - Q3 2021
JLL Pittsburgh Office Insight & Statistics - Q3 2021
 
JLL Pittsburgh Office Insight & Statistics - Q2 2018
JLL Pittsburgh Office Insight & Statistics - Q2 2018 JLL Pittsburgh Office Insight & Statistics - Q2 2018
JLL Pittsburgh Office Insight & Statistics - Q2 2018
 
JLL Cleveland Office Outlook: Q1 2017
JLL Cleveland Office Outlook: Q1 2017JLL Cleveland Office Outlook: Q1 2017
JLL Cleveland Office Outlook: Q1 2017
 
JLL Pittsburgh Office Insight & Statistics - Q4 2017
JLL Pittsburgh Office Insight & Statistics - Q4 2017JLL Pittsburgh Office Insight & Statistics - Q4 2017
JLL Pittsburgh Office Insight & Statistics - Q4 2017
 

Similar to JLL Detroit Office Insight & Statistics - Q4 2017

JLL Detroit Office Insight & Statistics - Q1 2017
JLL Detroit Office Insight & Statistics - Q1 2017JLL Detroit Office Insight & Statistics - Q1 2017
JLL Detroit Office Insight & Statistics - Q1 2017Harrison West
 
JLL Detroit Office Insight & Statistics - Q3 2019
JLL Detroit Office Insight & Statistics - Q3 2019JLL Detroit Office Insight & Statistics - Q3 2019
JLL Detroit Office Insight & Statistics - Q3 2019Harrison West
 
JLL Detroit Office Outlook: Q4 2015
JLL Detroit Office Outlook: Q4 2015JLL Detroit Office Outlook: Q4 2015
JLL Detroit Office Outlook: Q4 2015Aaron Moore
 
JLL Detroit Office Insight & Statistics – Q2 2016
JLL Detroit Office Insight & Statistics – Q2 2016JLL Detroit Office Insight & Statistics – Q2 2016
JLL Detroit Office Insight & Statistics – Q2 2016Aaron Moore
 
Q1 2017 - Chicago Suburbs Office Reports
Q1 2017 - Chicago Suburbs Office ReportsQ1 2017 - Chicago Suburbs Office Reports
Q1 2017 - Chicago Suburbs Office ReportsHailey Harrington
 
Jll cincinnati office outlook q2 2017
Jll cincinnati office outlook   q2 2017Jll cincinnati office outlook   q2 2017
Jll cincinnati office outlook q2 2017Abby Armbruster
 
JLL Cincinnati Office Outlook Q4 2020
JLL Cincinnati Office Outlook Q4 2020JLL Cincinnati Office Outlook Q4 2020
JLL Cincinnati Office Outlook Q4 2020Abby Armbruster
 
Jll cincinnati office outlook q1 2017
Jll cincinnati office outlook   q1 2017Jll cincinnati office outlook   q1 2017
Jll cincinnati office outlook q1 2017Abby Armbruster
 
JLL Cleveland Office Outlook: Q2 2018
JLL Cleveland Office Outlook: Q2 2018JLL Cleveland Office Outlook: Q2 2018
JLL Cleveland Office Outlook: Q2 2018Andrew Batson
 
JLL Pittsburgh Office Insight & Statistics - Q3 2018
JLL Pittsburgh Office Insight & Statistics - Q3 2018JLL Pittsburgh Office Insight & Statistics - Q3 2018
JLL Pittsburgh Office Insight & Statistics - Q3 2018Tobiah Bilski
 
JLL Grand Rapids Office Insight & Statistics - Q4 2019
JLL Grand Rapids Office Insight & Statistics - Q4 2019JLL Grand Rapids Office Insight & Statistics - Q4 2019
JLL Grand Rapids Office Insight & Statistics - Q4 2019Harrison West
 
JLL Louisville Office Outlook - Q4 2019
JLL Louisville Office Outlook - Q4 2019JLL Louisville Office Outlook - Q4 2019
JLL Louisville Office Outlook - Q4 2019Alex Westcott
 
JLL Downtown Chicago Office Market Update - Q3 2016
JLL Downtown Chicago Office Market Update - Q3 2016JLL Downtown Chicago Office Market Update - Q3 2016
JLL Downtown Chicago Office Market Update - Q3 2016Hailey Harrington
 
JLL Cleveland Industrial Outlook: Q1 2017
JLL Cleveland Industrial Outlook: Q1 2017JLL Cleveland Industrial Outlook: Q1 2017
JLL Cleveland Industrial Outlook: Q1 2017Andrew Batson
 
JLL Cleveland Office Outlook: Q4 2017
JLL Cleveland Office Outlook: Q4 2017JLL Cleveland Office Outlook: Q4 2017
JLL Cleveland Office Outlook: Q4 2017Andrew Batson
 
JLL Pittsburgh Office Insight & Statistics - Q4 2018
JLL Pittsburgh Office Insight & Statistics - Q4 2018JLL Pittsburgh Office Insight & Statistics - Q4 2018
JLL Pittsburgh Office Insight & Statistics - Q4 2018Tobiah Bilski
 

Similar to JLL Detroit Office Insight & Statistics - Q4 2017 (19)

JLL Detroit Office Insight & Statistics - Q1 2017
JLL Detroit Office Insight & Statistics - Q1 2017JLL Detroit Office Insight & Statistics - Q1 2017
JLL Detroit Office Insight & Statistics - Q1 2017
 
JLL Detroit Office Insight & Statistics - Q3 2019
JLL Detroit Office Insight & Statistics - Q3 2019JLL Detroit Office Insight & Statistics - Q3 2019
JLL Detroit Office Insight & Statistics - Q3 2019
 
JLL Detroit Office Outlook: Q4 2015
JLL Detroit Office Outlook: Q4 2015JLL Detroit Office Outlook: Q4 2015
JLL Detroit Office Outlook: Q4 2015
 
JLL Detroit Office Insight & Statistics – Q2 2016
JLL Detroit Office Insight & Statistics – Q2 2016JLL Detroit Office Insight & Statistics – Q2 2016
JLL Detroit Office Insight & Statistics – Q2 2016
 
Q1 2017 - Chicago Suburbs Office Reports
Q1 2017 - Chicago Suburbs Office ReportsQ1 2017 - Chicago Suburbs Office Reports
Q1 2017 - Chicago Suburbs Office Reports
 
Jll cincinnati office outlook q2 2017
Jll cincinnati office outlook   q2 2017Jll cincinnati office outlook   q2 2017
Jll cincinnati office outlook q2 2017
 
JLL Houston 2018 Q1 Office Market Report
JLL Houston 2018 Q1 Office Market ReportJLL Houston 2018 Q1 Office Market Report
JLL Houston 2018 Q1 Office Market Report
 
JLL Cincinnati Office Outlook Q4 2020
JLL Cincinnati Office Outlook Q4 2020JLL Cincinnati Office Outlook Q4 2020
JLL Cincinnati Office Outlook Q4 2020
 
Q1 2017 Houston Office Research & Forecast Report
Q1 2017 Houston Office Research & Forecast Report Q1 2017 Houston Office Research & Forecast Report
Q1 2017 Houston Office Research & Forecast Report
 
Jll cincinnati office outlook q1 2017
Jll cincinnati office outlook   q1 2017Jll cincinnati office outlook   q1 2017
Jll cincinnati office outlook q1 2017
 
JLL Cleveland Office Outlook: Q2 2018
JLL Cleveland Office Outlook: Q2 2018JLL Cleveland Office Outlook: Q2 2018
JLL Cleveland Office Outlook: Q2 2018
 
Q1 2018 | Houston Office | Research & Forecast Report
Q1 2018 | Houston Office | Research & Forecast ReportQ1 2018 | Houston Office | Research & Forecast Report
Q1 2018 | Houston Office | Research & Forecast Report
 
JLL Pittsburgh Office Insight & Statistics - Q3 2018
JLL Pittsburgh Office Insight & Statistics - Q3 2018JLL Pittsburgh Office Insight & Statistics - Q3 2018
JLL Pittsburgh Office Insight & Statistics - Q3 2018
 
JLL Grand Rapids Office Insight & Statistics - Q4 2019
JLL Grand Rapids Office Insight & Statistics - Q4 2019JLL Grand Rapids Office Insight & Statistics - Q4 2019
JLL Grand Rapids Office Insight & Statistics - Q4 2019
 
JLL Louisville Office Outlook - Q4 2019
JLL Louisville Office Outlook - Q4 2019JLL Louisville Office Outlook - Q4 2019
JLL Louisville Office Outlook - Q4 2019
 
JLL Downtown Chicago Office Market Update - Q3 2016
JLL Downtown Chicago Office Market Update - Q3 2016JLL Downtown Chicago Office Market Update - Q3 2016
JLL Downtown Chicago Office Market Update - Q3 2016
 
JLL Cleveland Industrial Outlook: Q1 2017
JLL Cleveland Industrial Outlook: Q1 2017JLL Cleveland Industrial Outlook: Q1 2017
JLL Cleveland Industrial Outlook: Q1 2017
 
JLL Cleveland Office Outlook: Q4 2017
JLL Cleveland Office Outlook: Q4 2017JLL Cleveland Office Outlook: Q4 2017
JLL Cleveland Office Outlook: Q4 2017
 
JLL Pittsburgh Office Insight & Statistics - Q4 2018
JLL Pittsburgh Office Insight & Statistics - Q4 2018JLL Pittsburgh Office Insight & Statistics - Q4 2018
JLL Pittsburgh Office Insight & Statistics - Q4 2018
 

Recently uploaded

Call Girls in Kashmiri Gate Delhi 💯Call Us 🔝8264348440🔝
Call Girls in Kashmiri Gate Delhi 💯Call Us 🔝8264348440🔝Call Girls in Kashmiri Gate Delhi 💯Call Us 🔝8264348440🔝
Call Girls in Kashmiri Gate Delhi 💯Call Us 🔝8264348440🔝soniya singh
 
9990771857 Call Girls in Noida Sector 11 Noida (Call Girls) Delhi
9990771857 Call Girls in Noida Sector 11 Noida (Call Girls) Delhi9990771857 Call Girls in Noida Sector 11 Noida (Call Girls) Delhi
9990771857 Call Girls in Noida Sector 11 Noida (Call Girls) Delhidelhimodel235
 
Rustomjee The Panorama At Pali Hill, Bandra West, Mumbai - Brochure.pdf
Rustomjee The Panorama At Pali Hill, Bandra West, Mumbai - Brochure.pdfRustomjee The Panorama At Pali Hill, Bandra West, Mumbai - Brochure.pdf
Rustomjee The Panorama At Pali Hill, Bandra West, Mumbai - Brochure.pdfmonikasharma630
 
Prestige Sector 94 at Noida E Brochure.pdf
Prestige Sector 94 at Noida E Brochure.pdfPrestige Sector 94 at Noida E Brochure.pdf
Prestige Sector 94 at Noida E Brochure.pdfsarak0han45400
 
Low Rate Call Girls in Lajpat Nagar Delhi Call 9990771857
Low Rate Call Girls in Lajpat Nagar Delhi Call 9990771857Low Rate Call Girls in Lajpat Nagar Delhi Call 9990771857
Low Rate Call Girls in Lajpat Nagar Delhi Call 9990771857delhimodel235
 
Call Girls In Sahibabad Ghaziabad ❤️8860477959 Low Rate Escorts Service In 24...
Call Girls In Sahibabad Ghaziabad ❤️8860477959 Low Rate Escorts Service In 24...Call Girls In Sahibabad Ghaziabad ❤️8860477959 Low Rate Escorts Service In 24...
Call Girls In Sahibabad Ghaziabad ❤️8860477959 Low Rate Escorts Service In 24...lizamodels9
 
What Is Biophilic Design .pdf
What Is Biophilic Design            .pdfWhat Is Biophilic Design            .pdf
What Is Biophilic Design .pdfyamunaNMH
 
Purva Palm Hills Devanahalli, Bangalore E- Brochure.pdf
Purva Palm Hills Devanahalli, Bangalore E- Brochure.pdfPurva Palm Hills Devanahalli, Bangalore E- Brochure.pdf
Purva Palm Hills Devanahalli, Bangalore E- Brochure.pdffaheemali990101
 
9990771857 Call Girls in Noida Sector 10 Noida (Call Girls) Delhi
9990771857 Call Girls in Noida Sector 10 Noida (Call Girls) Delhi9990771857 Call Girls in Noida Sector 10 Noida (Call Girls) Delhi
9990771857 Call Girls in Noida Sector 10 Noida (Call Girls) Delhidelhimodel235
 
Call Girls In The Lalit New Delhi ❤️8860477959 Good Looking Escorts In 24/7 D...
Call Girls In The Lalit New Delhi ❤️8860477959 Good Looking Escorts In 24/7 D...Call Girls In The Lalit New Delhi ❤️8860477959 Good Looking Escorts In 24/7 D...
Call Girls In The Lalit New Delhi ❤️8860477959 Good Looking Escorts In 24/7 D...lizamodels9
 
8 Key Elements for Comfortable Farmland Living
8 Key Elements for Comfortable Farmland Living 8 Key Elements for Comfortable Farmland Living
8 Key Elements for Comfortable Farmland Living Farmland Bazaar
 
call girls in Shahdara (DELHI) 🔝 >༒9953330565🔝 genuine Escort Service 🔝✔️✔️
call girls in Shahdara (DELHI) 🔝 >༒9953330565🔝 genuine Escort Service 🔝✔️✔️call girls in Shahdara (DELHI) 🔝 >༒9953330565🔝 genuine Escort Service 🔝✔️✔️
call girls in Shahdara (DELHI) 🔝 >༒9953330565🔝 genuine Escort Service 🔝✔️✔️9953056974 Low Rate Call Girls In Saket, Delhi NCR
 
SSPL The Strand Abodes Kharadi Pune Brochure.pdf
SSPL The Strand Abodes Kharadi Pune Brochure.pdfSSPL The Strand Abodes Kharadi Pune Brochure.pdf
SSPL The Strand Abodes Kharadi Pune Brochure.pdfabbu831446
 
Nanke Area Estate commercial ( Dir. Kat Kuo)
Nanke Area Estate commercial ( Dir. Kat Kuo)Nanke Area Estate commercial ( Dir. Kat Kuo)
Nanke Area Estate commercial ( Dir. Kat Kuo)jessica288382
 
Call Girls in Pitampura Delhi 💯Call Us 🔝8264348440🔝
Call Girls in Pitampura Delhi 💯Call Us 🔝8264348440🔝Call Girls in Pitampura Delhi 💯Call Us 🔝8264348440🔝
Call Girls in Pitampura Delhi 💯Call Us 🔝8264348440🔝soniya singh
 
Managed Farmland Brochures to get more in
Managed Farmland Brochures to get more inManaged Farmland Brochures to get more in
Managed Farmland Brochures to get more inknoxdigital1
 
SVN Live 4.22.24 Weekly Property Broadcast
SVN Live 4.22.24 Weekly Property BroadcastSVN Live 4.22.24 Weekly Property Broadcast
SVN Live 4.22.24 Weekly Property BroadcastSVN International Corp.
 
Call Girls In Vasundhara Ghaziabad ❤️8860477959 Low Rate Escorts Service In 2...
Call Girls In Vasundhara Ghaziabad ❤️8860477959 Low Rate Escorts Service In 2...Call Girls In Vasundhara Ghaziabad ❤️8860477959 Low Rate Escorts Service In 2...
Call Girls In Vasundhara Ghaziabad ❤️8860477959 Low Rate Escorts Service In 2...lizamodels9
 

Recently uploaded (20)

Call Girls in Kashmiri Gate Delhi 💯Call Us 🔝8264348440🔝
Call Girls in Kashmiri Gate Delhi 💯Call Us 🔝8264348440🔝Call Girls in Kashmiri Gate Delhi 💯Call Us 🔝8264348440🔝
Call Girls in Kashmiri Gate Delhi 💯Call Us 🔝8264348440🔝
 
Call Girls in Mahavir Nagar whatsaap call US +919953056974
Call Girls in Mahavir Nagar  whatsaap call US  +919953056974Call Girls in Mahavir Nagar  whatsaap call US  +919953056974
Call Girls in Mahavir Nagar whatsaap call US +919953056974
 
9953056974 Low Rate Call Girls In Saket, Delhi NCR
9953056974 Low Rate Call Girls In Saket, Delhi NCR9953056974 Low Rate Call Girls In Saket, Delhi NCR
9953056974 Low Rate Call Girls In Saket, Delhi NCR
 
9990771857 Call Girls in Noida Sector 11 Noida (Call Girls) Delhi
9990771857 Call Girls in Noida Sector 11 Noida (Call Girls) Delhi9990771857 Call Girls in Noida Sector 11 Noida (Call Girls) Delhi
9990771857 Call Girls in Noida Sector 11 Noida (Call Girls) Delhi
 
Rustomjee The Panorama At Pali Hill, Bandra West, Mumbai - Brochure.pdf
Rustomjee The Panorama At Pali Hill, Bandra West, Mumbai - Brochure.pdfRustomjee The Panorama At Pali Hill, Bandra West, Mumbai - Brochure.pdf
Rustomjee The Panorama At Pali Hill, Bandra West, Mumbai - Brochure.pdf
 
Prestige Sector 94 at Noida E Brochure.pdf
Prestige Sector 94 at Noida E Brochure.pdfPrestige Sector 94 at Noida E Brochure.pdf
Prestige Sector 94 at Noida E Brochure.pdf
 
Low Rate Call Girls in Lajpat Nagar Delhi Call 9990771857
Low Rate Call Girls in Lajpat Nagar Delhi Call 9990771857Low Rate Call Girls in Lajpat Nagar Delhi Call 9990771857
Low Rate Call Girls in Lajpat Nagar Delhi Call 9990771857
 
Call Girls In Sahibabad Ghaziabad ❤️8860477959 Low Rate Escorts Service In 24...
Call Girls In Sahibabad Ghaziabad ❤️8860477959 Low Rate Escorts Service In 24...Call Girls In Sahibabad Ghaziabad ❤️8860477959 Low Rate Escorts Service In 24...
Call Girls In Sahibabad Ghaziabad ❤️8860477959 Low Rate Escorts Service In 24...
 
What Is Biophilic Design .pdf
What Is Biophilic Design            .pdfWhat Is Biophilic Design            .pdf
What Is Biophilic Design .pdf
 
Purva Palm Hills Devanahalli, Bangalore E- Brochure.pdf
Purva Palm Hills Devanahalli, Bangalore E- Brochure.pdfPurva Palm Hills Devanahalli, Bangalore E- Brochure.pdf
Purva Palm Hills Devanahalli, Bangalore E- Brochure.pdf
 
9990771857 Call Girls in Noida Sector 10 Noida (Call Girls) Delhi
9990771857 Call Girls in Noida Sector 10 Noida (Call Girls) Delhi9990771857 Call Girls in Noida Sector 10 Noida (Call Girls) Delhi
9990771857 Call Girls in Noida Sector 10 Noida (Call Girls) Delhi
 
Call Girls In The Lalit New Delhi ❤️8860477959 Good Looking Escorts In 24/7 D...
Call Girls In The Lalit New Delhi ❤️8860477959 Good Looking Escorts In 24/7 D...Call Girls In The Lalit New Delhi ❤️8860477959 Good Looking Escorts In 24/7 D...
Call Girls In The Lalit New Delhi ❤️8860477959 Good Looking Escorts In 24/7 D...
 
8 Key Elements for Comfortable Farmland Living
8 Key Elements for Comfortable Farmland Living 8 Key Elements for Comfortable Farmland Living
8 Key Elements for Comfortable Farmland Living
 
call girls in Shahdara (DELHI) 🔝 >༒9953330565🔝 genuine Escort Service 🔝✔️✔️
call girls in Shahdara (DELHI) 🔝 >༒9953330565🔝 genuine Escort Service 🔝✔️✔️call girls in Shahdara (DELHI) 🔝 >༒9953330565🔝 genuine Escort Service 🔝✔️✔️
call girls in Shahdara (DELHI) 🔝 >༒9953330565🔝 genuine Escort Service 🔝✔️✔️
 
SSPL The Strand Abodes Kharadi Pune Brochure.pdf
SSPL The Strand Abodes Kharadi Pune Brochure.pdfSSPL The Strand Abodes Kharadi Pune Brochure.pdf
SSPL The Strand Abodes Kharadi Pune Brochure.pdf
 
Nanke Area Estate commercial ( Dir. Kat Kuo)
Nanke Area Estate commercial ( Dir. Kat Kuo)Nanke Area Estate commercial ( Dir. Kat Kuo)
Nanke Area Estate commercial ( Dir. Kat Kuo)
 
Call Girls in Pitampura Delhi 💯Call Us 🔝8264348440🔝
Call Girls in Pitampura Delhi 💯Call Us 🔝8264348440🔝Call Girls in Pitampura Delhi 💯Call Us 🔝8264348440🔝
Call Girls in Pitampura Delhi 💯Call Us 🔝8264348440🔝
 
Managed Farmland Brochures to get more in
Managed Farmland Brochures to get more inManaged Farmland Brochures to get more in
Managed Farmland Brochures to get more in
 
SVN Live 4.22.24 Weekly Property Broadcast
SVN Live 4.22.24 Weekly Property BroadcastSVN Live 4.22.24 Weekly Property Broadcast
SVN Live 4.22.24 Weekly Property Broadcast
 
Call Girls In Vasundhara Ghaziabad ❤️8860477959 Low Rate Escorts Service In 2...
Call Girls In Vasundhara Ghaziabad ❤️8860477959 Low Rate Escorts Service In 2...Call Girls In Vasundhara Ghaziabad ❤️8860477959 Low Rate Escorts Service In 2...
Call Girls In Vasundhara Ghaziabad ❤️8860477959 Low Rate Escorts Service In 2...
 

JLL Detroit Office Insight & Statistics - Q4 2017

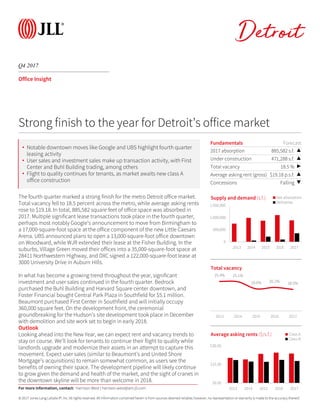
  • 1. © 2017 Jones Lang LaSalle IP, Inc. All rights reserved. All information contained herein is from sources deemed reliable; however, no representation or warranty is made to the accuracy thereof. Q4 2017 Detroit Office Insight The fourth quarter marked a strong finish for the metro Detroit office market. Total vacancy fell to 18.5 percent across the metro, while average asking rents rose to $19.18. In total, 885,582 square feet of office space was absorbed in 2017. Multiple significant lease transactions took place in the fourth quarter, perhaps most notably Google’s announcement to move from Birmingham to a 17,000-square-foot space at the office component of the new Little Caesars Arena. UBS announced plans to open a 13,000-square-foot office downtown on Woodward, while WJR extended their lease at the Fisher Building. In the suburbs, Village Green moved their offices into a 35,000-square-foot space at 28411 Northwestern Highway, and DXC signed a 122,000-square-foot lease at 3000 University Drive in Auburn Hills. In what has become a growing trend throughout the year, significant investment and user sales continued in the fourth quarter. Bedrock purchased the Buhl Building and Harvard Square center downtown, and Foster Financial bought Central Park Plaza in Southfield for $5.1 million. Beaumont purchased First Center in Southfield and will initially occupy 360,000 square feet. On the development front, the ceremonial groundbreaking for the Hudson’s site development took place in December with demolition and site work set to begin in early 2018. Outlook Looking ahead into the New Year, we can expect rent and vacancy trends to stay on course. We’ll look for tenants to continue their flight to quality while landlords upgrade and modernize their assets in an attempt to capture this movement. Expect user sales (similar to Beaumont’s and United Shore Mortgage’s acquisitions) to remain somewhat common, as users see the benefits of owning their space. The development pipeline will likely continue to grow given the demand and health of the market, and the sight of cranes in the downtown skyline will be more than welcome in 2018. Fundamentals Forecast 2017 absorption 885,582 s.f. ▲ Under construction 471,288 s.f. ▲ Total vacancy 18.5 % ▶ Average asking rent (gross) $19.18 p.s.f. ▲ Concessions Falling ▼ 0 500,000 1,000,000 1,500,000 2013 2014 2015 2016 2017 Supply and demand (s.f.) Net absorption Deliveries Strong finish to the year for Detroit’s office market 25.4% 25.1% 19.0% 20.2% 18.5% 2013 2014 2015 2016 2017 Total vacancy $0.00 $15.00 $30.00 2013 2014 2015 2016 2017 Average asking rents ($/s.f.) Class A Class B For more information, contact: Harrison West | harrison.west@am.jll.com • Notable downtown moves like Google and UBS highlight fourth quarter leasing activity • User sales and investment sales make up transaction activity, with First Center and Buhl Building trading, among others • Flight to quality continues for tenants, as market awaits new class A office construction
  • 2. © 2017 Jones Lang LaSalle IP, Inc. All rights reserved. All information contained herein is from sources deemed reliable; however, no representation or warranty is made to the accuracy thereof. Q4 2017 Detroit Office Statistics For more information, contact: Harrison West | harrison.west@am.jll.com Class Inventory (s.f.) Total net absorption (s.f.) YTD total net absorption (s.f.) YTD total net absorption (% of stock) Direct vacancy (%) Total vacancy (%) Average direct asking rent ($ p.s.f.) YTD Completions (s.f.) Under Development (s.f.) CBD Totals 13,317,209 -46,634 -14,412 -0.1% 12.9% 13.5% $21.68 67,430 160,000 New Center Totals 1,142,100 -25,345 29,183 2.6% 21.3% 21.3% $18.62 0 0 Urban Totals 14,459,309 -71,979 14,771 0.1% 13.5% 14.1% $21.25 67,430 160,000 Birmingham/Bloomfield Totals 3,979,668 -10,638 -23,120 -0.6% 16.6% 16.9% $26.25 0 0 Dearborn Totals 2,705,625 41,202 163,855 6.1% 27.7% 27.9% $16.26 0 150,000 Downriver Totals 483,907 -242 -2,157 -0.4% 40.6% 41.2% $14.75 0 0 Farmington/Farmington Hills Totals 4,658,516 1,155 -36,669 -0.8% 18.0% 18.1% $19.32 30,000 0 Macomb Totals 1,286,875 23,703 -565 0.0% 19.2% 19.2% $16.29 0 0 North Oakland Totals 2,207,648 150,476 -20,803 -0.9% 20.2% 20.8% $19.13 0 0 Northern I-275 Corridor Totals 4,467,691 20,700 107,441 2.4% 10.3% 11.7% $18.68 255,980 0 Royal Oak / SE Oakland Totals 706,710 13,141 2,946 0.4% 6.3% 6.3% $15.76 0 131,288 Southern I-275 Corridor Totals 1,077,525 0 -6,917 -0.6% 0.1% 1.1% $15.00 0 0 Southfield Totals 13,595,696 616,243 568,477 4.2% 25.6% 26.5% $17.90 0 0 Troy Totals 11,003,062 106,374 245,194 2.2% 21.5% 22.1% $18.57 0 0 Washtenaw Totals 6,613,772 120,289 148,129 2.2% 8.7% 9.4% $22.57 0 30,000 Suburbs Totals 52,786,695 807,403 870,811 1.6% 19.1% 19.7% $18.88 285,980 311,288 Detroit Totals 67,246,004 735,424 885,582 1.3% 17.9% 18.5% $19.18 353,410 471,288 CBD A 6,194,714 -31,611 -34,835 -0.6% 8.9% 10.1% $23.63 67,430 160,000 Urban A 6,194,714 -31,611 -34,835 -0.6% 8.9% 10.1% $23.63 67,430 160,000 Birmingham/Bloomfield A 1,569,497 -11,170 2,464 0.2% 23.3% 23.7% $28.63 0 0 Dearborn A 446,890 45,313 46,932 10.5% 0.8% 0.8% $27.50 0 150,000 Farmington/Farmington Hills A 618,109 -15,157 -42,362 -6.9% 19.9% 19.9% $24.39 0 0 Macomb A 295,494 2,647 14,359 4.9% 0.7% 0.7% $19.62 0 0 North Oakland A 488,665 11,013 2,546 0.5% 22.2% 22.2% $21.02 0 0 Northern I-275 Corridor A 1,113,719 10,091 4,559 0.4% 5.6% 7.0% $18.85 255,980 0 Southern I-275 Corridor A 832,753 0 -10,217 -1.2% 0.0% 1.2% $0.00 0 0 Southfield A 2,970,217 63,964 28,160 0.9% 23.5% 24.1% $22.42 0 0 Troy A 1,924,131 -74,546 -49,642 -2.6% 18.6% 20.3% $22.00 0 0 Washtenaw A 3,218,983 44,893 58,017 1.8% 10.5% 11.6% $26.06 0 0 Suburbs A 13,478,458 77,048 54,816 0.4% 15.3% 16.1% $23.88 255,980 150,000 Detroit A 19,673,172 45,437 19,981 0.1% 13.3% 14.2% $23.84 323,410 310,000 CBD B 7,122,495 -15,023 20,423 0.3% 16.3% 16.5% $20.61 0 0 New Center B 1,142,100 -25,345 29,183 2.6% 21.3% 21.3% $18.62 0 0 Urban B 8,264,595 -40,368 49,606 0.6% 17.0% 17.2% $20.21 0 0 Birmingham/Bloomfield B 2,410,171 532 -25,584 -1.1% 12.2% 12.4% $22.76 0 0 Dearborn B 2,258,735 -4,111 116,923 5.2% 33.0% 33.3% $16.21 0 0 Downriver B 483,907 -242 -2,157 -0.4% 40.6% 41.2% $14.75 0 0 Farmington/Farmington Hills B 4,040,407 16,312 5,693 0.1% 17.7% 17.8% $18.36 30,000 0 Macomb B 991,381 21,056 -14,924 -1.5% 24.8% 24.8% $16.17 0 0 North Oakland B 1,718,983 139,463 -23,349 -1.4% 19.7% 20.4% $18.51 0 0 Northern I-275 Corridor B 3,353,972 10,609 102,882 3.1% 11.8% 13.3% $18.66 0 0 Royal Oak / SE Oakland B 706,710 13,141 2,946 0.4% 6.3% 6.3% $15.76 0 131,288 Southern I-275 Corridor B 244,772 0 3,300 1.3% 0.5% 0.5% $15.00 0 0 Southfield B 10,625,479 552,279 540,317 5.1% 26.1% 27.1% $16.86 0 0 Troy B 9,078,931 180,920 294,836 3.2% 22.1% 22.4% $17.59 0 0 Washtenaw B 3,394,789 75,396 90,112 2.7% 7.1% 7.3% $18.14 0 30,000 Suburbs B 39,308,237 1,005,355 1,090,995 2.8% 20.4% 20.9% $17.45 30,000 161,288 Detroit B 47,572,832 964,987 1,140,601 2.4% 19.8% 20.3% $17.77 30,000 161,288