SlideShare a Scribd company logo
1 of 6
Download to read offline
© 2018 Jones Lang LaSalle IP, Inc. All rights reserved. All information contained herein is from sources deemed reliable; however, no representation or warranty is made to the accuracy thereof.
Q4 2018
Houston
Office Insight
After snapping a streak of fourteen consecutive quarters of rising vacancy in
the previous quarter, the Houston office market began a new streak in the
fourth quarter: back-to-back quarters of falling vacancy. The fourth quarter
also brought with it the market’s highest quarterly net absorption total since
2013 with over 1.6 million square feet. New construction played a key role in
the fourth quarter’s impressive performance, as over 700,000 square feet of
new product delivered 100.0% leased upon completion. Additionally, several
of the market’s largest leases this year were signed in new construction or
recently delivered construction. Mostly notably, HPE signed on for 568,000
square feet at Springwoods Village, McDermott leased 525,000 square feet at
the never before occupied Energy Center V which delivered in 2016,
Transocean leased 300,000 square feet at the similarly never before occupied
Enclave Place which delivered in 2015, and Waste Management committed to
284,000 square feet at Capitol Tower which is set to deliver next year.
However, despite the surge in net absorption in the second half of the year,
Houston finished 2018 in the red for the fifth year in a row. Although it is
important to note that this year’s -226,000 square feet of absorption is a
massive step forward from the previous two years totals, which saw -2.6
million square feet in 2016 and -2.1 million square feet in 2017.
Outlook
The market’s performance in the fourth quarter confirmed that the third quarter
was not an aberration but rather a meaningful sign that the Houston market is
on the road to recovery. After four years of weakening fundamentals, the market
is finally in a position for sustained growth thanks to strong job growth, high
levels of leasing activity, and, most importantly, positive net absorption. Moving
forward we expect market conditions to continue to favor tenants in the near
term but to return to a more neutral state in the coming years.
Fundamentals Forecast
YTD net absorption -226,309 s.f. ▲
Under construction 2,241,514 s.f. ▶
Total vacancy 23.4% ▶
Average asking rent (gross) $31.34 p.s.f. ▶
Concessions Stable ▶
-5,000,000
0
5,000,000
10,000,000
2015 2016 2017 2018
Supply and demand (s.f.) Net absorption
Deliveries
Market ends the year on an upswing, positioned for
growth moving into 2019
17.6%
20.6%
23.0% 23.4%
2015 2016 2017 2018
Total vacancy
$36.11 $35.75 $35.34 $36.13
$21.25 $21.94 $21.85 $21.98
$0.00
$10.00
$20.00
$30.00
$40.00
2015 2016 2017 2018
Average asking rents ($/s.f.) Class A
Class B
For more information, contact: Reid Watler | reid.watler@am.jll.com
• Building off the momentum of the third quarter, the market posts back-
to-back quarters of positive net absorption and falling vacancy for the
first time since the third quarter of 2012.
• Seven mega-leases of over 200,000 square feet signed in 2018 set the
stage for more positive absorption to come in 2019 and beyond.
• New construction performed strongly in 2018, delivering 95% leased
upon completion. Current construction pipeline is nearly 50% preleased.
Houston
Q4 2018
Office Statistics
Class Inventory (s.f.)
Quarterly
total net
absorption
(s.f.)
YTD total net
absorption (s.f.)
YTD total net
absorption (%
of stock)
Direct vacancy
(%)
Total vacancy
(%)
Average direct
asking rent ($
p.s.f.)
YTD
completions
(s.f.)
Under
construction
(s.f.)
Houston Totals
A 109,823,179 1,648,914 892,730 0.8% 20.5% 24.3% $36.13 881,826 2,241,514
B 58,237,745 38,157 -1,119,039 -1.9% 20.7% 21.7% $21.98 0 0
Totals 168,060,924 1,687,071 -226,309 -0.1% 20.6% 23.4% $31.34 881,826 2,241,514
CBD Totals 35,587,071 294,995 -354,982 -1.0% 18.9% 21.7% $42.52 0 1,887,174
Bellaire Totals 2,250,960 34,904 39,093 1.7% 8.1% 8.9% $28.10 0 0
Galleria Totals 22,726,946 210,021 398,814 1.8% 17.1% 19.4% $34.95 104,579 0
Greenspoint/North Belt Totals 8,948,427 46,094 217,532 2.4% 50.7% 51.7% $19.45 0 0
Greenway Plaza Totals 9,970,524 93,796 -31,152 -0.3% 16.1% 17.2% $33.89 0 0
Medical Center Totals 3,644,104 -288,333 -247,048 -6.8% 8.9% 8.9% $28.77 0 0
Midtown Totals 4,126,027 -2,003 47,827 1.2% 13.9% 14.3% $29.52 0 0
Northwest Totals 8,572,779 61,161 -428,430 -5.0% 28.7% 31.7% $23.59 0 0
San Felipe/Voss Totals 5,064,935 -102,329 -299,955 -5.9% 21.0% 22.7% $30.05 0 0
Southwest Totals 6,028,999 -70,405 -132,764 -2.2% 26.1% 27.1% $17.97 0 0
Suburban Near Totals 71,333,701 -17,094 -436,083 -0.6% 22.7% 24.3% $26.85 104,579 0
Katy Freeway East Totals 5,541,549 13,226 113,734 2.1% 12.8% 13.4% $35.31 0 0
Katy Freeway West Totals 19,859,295 225,027 33,454 0.2% 24.9% 32.6% $30.90 72,045 0
Westchase Totals 12,896,735 72,271 -480,007 -3.7% 21.4% 27.3% $29.10 0 0
Energy Corridor Totals 38,297,579 310,524 -332,819 -0.9% 21.9% 28.0% $30.58 72,045 0
FM 1960 Totals 5,891,668 161,928 -15,221 -0.3% 17.3% 19.0% $18.59 0 156,000
Gulf Freeway/Pasadena Totals 1,518,142 131,300 122,234 8.1% 9.4% 9.9% $21.04 0 0
NASA/Clear Lake Totals 3,206,107 62,913 -6,094 -0.2% 16.5% 16.6% $22.15 0 0
Sugar Land Totals 4,222,047 12,681 -82,589 -2.0% 8.7% 11.9% $28.03 0 0
The Woodlands Totals 8,004,609 729,824 879,245 11.0% 14.4% 15.1% $32.11 705,202 198,340
Suburban Outlying Totals 22,842,573 1,098,646 897,575 3.9% 14.1% 15.4% $24.06 705,202 354,340
Houston Totals 168,060,924 1,687,071 -226,309 -0.1% 20.6% 23.4% $31.34 881,826 2,241,514
CBD A 27,929,895 180,554 -325,247 -1.2% 18.6% 21.9% $44.27 0 1,887,174
Bellaire A 1,375,713 37,056 68,874 5.0% 8.7% 9.0% $28.99 0 0
Galleria A 17,779,271 215,113 656,291 3.7% 17.0% 19.3% $37.46 104,579 0
Greenspoint/North Belt A 4,676,389 68,800 94,461 2.0% 60.2% 61.4% $22.42 0 0
Greenway Plaza A 7,395,743 11,802 -66,458 -0.9% 17.6% 19.0% $36.26 0 0
Medical Center A 1,624,079 6,714 37,960 2.3% 11.2% 11.2% $31.97 0 0
Midtown A 2,006,668 8,816 79,729 4.0% 18.0% 18.1% $32.16 0 0
Northwest A 3,874,504 38,500 -409,168 -10.6% 38.5% 43.2% $25.65 0 0
San Felipe/Voss A 1,720,793 3,272 -119,895 -7.0% 27.8% 29.0% $36.15 0 0
Southwest A 1,580,642 25,469 27,075 1.7% 24.0% 24.0% $19.11 0 0
Suburban Near A 42,033,802 415,542 368,869 0.9% 24.1% 26.0% $30.47 104,579 0
Katy Freeway East A 4,105,103 23,345 103,171 2.5% 13.8% 14.1% $40.64 0 0
Katy Freeway West A 14,446,523 135,002 320,034 2.2% 22.9% 33.3% $35.20 72,045 0
Westchase A 8,788,607 -19,272 -326,193 -3.7% 22.2% 30.5% $34.61 0 0
Energy Corridor A 27,340,233 139,075 97,012 0.4% 21.3% 29.5% $35.39 72,045 0
FM 1960 A 2,347,252 121,246 32,115 1.4% 7.9% 11.0% $28.79 0 156,000
Gulf Freeway/Pasadena A 0 0 0 0.0% 0.0% 0.0% $0.00 0 0
NASA/Clear Lake A 1,342,961 13,740 -63,626 -4.7% 11.9% 12.1% $24.34 0 0
Sugar Land A 2,924,208 47,088 -57,735 -2.0% 6.4% 10.8% $31.85 0 0
The Woodlands A 5,904,828 731,669 841,342 14.2% 13.8% 14.5% $35.16 705,202 198,340
Suburban Outlying A 12,519,249 913,743 752,096 6.0% 10.7% 12.7% $31.72 705,202 354,340
Houston A 109,823,179 1,648,914 892,730 0.8% 20.5% 24.3% $36.13 881,826 2,241,514
Reid Watler | Manager, Research
1400 Post Oak Suite 1100 Houston, TX 77056 | reid.watler@am.jll.com
2019 Jones Lang LaSalle IP, Inc. All rights reserved.
Houston | Office Statistics | Q4 2018
Class Inventory (s.f.)
Total net
absorption (s.f.)
YTD total net
absorption (s.f.)
YTD total net
absorption (%
of stock)
Direct vacancy
(%)
Total vacancy
(%)
Average direct
asking rent ($
p.s.f.)
YTD
completions
(s.f.)
Under
construction
(s.f.)
CBD B 7,657,176 114,441 -29,735 -0.4% 20.1% 21.0% $30.55 0 0
Bellaire B 875,247 -2,152 -29,781 -3.4% 7.2% 8.8% $26.80 0 0
Galleria B 4,947,675 -5,092 -257,477 -5.2% 17.8% 19.6% $27.44 0 0
Greenspoint/North Belt B 4,272,038 -22,706 123,071 2.9% 40.2% 41.0% $15.50 0 0
Greenway Plaza B 2,574,781 81,994 35,306 1.4% 11.8% 12.0% $27.22 0 0
Medical Center B 2,020,025 -295,047 -285,008 -14.1% 7.1% 7.1% $24.69 0 0
Midtown B 2,119,359 -10,819 -31,902 -1.5% 9.9% 10.7% $27.26 0 0
Northwest B 4,698,275 22,661 -19,262 -0.4% 20.5% 22.2% $20.44 0 0
San Felipe/Voss B 3,344,142 -105,601 -180,060 -5.4% 17.6% 19.5% $25.24 0 0
Southwest B 4,448,357 -95,874 -159,839 -3.6% 26.8% 28.2% $17.34 0 0
Suburban Near B 29,299,899 -432,636 -804,952 -2.7% 20.7% 21.9% $21.27 0 0
Katy Freeway East B 1,436,446 -10,119 10,563 0.7% 9.7% 11.7% $22.01 0 0
Katy Freeway West B 5,412,772 90,025 -286,580 -5.3% 30.1% 30.8% $21.96 0 0
Westchase B 4,108,128 91,543 -153,814 -3.7% 19.6% 20.5% $20.65 0 0
Energy Corridor B 10,957,346 171,449 -429,831 -3.9% 23.5% 24.4% $21.47 0 0
FM 1960 B 3,544,416 40,682 -47,336 -1.3% 23.5% 24.3% $16.69 0 0
Gulf Freeway/Pasadena B 1,518,142 131,300 122,234 8.1% 9.4% 9.9% $21.04 0 0
NASA/Clear Lake B 1,863,146 49,173 57,532 3.1% 19.9% 19.9% $21.31 0 0
Sugar Land B 1,297,839 -34,407 -24,854 -1.9% 13.8% 14.4% $23.08 0 0
The Woodlands B 2,099,781 -1,845 37,903 1.8% 16.2% 16.6% $26.33 0 0
Suburban Outlying B 10,323,324 184,903 145,479 1.4% 18.1% 18.6% $19.98 0 0
Houston B 58,237,745 38,157 -1,119,039 -1.9% 20.7% 21.7% $21.98 0 0
Reid Watler | Manager, Research
1400 Post Oak Suite 1100 Houston, TX 77056 | reid.watler@am.jll.com
2019 Jones Lang LaSalle IP, Inc. All rights reserved.
Houston
Q4 2018
Office leasing activity
Leasing activity by size (s.f.)

2,631,894
31
6,491,718
106
2,461,798
170,096
123.2
Growing Shrinking Stable
83,630
0
2,469,393
78,871
0
0
Notable leasing transactions
Size Footprint Term (mos)
524,399 Stable 132
284,331 Shrinking 180
284,000 Stable 181
284,000 Stable 181
97,708 Stable 176
87,231 Stable 120
83,518 Growing 360
83,336 Stable 130
68,958 Stable 18
68,706 Growing 116Encino Energy, LLC 5847 San Felipe St San Felipe/Voss Direct
McGriff, Seibels & Williams 10100 Katy Fwy Katy Freeway East Direct
City of Houston 1100 Louisiana St CBD Sublease
Arena Energy 2103 Research Forest Dr The Woodlands
PROS, Inc.
Direct
Houston Forensic Science 500 Jefferson St CBD Direct
Direct
800 Capitol St CBDWaste Management Inc
HPE
HPE
Direct
E Mossy Oaks Rd The Woodlands Direct
3200 Kirby Dr Greenway Plaza
Type
915 N Eldridge Pkwy Katy Freeway West DirectMcDermott International
Tenant Address Submarket
Direct
E Mossy Oaks Rd The Woodlands
At a glance
Quarterly leasing activity (s.f.)
Quarterly number of
transactions
YTD leasing activity (s.f.)
Tenant footprint
6 1 24
YTD number of transactions
Leasing activity by transaction type
Leasing activity by submarketLeasing activity by industry
Quarterly Class A leasing
activity (s.f.)
Expansion in market
Expansion in building
Renewal
Extension (< 36-month term)
Relocation within market
New to market
Average term (months)
Quarterly Class B leasing
activity (s.f.)
1,376,730
351,793
528,870
110,087
264,414
0
500,000
1,000,000
1,500,000
100,000+ 75,000-99,999 50,000-74,999 30,000-49,999 20,000-29,999
23%
17%
17%
10%
10%
7%
3%
3%
3%
3%3%
CBD The Woodlands
Katy Freeway West Midtown
Galleria Katy Freeway East
FM 1960 San Felipe/Voss
Greenway Plaza Southwest
Northwest
25%
20%
15%
10%
10%
5%
5%
5%
5%
Energy and utilities Technology
Engineering Government
Real estate Law firm
Insurance Business services
Banking
0
1,000,000
2,000,000
3,000,000
Q3 2017 Q4 2017 Q1 2018 Q2 2018 Q3 2018 Q4 2018
Historical leasing activity
Source: JLL Research | Note: This report analyzes all closed office leases >20,000 s.f. 2019 Jones Lang LaSalle IP, Inc. All rights reserved.
Houston
Q4 2018
Office development
Total available at delivery (%) 4.2%
Total leased at delivery (%) 95.8%
Average floor plate (s.f.) 35,100
Average number of stories 11
Average asking rent ($ p.s.f.) $37.19
Notable deliveries year-to-date
Building Submarket RBA (s.f.) Delivered
Leased at
delivery (%)
1701 City Plaza Dr 326,800 Q4 2018 100.0%
11300 Energy Dr 189,201 Q4 2018 100.0%
11400 Energy Dr 189,201 Q4 2018 100.0%
1600 W Loop S 104,579 Q1 2018 70.0%
2322 W Grand Parkway N 72,045 Q1 2018 92.6%
Total pre-leased (%) 45.6%
Total under construction (s.f.) 2,241,514
Total under renovation (s.f.) 0
Average floor plate (s.f.) 28,840
Average asking rent ($ p.s.f.) $48.24
Notable projects under construction
Building RBA (s.f.)
Estimated
delivery
Pre-leased (%)
801 Texas Ave 1,106,581 Q4 2021 33.2%
800 Capitol St 780,593 Q2 2019 81.0%
19350 State Highway 249 156,000 Q3 2019 0.0%
1700 City Plaza Dr 149,500 Q2 2019 0.0%
1401 Lake Plaza Dr 48,840 Q2 2019 45.2%
BTSPatrinely
BTS
Landry's
Spec/BTSOwner/developer
Speculative
BTSPatrinely
Patrinely
Historical completions
Deliveries
At a glance
881,826
YTD deliveries (s.f.)
Speculative
CBD Hines Speculative
Owner/developer Spec or BTSSubmarket
Under construction/renovation
2,241,514
Under construction/renovation (s.f.)
At a glance
Upcoming deliveries by year (s.f., excludes YTD completions)
Speculative
Speculative
The Woodlands Patrinely Speculative
The Woodlands
SkanskaCBD
FM 1960 Greenwood Properties Speculative
The Urban Companies
The Woodlands
The Woodlands
The Woodlands
Patrinely
Katy Freeway West
Galleria
1,134,933
1,106,581
1,090,000
1,095,000
1,100,000
1,105,000
1,110,000
1,115,000
1,120,000
1,125,000
1,130,000
1,135,000
1,140,000
2019 2021
4,063,481
8,071,906
2,485,974
2,819,444
881,826
0
1,000,000
2,000,000
3,000,000
4,000,000
5,000,000
6,000,000
7,000,000
8,000,000
9,000,000
2014 2015 2016 2017 2018
Source: JLL Research | Note: This report analyzes all office developments under construction/renovation >30,000 s.f. 2019 Jones Lang LaSalle IP, Inc. All rights reserved.
Houston
Q4 2018
Office sales activity
$1,706,709,138
40
$214
6.4%
5.3%
94.7%
5.5-6.5% 0 0 $0
7-8.5% 0.0% 40 $1,706,709,138
Notable sales transactions year-to-date
RBA (s.f.) $ p.s.f. Sale date
511,225 $794 Jul-18
1,197,300 $147 Feb-18
554,385 $199 Sep-18
504,609 $200 Jan-18
313,420 $322 Aug-18
574,944 $127 Mar-18
806,541 $87 Feb-18
375,440 $181 Jun-18
248,707 $255 Aug-18
276,770 $197 Mar-18
The Aztec Fund
Norvin Properties
Davidson Kempner Capital
Management, Lexington Realty
M-M Properties, Baupost Group CBRE Global Investors
Lexington Realty Trust
Griffin Partners, Investcorp
Transwestern
$176,500,000
$110,433,467
$101,000,000
$101,000,000
Top 5 sellers (s.f.)Top 5 buyers (s.f.)
Lonza Houston Zeller Realty Group Pinchal & Company $54,400,000
1001 McKinney TRC Capital Partners, Amstar
Cameron Management, Silverpeak Real
Estate Partners
$68,000,000
Westgate I Nicola Crosby Real Estate
Transwestern, Miller Global Properties,
LLC
$63,420,285
Loop Central I-III
Griffin Partners, Wheelock
Street Capital, LLC
TIER REIT $72,980,000
Brookhollow Central I-III Hertz Investment Group
Parmenter Realty Partners, Cohen &
Steers
$70,500,000
Pin Oak Park Portfolio
Westway Plaza
Marathon Oil Tower
Western Geophysical
Memorial Hermann Medical
Plaza
LaSalle Investment
Management
Mischer Investments $405,000,000
Building Buyer Seller Sale price ($)
Number of transactions
Average Class A cap rate
Sales volume $ by submarket
Urban sales volume as % of
total
Suburban sales volume as %
of total
Cap rate range
Sales activity by building classAt a glance
YTD sales volume
Foreign capital
Average partial interest
acquired
Number of foreign
buyers
Domestic capital
Average Class A price p.s.f.
Transactions details
Number of partial interest
transactions
Core Class A CBD
Core Class A suburban
Number of domestic
buyers
1,197,300 s.f.
806,541 s.f.
633,280 s.f.
574,944 s.f.
568,458 s.f.
M-M Properties, Baupost Group
Hertz Investment Group
Davidson Kempner Capital Management, Lexington Realty Trust
Griffin Partners, Wheelock Street Capital, LLC
Lawrence Wong
1,197,300 s.f.
806,541 s.f.
633,280 s.f.
574,944 s.f.
568,458 s.f.
CBRE Global Investors
Parmenter Realty Partners, Cohen & Steers
Lexington Realty Trust
TIER REIT
Halliburton
$6,025,000
$7,800,000
$14,620,000
$17,800,000
$22,026,288
$23,030,954
$39,000,000
$52,212,896
$53,000,000
$54,400,000
$89,717,029
$91,865,000
$105,500,000
$170,933,467
$173,980,000
$176,500,000
$203,298,504
$405,000,000
Southwest
Gulf…
NASA/Clear Lake
Greenway Plaza
San Felipe/Voss
Greenspoint/North…
Sugar Land
The Woodlands
Katy Freeway East
South
CBD
Northwest
FM 1960
Westchase
Bellaire
Galleria
Katy Freeway West
Medical Center
$1,180,041,400
$520,642,738
$6,025,000
$0
$200,000,000
$400,000,000
$600,000,000
$800,000,000
$1,000,000,000
$1,200,000,000
$1,400,000,000
A B C
Source: JLL Research | Note: This report analyzes all year-to-date office sales > 50,000 s.f. 2019 Jones Lang LaSalle IP, Inc. All rights reserved.

More Related Content

What's hot

JLL Cincinnati Office Insight & Statistics - Q3 2016
JLL Cincinnati Office Insight & Statistics - Q3 2016JLL Cincinnati Office Insight & Statistics - Q3 2016
JLL Cincinnati Office Insight & Statistics - Q3 2016Ross Bratcher
 
JLL Columbus Office Outlook - Q4 2020
JLL Columbus Office Outlook - Q4 2020JLL Columbus Office Outlook - Q4 2020
JLL Columbus Office Outlook - Q4 2020Emma Gresky
 
JLL Pittsburgh Office Insight & Statistics - Q4 2019
JLL Pittsburgh Office Insight & Statistics - Q4 2019JLL Pittsburgh Office Insight & Statistics - Q4 2019
JLL Pittsburgh Office Insight & Statistics - Q4 2019Tobiah Bilski
 
JLL Detroit Office Insight & Statistics – Q2 2016
JLL Detroit Office Insight & Statistics – Q2 2016JLL Detroit Office Insight & Statistics – Q2 2016
JLL Detroit Office Insight & Statistics – Q2 2016Aaron Moore
 
JLL Pittsburgh Office Insight & Statistics - Q4 2017
JLL Pittsburgh Office Insight & Statistics - Q4 2017JLL Pittsburgh Office Insight & Statistics - Q4 2017
JLL Pittsburgh Office Insight & Statistics - Q4 2017Tobiah Bilski
 
JLL Cleveland Office Outlook: Q4 2018
JLL Cleveland Office Outlook: Q4 2018JLL Cleveland Office Outlook: Q4 2018
JLL Cleveland Office Outlook: Q4 2018Andrew Batson
 
JLL Pittsburgh Office Insight & Statistics - Q2 2020
JLL Pittsburgh Office Insight & Statistics - Q2 2020JLL Pittsburgh Office Insight & Statistics - Q2 2020
JLL Pittsburgh Office Insight & Statistics - Q2 2020Tobiah Bilski
 
Webcast - 2Q18
Webcast - 2Q18Webcast - 2Q18
Webcast - 2Q18Localiza
 
JLL Cleveland Office Outlook: Q3 2020
JLL Cleveland Office Outlook: Q3 2020JLL Cleveland Office Outlook: Q3 2020
JLL Cleveland Office Outlook: Q3 2020Andrew Batson
 
JLL Pittsburgh Office Insight & Statistics - Q1 2018
JLL Pittsburgh Office Insight & Statistics - Q1 2018JLL Pittsburgh Office Insight & Statistics - Q1 2018
JLL Pittsburgh Office Insight & Statistics - Q1 2018Tobiah Bilski
 
JLL Columbus Office Outlook: Q3 2016
JLL Columbus Office Outlook: Q3 2016JLL Columbus Office Outlook: Q3 2016
JLL Columbus Office Outlook: Q3 2016Peter McStravick
 
Pittsburgh Office Insight & Stats Q1 2022
Pittsburgh Office Insight & Stats Q1 2022Pittsburgh Office Insight & Stats Q1 2022
Pittsburgh Office Insight & Stats Q1 2022Tobiah Bilski
 
Results presentation 3 q11
Results presentation 3 q11Results presentation 3 q11
Results presentation 3 q11comgasri
 
JLL Louisville Industrial Outlook - Q4 2019
JLL Louisville Industrial Outlook - Q4 2019JLL Louisville Industrial Outlook - Q4 2019
JLL Louisville Industrial Outlook - Q4 2019Alex Westcott
 
JLL Grand Rapids Office Insight & Statistics - Q4 2019
JLL Grand Rapids Office Insight & Statistics - Q4 2019JLL Grand Rapids Office Insight & Statistics - Q4 2019
JLL Grand Rapids Office Insight & Statistics - Q4 2019Harrison West
 
JLL Louisville Office Outlook - Q3 2018
JLL Louisville Office Outlook - Q3 2018JLL Louisville Office Outlook - Q3 2018
JLL Louisville Office Outlook - Q3 2018Alex Westcott
 
Q4 2014 San Francisco Office Report
Q4 2014 San Francisco Office ReportQ4 2014 San Francisco Office Report
Q4 2014 San Francisco Office ReportCoy Davidson
 
Q4 2015 Austin Office Market Research & Forecast Report
Q4 2015 Austin Office Market Research & Forecast ReportQ4 2015 Austin Office Market Research & Forecast Report
Q4 2015 Austin Office Market Research & Forecast ReportLisa Bridges
 

What's hot (19)

JLL Cincinnati Office Insight & Statistics - Q3 2016
JLL Cincinnati Office Insight & Statistics - Q3 2016JLL Cincinnati Office Insight & Statistics - Q3 2016
JLL Cincinnati Office Insight & Statistics - Q3 2016
 
JLL Columbus Office Outlook - Q4 2020
JLL Columbus Office Outlook - Q4 2020JLL Columbus Office Outlook - Q4 2020
JLL Columbus Office Outlook - Q4 2020
 
JLL Pittsburgh Office Insight & Statistics - Q4 2019
JLL Pittsburgh Office Insight & Statistics - Q4 2019JLL Pittsburgh Office Insight & Statistics - Q4 2019
JLL Pittsburgh Office Insight & Statistics - Q4 2019
 
JLL Detroit Office Insight & Statistics – Q2 2016
JLL Detroit Office Insight & Statistics – Q2 2016JLL Detroit Office Insight & Statistics – Q2 2016
JLL Detroit Office Insight & Statistics – Q2 2016
 
JLL Pittsburgh Office Insight & Statistics - Q4 2017
JLL Pittsburgh Office Insight & Statistics - Q4 2017JLL Pittsburgh Office Insight & Statistics - Q4 2017
JLL Pittsburgh Office Insight & Statistics - Q4 2017
 
JLL Cleveland Office Outlook: Q4 2018
JLL Cleveland Office Outlook: Q4 2018JLL Cleveland Office Outlook: Q4 2018
JLL Cleveland Office Outlook: Q4 2018
 
JLL Pittsburgh Office Insight & Statistics - Q2 2020
JLL Pittsburgh Office Insight & Statistics - Q2 2020JLL Pittsburgh Office Insight & Statistics - Q2 2020
JLL Pittsburgh Office Insight & Statistics - Q2 2020
 
Webcast - 2Q18
Webcast - 2Q18Webcast - 2Q18
Webcast - 2Q18
 
JLL Cleveland Office Outlook: Q3 2020
JLL Cleveland Office Outlook: Q3 2020JLL Cleveland Office Outlook: Q3 2020
JLL Cleveland Office Outlook: Q3 2020
 
JLL Pittsburgh Office Insight & Statistics - Q1 2018
JLL Pittsburgh Office Insight & Statistics - Q1 2018JLL Pittsburgh Office Insight & Statistics - Q1 2018
JLL Pittsburgh Office Insight & Statistics - Q1 2018
 
JLL Columbus Office Outlook: Q3 2016
JLL Columbus Office Outlook: Q3 2016JLL Columbus Office Outlook: Q3 2016
JLL Columbus Office Outlook: Q3 2016
 
Pittsburgh Office Insight & Stats Q1 2022
Pittsburgh Office Insight & Stats Q1 2022Pittsburgh Office Insight & Stats Q1 2022
Pittsburgh Office Insight & Stats Q1 2022
 
Results presentation 3 q11
Results presentation 3 q11Results presentation 3 q11
Results presentation 3 q11
 
JLL Louisville Industrial Outlook - Q4 2019
JLL Louisville Industrial Outlook - Q4 2019JLL Louisville Industrial Outlook - Q4 2019
JLL Louisville Industrial Outlook - Q4 2019
 
JLL Grand Rapids Office Insight & Statistics - Q4 2019
JLL Grand Rapids Office Insight & Statistics - Q4 2019JLL Grand Rapids Office Insight & Statistics - Q4 2019
JLL Grand Rapids Office Insight & Statistics - Q4 2019
 
JLL Louisville Office Outlook - Q3 2018
JLL Louisville Office Outlook - Q3 2018JLL Louisville Office Outlook - Q3 2018
JLL Louisville Office Outlook - Q3 2018
 
Q4 2014 San Francisco Office Report
Q4 2014 San Francisco Office ReportQ4 2014 San Francisco Office Report
Q4 2014 San Francisco Office Report
 
Q4 2015 Austin Office Market Research & Forecast Report
Q4 2015 Austin Office Market Research & Forecast ReportQ4 2015 Austin Office Market Research & Forecast Report
Q4 2015 Austin Office Market Research & Forecast Report
 
Q4 2015 Austin Office Market Research & Forecast Report
Q4 2015 Austin Office Market Research & Forecast ReportQ4 2015 Austin Office Market Research & Forecast Report
Q4 2015 Austin Office Market Research & Forecast Report
 

Similar to JLL Houston Office Market Report - Q4 2018

JLL Detroit Office Insight & Statistics - Q4 2017
JLL Detroit Office Insight & Statistics - Q4 2017JLL Detroit Office Insight & Statistics - Q4 2017
JLL Detroit Office Insight & Statistics - Q4 2017Harrison West
 
JLL Detroit Office Insight & Statistics - Q4 2019
JLL Detroit Office Insight & Statistics - Q4 2019JLL Detroit Office Insight & Statistics - Q4 2019
JLL Detroit Office Insight & Statistics - Q4 2019Harrison West
 
JLL Detroit Office Insight & Statistics - Q4 2018
JLL Detroit Office Insight & Statistics - Q4 2018JLL Detroit Office Insight & Statistics - Q4 2018
JLL Detroit Office Insight & Statistics - Q4 2018Harrison West
 
JLL Detroit Office Insight & Statistics - Q1 2019
JLL Detroit Office Insight & Statistics - Q1 2019JLL Detroit Office Insight & Statistics - Q1 2019
JLL Detroit Office Insight & Statistics - Q1 2019Harrison West
 
JLL Detroit Office Insight & Statistics - Q3 2018
JLL Detroit Office Insight & Statistics - Q3 2018JLL Detroit Office Insight & Statistics - Q3 2018
JLL Detroit Office Insight & Statistics - Q3 2018Harrison West
 
JLL Detroit Office Insight & Statistics - Q3 2019
JLL Detroit Office Insight & Statistics - Q3 2019JLL Detroit Office Insight & Statistics - Q3 2019
JLL Detroit Office Insight & Statistics - Q3 2019Harrison West
 
Q1 2017 - Chicago Suburbs Office Reports
Q1 2017 - Chicago Suburbs Office ReportsQ1 2017 - Chicago Suburbs Office Reports
Q1 2017 - Chicago Suburbs Office ReportsHailey Harrington
 
JLL Cincinnati Industrial Outlook - Q3 2016
JLL Cincinnati Industrial Outlook - Q3 2016JLL Cincinnati Industrial Outlook - Q3 2016
JLL Cincinnati Industrial Outlook - Q3 2016Ross Bratcher
 
JLL Downtown Chicago Office Market Update - Q3 2016
JLL Downtown Chicago Office Market Update - Q3 2016JLL Downtown Chicago Office Market Update - Q3 2016
JLL Downtown Chicago Office Market Update - Q3 2016Hailey Harrington
 
JLL Cincinnati Office Insight & Statistics - Q2 2016
JLL Cincinnati Office Insight & Statistics - Q2 2016JLL Cincinnati Office Insight & Statistics - Q2 2016
JLL Cincinnati Office Insight & Statistics - Q2 2016Ross Bratcher
 
JLL Detroit Office Insight & Statistics - Q3 2017
JLL Detroit Office Insight & Statistics - Q3 2017JLL Detroit Office Insight & Statistics - Q3 2017
JLL Detroit Office Insight & Statistics - Q3 2017Harrison West
 
JLL Detroit Office Insight & Statistics - Q2 2019
JLL Detroit Office Insight & Statistics - Q2 2019JLL Detroit Office Insight & Statistics - Q2 2019
JLL Detroit Office Insight & Statistics - Q2 2019Harrison West
 
JLL Detroit Office Insight & Statistics - Q2 2017
JLL Detroit Office Insight & Statistics - Q2 2017JLL Detroit Office Insight & Statistics - Q2 2017
JLL Detroit Office Insight & Statistics - Q2 2017Harrison West
 
JLL Louisville Office Outlook - Q3 2019
JLL Louisville Office Outlook - Q3 2019JLL Louisville Office Outlook - Q3 2019
JLL Louisville Office Outlook - Q3 2019Alex Westcott
 
JLL Pittsburgh Office Insight & Statistics - Q3 2021
JLL Pittsburgh Office Insight & Statistics - Q3 2021JLL Pittsburgh Office Insight & Statistics - Q3 2021
JLL Pittsburgh Office Insight & Statistics - Q3 2021Tobiah Bilski
 
JLL Detroit Office Insight & Statistics - Q1 2017
JLL Detroit Office Insight & Statistics - Q1 2017JLL Detroit Office Insight & Statistics - Q1 2017
JLL Detroit Office Insight & Statistics - Q1 2017Harrison West
 
JLL Pittsburgh Office Insight & Statistics - Q1 2019
JLL Pittsburgh Office Insight & Statistics - Q1 2019JLL Pittsburgh Office Insight & Statistics - Q1 2019
JLL Pittsburgh Office Insight & Statistics - Q1 2019Tobiah Bilski
 
JLL Louisville Office Outlook - Q4 2018
JLL Louisville Office Outlook - Q4 2018JLL Louisville Office Outlook - Q4 2018
JLL Louisville Office Outlook - Q4 2018Alex Westcott
 
Jll cincinnati office outlook q2 2017
Jll cincinnati office outlook   q2 2017Jll cincinnati office outlook   q2 2017
Jll cincinnati office outlook q2 2017Abby Armbruster
 

Similar to JLL Houston Office Market Report - Q4 2018 (20)

JLL Detroit Office Insight & Statistics - Q4 2017
JLL Detroit Office Insight & Statistics - Q4 2017JLL Detroit Office Insight & Statistics - Q4 2017
JLL Detroit Office Insight & Statistics - Q4 2017
 
JLL Detroit Office Insight & Statistics - Q4 2019
JLL Detroit Office Insight & Statistics - Q4 2019JLL Detroit Office Insight & Statistics - Q4 2019
JLL Detroit Office Insight & Statistics - Q4 2019
 
JLL Detroit Office Insight & Statistics - Q4 2018
JLL Detroit Office Insight & Statistics - Q4 2018JLL Detroit Office Insight & Statistics - Q4 2018
JLL Detroit Office Insight & Statistics - Q4 2018
 
JLL Detroit Office Insight & Statistics - Q1 2019
JLL Detroit Office Insight & Statistics - Q1 2019JLL Detroit Office Insight & Statistics - Q1 2019
JLL Detroit Office Insight & Statistics - Q1 2019
 
JLL Detroit Office Insight & Statistics - Q3 2018
JLL Detroit Office Insight & Statistics - Q3 2018JLL Detroit Office Insight & Statistics - Q3 2018
JLL Detroit Office Insight & Statistics - Q3 2018
 
JLL Detroit Office Insight & Statistics - Q3 2019
JLL Detroit Office Insight & Statistics - Q3 2019JLL Detroit Office Insight & Statistics - Q3 2019
JLL Detroit Office Insight & Statistics - Q3 2019
 
Q1 2017 - Chicago Suburbs Office Reports
Q1 2017 - Chicago Suburbs Office ReportsQ1 2017 - Chicago Suburbs Office Reports
Q1 2017 - Chicago Suburbs Office Reports
 
JLL Cincinnati Industrial Outlook - Q3 2016
JLL Cincinnati Industrial Outlook - Q3 2016JLL Cincinnati Industrial Outlook - Q3 2016
JLL Cincinnati Industrial Outlook - Q3 2016
 
JLL Downtown Chicago Office Market Update - Q3 2016
JLL Downtown Chicago Office Market Update - Q3 2016JLL Downtown Chicago Office Market Update - Q3 2016
JLL Downtown Chicago Office Market Update - Q3 2016
 
JLL Cincinnati Office Insight & Statistics - Q2 2016
JLL Cincinnati Office Insight & Statistics - Q2 2016JLL Cincinnati Office Insight & Statistics - Q2 2016
JLL Cincinnati Office Insight & Statistics - Q2 2016
 
JLL Detroit Office Insight & Statistics - Q3 2017
JLL Detroit Office Insight & Statistics - Q3 2017JLL Detroit Office Insight & Statistics - Q3 2017
JLL Detroit Office Insight & Statistics - Q3 2017
 
JLL Detroit Office Insight & Statistics - Q2 2019
JLL Detroit Office Insight & Statistics - Q2 2019JLL Detroit Office Insight & Statistics - Q2 2019
JLL Detroit Office Insight & Statistics - Q2 2019
 
Q1 2017 Houston Office Research & Forecast Report
Q1 2017 Houston Office Research & Forecast Report Q1 2017 Houston Office Research & Forecast Report
Q1 2017 Houston Office Research & Forecast Report
 
JLL Detroit Office Insight & Statistics - Q2 2017
JLL Detroit Office Insight & Statistics - Q2 2017JLL Detroit Office Insight & Statistics - Q2 2017
JLL Detroit Office Insight & Statistics - Q2 2017
 
JLL Louisville Office Outlook - Q3 2019
JLL Louisville Office Outlook - Q3 2019JLL Louisville Office Outlook - Q3 2019
JLL Louisville Office Outlook - Q3 2019
 
JLL Pittsburgh Office Insight & Statistics - Q3 2021
JLL Pittsburgh Office Insight & Statistics - Q3 2021JLL Pittsburgh Office Insight & Statistics - Q3 2021
JLL Pittsburgh Office Insight & Statistics - Q3 2021
 
JLL Detroit Office Insight & Statistics - Q1 2017
JLL Detroit Office Insight & Statistics - Q1 2017JLL Detroit Office Insight & Statistics - Q1 2017
JLL Detroit Office Insight & Statistics - Q1 2017
 
JLL Pittsburgh Office Insight & Statistics - Q1 2019
JLL Pittsburgh Office Insight & Statistics - Q1 2019JLL Pittsburgh Office Insight & Statistics - Q1 2019
JLL Pittsburgh Office Insight & Statistics - Q1 2019
 
JLL Louisville Office Outlook - Q4 2018
JLL Louisville Office Outlook - Q4 2018JLL Louisville Office Outlook - Q4 2018
JLL Louisville Office Outlook - Q4 2018
 
Jll cincinnati office outlook q2 2017
Jll cincinnati office outlook   q2 2017Jll cincinnati office outlook   q2 2017
Jll cincinnati office outlook q2 2017
 

More from DavidDominy1

JLL Q4 2018 Multifamily Overview
JLL Q4 2018 Multifamily OverviewJLL Q4 2018 Multifamily Overview
JLL Q4 2018 Multifamily OverviewDavidDominy1
 
JLL Q4 2018 Multifamily Overview
JLL Q4 2018 Multifamily OverviewJLL Q4 2018 Multifamily Overview
JLL Q4 2018 Multifamily OverviewDavidDominy1
 
2018 Multifamily Overview
2018 Multifamily Overview2018 Multifamily Overview
2018 Multifamily OverviewDavidDominy1
 
JLL Q4 2018 Multifamily Insight
JLL Q4 2018 Multifamily InsightJLL Q4 2018 Multifamily Insight
JLL Q4 2018 Multifamily InsightDavidDominy1
 
JLL Q4 Houston Industrial Insight
JLL Q4 Houston Industrial InsightJLL Q4 Houston Industrial Insight
JLL Q4 Houston Industrial InsightDavidDominy1
 
@JLL Q4 Houston Industrial Insight & Statistics
@JLL Q4 Houston Industrial Insight & Statistics@JLL Q4 Houston Industrial Insight & Statistics
@JLL Q4 Houston Industrial Insight & StatisticsDavidDominy1
 
National Employment Situation: January 2018
National Employment Situation: January 2018National Employment Situation: January 2018
National Employment Situation: January 2018DavidDominy1
 

More from DavidDominy1 (7)

JLL Q4 2018 Multifamily Overview
JLL Q4 2018 Multifamily OverviewJLL Q4 2018 Multifamily Overview
JLL Q4 2018 Multifamily Overview
 
JLL Q4 2018 Multifamily Overview
JLL Q4 2018 Multifamily OverviewJLL Q4 2018 Multifamily Overview
JLL Q4 2018 Multifamily Overview
 
2018 Multifamily Overview
2018 Multifamily Overview2018 Multifamily Overview
2018 Multifamily Overview
 
JLL Q4 2018 Multifamily Insight
JLL Q4 2018 Multifamily InsightJLL Q4 2018 Multifamily Insight
JLL Q4 2018 Multifamily Insight
 
JLL Q4 Houston Industrial Insight
JLL Q4 Houston Industrial InsightJLL Q4 Houston Industrial Insight
JLL Q4 Houston Industrial Insight
 
@JLL Q4 Houston Industrial Insight & Statistics
@JLL Q4 Houston Industrial Insight & Statistics@JLL Q4 Houston Industrial Insight & Statistics
@JLL Q4 Houston Industrial Insight & Statistics
 
National Employment Situation: January 2018
National Employment Situation: January 2018National Employment Situation: January 2018
National Employment Situation: January 2018
 

Recently uploaded

Call Girls In Mundka Industrial Metro@꧂8447779280 ↬Enjoy ꧂Escort Service in ...
Call Girls In Mundka Industrial Metro@꧂8447779280 ↬Enjoy ꧂Escort Service in  ...Call Girls In Mundka Industrial Metro@꧂8447779280 ↬Enjoy ꧂Escort Service in  ...
Call Girls In Mundka Industrial Metro@꧂8447779280 ↬Enjoy ꧂Escort Service in ...asmaqueen5
 
9990771857 Call Girls in Noida Sector 34 Noida (Call Girls) Delhi
9990771857 Call Girls in Noida Sector 34 Noida (Call Girls) Delhi9990771857 Call Girls in Noida Sector 34 Noida (Call Girls) Delhi
9990771857 Call Girls in Noida Sector 34 Noida (Call Girls) Delhidelhimodel235
 
SSPL The Strand Abodes Kharadi Pune Brochure.pdf
SSPL The Strand Abodes Kharadi Pune Brochure.pdfSSPL The Strand Abodes Kharadi Pune Brochure.pdf
SSPL The Strand Abodes Kharadi Pune Brochure.pdfabbu831446
 
Listing Turkey Sylvana Istanbul - Bahcesehir
Listing Turkey Sylvana Istanbul - BahcesehirListing Turkey Sylvana Istanbul - Bahcesehir
Listing Turkey Sylvana Istanbul - BahcesehirListing Turkey
 
Call Girls in Pitampura Delhi 💯Call Us 🔝8264348440🔝
Call Girls in Pitampura Delhi 💯Call Us 🔝8264348440🔝Call Girls in Pitampura Delhi 💯Call Us 🔝8264348440🔝
Call Girls in Pitampura Delhi 💯Call Us 🔝8264348440🔝soniya singh
 
Building Dreams: Newman Leech's Visionary Approach to Real Estate Investment
Building Dreams: Newman Leech's Visionary Approach to Real Estate InvestmentBuilding Dreams: Newman Leech's Visionary Approach to Real Estate Investment
Building Dreams: Newman Leech's Visionary Approach to Real Estate InvestmentNewman George Leech
 
Low Rate Call Girls In Madipur Slum Quarter +91)8447779280Low Rate 2 short 2...
Low Rate Call Girls In Madipur Slum Quarter  +91)8447779280Low Rate 2 short 2...Low Rate Call Girls In Madipur Slum Quarter  +91)8447779280Low Rate 2 short 2...
Low Rate Call Girls In Madipur Slum Quarter +91)8447779280Low Rate 2 short 2...asmaqueen5
 
9990771857 Call Girls in Noida Sector 10 Noida (Call Girls) Delhi
9990771857 Call Girls in Noida Sector 10 Noida (Call Girls) Delhi9990771857 Call Girls in Noida Sector 10 Noida (Call Girls) Delhi
9990771857 Call Girls in Noida Sector 10 Noida (Call Girls) Delhidelhimodel235
 
Model Call Girl in Shastri Nagar Delhi reach out to us at 🔝8264348440🔝
Model Call Girl in Shastri Nagar Delhi reach out to us at 🔝8264348440🔝Model Call Girl in Shastri Nagar Delhi reach out to us at 🔝8264348440🔝
Model Call Girl in Shastri Nagar Delhi reach out to us at 🔝8264348440🔝soniya singh
 
9711199012 Call {Girls Delhi} Very Low rate Vaishali DownLoad PDF
9711199012 Call {Girls Delhi} Very Low rate Vaishali DownLoad PDF9711199012 Call {Girls Delhi} Very Low rate Vaishali DownLoad PDF
9711199012 Call {Girls Delhi} Very Low rate Vaishali DownLoad PDFMs Riya
 
Cashpay_Call Girls In Gaur City Mall Noida ❤️8860477959 Escorts Service In 24...
Cashpay_Call Girls In Gaur City Mall Noida ❤️8860477959 Escorts Service In 24...Cashpay_Call Girls In Gaur City Mall Noida ❤️8860477959 Escorts Service In 24...
Cashpay_Call Girls In Gaur City Mall Noida ❤️8860477959 Escorts Service In 24...lizamodels9
 
Call Girls in shastri nagar Delhi 8264348440 ✅ call girls ❤️
Call Girls in shastri nagar Delhi 8264348440 ✅ call girls ❤️Call Girls in shastri nagar Delhi 8264348440 ✅ call girls ❤️
Call Girls in shastri nagar Delhi 8264348440 ✅ call girls ❤️soniya singh
 
Low Rate Call Girls in Tughlakabad Delhi Call 9990771857
Low Rate Call Girls in Tughlakabad Delhi Call 9990771857Low Rate Call Girls in Tughlakabad Delhi Call 9990771857
Low Rate Call Girls in Tughlakabad Delhi Call 9990771857delhimodel235
 
call girls in Shahdara (DELHI) 🔝 >༒9953330565🔝 genuine Escort Service 🔝✔️✔️
call girls in Shahdara (DELHI) 🔝 >༒9953330565🔝 genuine Escort Service 🔝✔️✔️call girls in Shahdara (DELHI) 🔝 >༒9953330565🔝 genuine Escort Service 🔝✔️✔️
call girls in Shahdara (DELHI) 🔝 >༒9953330565🔝 genuine Escort Service 🔝✔️✔️9953056974 Low Rate Call Girls In Saket, Delhi NCR
 
Call Girls In Vasundhara Ghaziabad ❤️8860477959 Low Rate Escorts Service In 2...
Call Girls In Vasundhara Ghaziabad ❤️8860477959 Low Rate Escorts Service In 2...Call Girls In Vasundhara Ghaziabad ❤️8860477959 Low Rate Escorts Service In 2...
Call Girls In Vasundhara Ghaziabad ❤️8860477959 Low Rate Escorts Service In 2...lizamodels9
 
Omaxe Dwarka In Delhi E Brochure Pdf
Omaxe Dwarka In Delhi E Brochure     PdfOmaxe Dwarka In Delhi E Brochure     Pdf
Omaxe Dwarka In Delhi E Brochure Pdfashiyadav24
 
Call Girls In Sahibabad Ghaziabad ❤️8860477959 Low Rate Escorts Service In 24...
Call Girls In Sahibabad Ghaziabad ❤️8860477959 Low Rate Escorts Service In 24...Call Girls In Sahibabad Ghaziabad ❤️8860477959 Low Rate Escorts Service In 24...
Call Girls In Sahibabad Ghaziabad ❤️8860477959 Low Rate Escorts Service In 24...lizamodels9
 
Eco-Efficient Living: Redefining Sustainability through Leech's Green Design ...
Eco-Efficient Living: Redefining Sustainability through Leech's Green Design ...Eco-Efficient Living: Redefining Sustainability through Leech's Green Design ...
Eco-Efficient Living: Redefining Sustainability through Leech's Green Design ...Newman George Leech
 

Recently uploaded (20)

Call Girls In Mundka Industrial Metro@꧂8447779280 ↬Enjoy ꧂Escort Service in ...
Call Girls In Mundka Industrial Metro@꧂8447779280 ↬Enjoy ꧂Escort Service in  ...Call Girls In Mundka Industrial Metro@꧂8447779280 ↬Enjoy ꧂Escort Service in  ...
Call Girls In Mundka Industrial Metro@꧂8447779280 ↬Enjoy ꧂Escort Service in ...
 
9990771857 Call Girls in Noida Sector 34 Noida (Call Girls) Delhi
9990771857 Call Girls in Noida Sector 34 Noida (Call Girls) Delhi9990771857 Call Girls in Noida Sector 34 Noida (Call Girls) Delhi
9990771857 Call Girls in Noida Sector 34 Noida (Call Girls) Delhi
 
SSPL The Strand Abodes Kharadi Pune Brochure.pdf
SSPL The Strand Abodes Kharadi Pune Brochure.pdfSSPL The Strand Abodes Kharadi Pune Brochure.pdf
SSPL The Strand Abodes Kharadi Pune Brochure.pdf
 
Listing Turkey Sylvana Istanbul - Bahcesehir
Listing Turkey Sylvana Istanbul - BahcesehirListing Turkey Sylvana Istanbul - Bahcesehir
Listing Turkey Sylvana Istanbul - Bahcesehir
 
Call Girls in Pitampura Delhi 💯Call Us 🔝8264348440🔝
Call Girls in Pitampura Delhi 💯Call Us 🔝8264348440🔝Call Girls in Pitampura Delhi 💯Call Us 🔝8264348440🔝
Call Girls in Pitampura Delhi 💯Call Us 🔝8264348440🔝
 
Building Dreams: Newman Leech's Visionary Approach to Real Estate Investment
Building Dreams: Newman Leech's Visionary Approach to Real Estate InvestmentBuilding Dreams: Newman Leech's Visionary Approach to Real Estate Investment
Building Dreams: Newman Leech's Visionary Approach to Real Estate Investment
 
Low Rate Call Girls In Madipur Slum Quarter +91)8447779280Low Rate 2 short 2...
Low Rate Call Girls In Madipur Slum Quarter  +91)8447779280Low Rate 2 short 2...Low Rate Call Girls In Madipur Slum Quarter  +91)8447779280Low Rate 2 short 2...
Low Rate Call Girls In Madipur Slum Quarter +91)8447779280Low Rate 2 short 2...
 
9990771857 Call Girls in Noida Sector 10 Noida (Call Girls) Delhi
9990771857 Call Girls in Noida Sector 10 Noida (Call Girls) Delhi9990771857 Call Girls in Noida Sector 10 Noida (Call Girls) Delhi
9990771857 Call Girls in Noida Sector 10 Noida (Call Girls) Delhi
 
Model Call Girl in Shastri Nagar Delhi reach out to us at 🔝8264348440🔝
Model Call Girl in Shastri Nagar Delhi reach out to us at 🔝8264348440🔝Model Call Girl in Shastri Nagar Delhi reach out to us at 🔝8264348440🔝
Model Call Girl in Shastri Nagar Delhi reach out to us at 🔝8264348440🔝
 
9711199012 Call {Girls Delhi} Very Low rate Vaishali DownLoad PDF
9711199012 Call {Girls Delhi} Very Low rate Vaishali DownLoad PDF9711199012 Call {Girls Delhi} Very Low rate Vaishali DownLoad PDF
9711199012 Call {Girls Delhi} Very Low rate Vaishali DownLoad PDF
 
Cashpay_Call Girls In Gaur City Mall Noida ❤️8860477959 Escorts Service In 24...
Cashpay_Call Girls In Gaur City Mall Noida ❤️8860477959 Escorts Service In 24...Cashpay_Call Girls In Gaur City Mall Noida ❤️8860477959 Escorts Service In 24...
Cashpay_Call Girls In Gaur City Mall Noida ❤️8860477959 Escorts Service In 24...
 
Low Rate Call Girls in Triveni Complex Delhi Call 9873940964
Low Rate Call Girls in Triveni Complex Delhi Call 9873940964Low Rate Call Girls in Triveni Complex Delhi Call 9873940964
Low Rate Call Girls in Triveni Complex Delhi Call 9873940964
 
Call Girls in shastri nagar Delhi 8264348440 ✅ call girls ❤️
Call Girls in shastri nagar Delhi 8264348440 ✅ call girls ❤️Call Girls in shastri nagar Delhi 8264348440 ✅ call girls ❤️
Call Girls in shastri nagar Delhi 8264348440 ✅ call girls ❤️
 
Call Girls in Mahavir Nagar whatsaap call US +919953056974
Call Girls in Mahavir Nagar  whatsaap call US  +919953056974Call Girls in Mahavir Nagar  whatsaap call US  +919953056974
Call Girls in Mahavir Nagar whatsaap call US +919953056974
 
Low Rate Call Girls in Tughlakabad Delhi Call 9990771857
Low Rate Call Girls in Tughlakabad Delhi Call 9990771857Low Rate Call Girls in Tughlakabad Delhi Call 9990771857
Low Rate Call Girls in Tughlakabad Delhi Call 9990771857
 
call girls in Shahdara (DELHI) 🔝 >༒9953330565🔝 genuine Escort Service 🔝✔️✔️
call girls in Shahdara (DELHI) 🔝 >༒9953330565🔝 genuine Escort Service 🔝✔️✔️call girls in Shahdara (DELHI) 🔝 >༒9953330565🔝 genuine Escort Service 🔝✔️✔️
call girls in Shahdara (DELHI) 🔝 >༒9953330565🔝 genuine Escort Service 🔝✔️✔️
 
Call Girls In Vasundhara Ghaziabad ❤️8860477959 Low Rate Escorts Service In 2...
Call Girls In Vasundhara Ghaziabad ❤️8860477959 Low Rate Escorts Service In 2...Call Girls In Vasundhara Ghaziabad ❤️8860477959 Low Rate Escorts Service In 2...
Call Girls In Vasundhara Ghaziabad ❤️8860477959 Low Rate Escorts Service In 2...
 
Omaxe Dwarka In Delhi E Brochure Pdf
Omaxe Dwarka In Delhi E Brochure     PdfOmaxe Dwarka In Delhi E Brochure     Pdf
Omaxe Dwarka In Delhi E Brochure Pdf
 
Call Girls In Sahibabad Ghaziabad ❤️8860477959 Low Rate Escorts Service In 24...
Call Girls In Sahibabad Ghaziabad ❤️8860477959 Low Rate Escorts Service In 24...Call Girls In Sahibabad Ghaziabad ❤️8860477959 Low Rate Escorts Service In 24...
Call Girls In Sahibabad Ghaziabad ❤️8860477959 Low Rate Escorts Service In 24...
 
Eco-Efficient Living: Redefining Sustainability through Leech's Green Design ...
Eco-Efficient Living: Redefining Sustainability through Leech's Green Design ...Eco-Efficient Living: Redefining Sustainability through Leech's Green Design ...
Eco-Efficient Living: Redefining Sustainability through Leech's Green Design ...
 

JLL Houston Office Market Report - Q4 2018

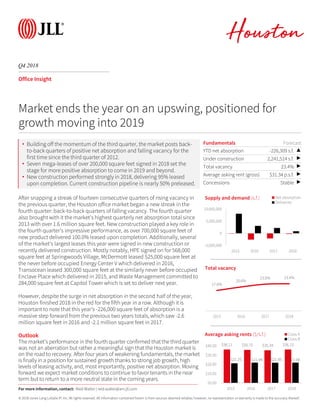
  • 1. © 2018 Jones Lang LaSalle IP, Inc. All rights reserved. All information contained herein is from sources deemed reliable; however, no representation or warranty is made to the accuracy thereof. Q4 2018 Houston Office Insight After snapping a streak of fourteen consecutive quarters of rising vacancy in the previous quarter, the Houston office market began a new streak in the fourth quarter: back-to-back quarters of falling vacancy. The fourth quarter also brought with it the market’s highest quarterly net absorption total since 2013 with over 1.6 million square feet. New construction played a key role in the fourth quarter’s impressive performance, as over 700,000 square feet of new product delivered 100.0% leased upon completion. Additionally, several of the market’s largest leases this year were signed in new construction or recently delivered construction. Mostly notably, HPE signed on for 568,000 square feet at Springwoods Village, McDermott leased 525,000 square feet at the never before occupied Energy Center V which delivered in 2016, Transocean leased 300,000 square feet at the similarly never before occupied Enclave Place which delivered in 2015, and Waste Management committed to 284,000 square feet at Capitol Tower which is set to deliver next year. However, despite the surge in net absorption in the second half of the year, Houston finished 2018 in the red for the fifth year in a row. Although it is important to note that this year’s -226,000 square feet of absorption is a massive step forward from the previous two years totals, which saw -2.6 million square feet in 2016 and -2.1 million square feet in 2017. Outlook The market’s performance in the fourth quarter confirmed that the third quarter was not an aberration but rather a meaningful sign that the Houston market is on the road to recovery. After four years of weakening fundamentals, the market is finally in a position for sustained growth thanks to strong job growth, high levels of leasing activity, and, most importantly, positive net absorption. Moving forward we expect market conditions to continue to favor tenants in the near term but to return to a more neutral state in the coming years. Fundamentals Forecast YTD net absorption -226,309 s.f. ▲ Under construction 2,241,514 s.f. ▶ Total vacancy 23.4% ▶ Average asking rent (gross) $31.34 p.s.f. ▶ Concessions Stable ▶ -5,000,000 0 5,000,000 10,000,000 2015 2016 2017 2018 Supply and demand (s.f.) Net absorption Deliveries Market ends the year on an upswing, positioned for growth moving into 2019 17.6% 20.6% 23.0% 23.4% 2015 2016 2017 2018 Total vacancy $36.11 $35.75 $35.34 $36.13 $21.25 $21.94 $21.85 $21.98 $0.00 $10.00 $20.00 $30.00 $40.00 2015 2016 2017 2018 Average asking rents ($/s.f.) Class A Class B For more information, contact: Reid Watler | reid.watler@am.jll.com • Building off the momentum of the third quarter, the market posts back- to-back quarters of positive net absorption and falling vacancy for the first time since the third quarter of 2012. • Seven mega-leases of over 200,000 square feet signed in 2018 set the stage for more positive absorption to come in 2019 and beyond. • New construction performed strongly in 2018, delivering 95% leased upon completion. Current construction pipeline is nearly 50% preleased.
  • 2. Houston Q4 2018 Office Statistics Class Inventory (s.f.) Quarterly total net absorption (s.f.) YTD total net absorption (s.f.) YTD total net absorption (% of stock) Direct vacancy (%) Total vacancy (%) Average direct asking rent ($ p.s.f.) YTD completions (s.f.) Under construction (s.f.) Houston Totals A 109,823,179 1,648,914 892,730 0.8% 20.5% 24.3% $36.13 881,826 2,241,514 B 58,237,745 38,157 -1,119,039 -1.9% 20.7% 21.7% $21.98 0 0 Totals 168,060,924 1,687,071 -226,309 -0.1% 20.6% 23.4% $31.34 881,826 2,241,514 CBD Totals 35,587,071 294,995 -354,982 -1.0% 18.9% 21.7% $42.52 0 1,887,174 CBD Totals 35,587,071 294,995 -354,982 -1.0% 18.9% 21.7% $42.52 0 1,887,174 Bellaire Totals 2,250,960 34,904 39,093 1.7% 8.1% 8.9% $28.10 0 0 Galleria Totals 22,726,946 210,021 398,814 1.8% 17.1% 19.4% $34.95 104,579 0 Greenspoint/North Belt Totals 8,948,427 46,094 217,532 2.4% 50.7% 51.7% $19.45 0 0 Greenway Plaza Totals 9,970,524 93,796 -31,152 -0.3% 16.1% 17.2% $33.89 0 0 Medical Center Totals 3,644,104 -288,333 -247,048 -6.8% 8.9% 8.9% $28.77 0 0 Midtown Totals 4,126,027 -2,003 47,827 1.2% 13.9% 14.3% $29.52 0 0 Northwest Totals 8,572,779 61,161 -428,430 -5.0% 28.7% 31.7% $23.59 0 0 San Felipe/Voss Totals 5,064,935 -102,329 -299,955 -5.9% 21.0% 22.7% $30.05 0 0 Southwest Totals 6,028,999 -70,405 -132,764 -2.2% 26.1% 27.1% $17.97 0 0 Suburban Near Totals 71,333,701 -17,094 -436,083 -0.6% 22.7% 24.3% $26.85 104,579 0 Katy Freeway East Totals 5,541,549 13,226 113,734 2.1% 12.8% 13.4% $35.31 0 0 Katy Freeway West Totals 19,859,295 225,027 33,454 0.2% 24.9% 32.6% $30.90 72,045 0 Westchase Totals 12,896,735 72,271 -480,007 -3.7% 21.4% 27.3% $29.10 0 0 Energy Corridor Totals 38,297,579 310,524 -332,819 -0.9% 21.9% 28.0% $30.58 72,045 0 FM 1960 Totals 5,891,668 161,928 -15,221 -0.3% 17.3% 19.0% $18.59 0 156,000 Gulf Freeway/Pasadena Totals 1,518,142 131,300 122,234 8.1% 9.4% 9.9% $21.04 0 0 NASA/Clear Lake Totals 3,206,107 62,913 -6,094 -0.2% 16.5% 16.6% $22.15 0 0 Sugar Land Totals 4,222,047 12,681 -82,589 -2.0% 8.7% 11.9% $28.03 0 0 The Woodlands Totals 8,004,609 729,824 879,245 11.0% 14.4% 15.1% $32.11 705,202 198,340 Suburban Outlying Totals 22,842,573 1,098,646 897,575 3.9% 14.1% 15.4% $24.06 705,202 354,340 Houston Totals 168,060,924 1,687,071 -226,309 -0.1% 20.6% 23.4% $31.34 881,826 2,241,514 CBD A 27,929,895 180,554 -325,247 -1.2% 18.6% 21.9% $44.27 0 1,887,174 CBD A 27,929,895 180,554 -325,247 -1.2% 18.6% 21.9% $44.27 0 1,887,174 Bellaire A 1,375,713 37,056 68,874 5.0% 8.7% 9.0% $28.99 0 0 Galleria A 17,779,271 215,113 656,291 3.7% 17.0% 19.3% $37.46 104,579 0 Greenspoint/North Belt A 4,676,389 68,800 94,461 2.0% 60.2% 61.4% $22.42 0 0 Greenway Plaza A 7,395,743 11,802 -66,458 -0.9% 17.6% 19.0% $36.26 0 0 Medical Center A 1,624,079 6,714 37,960 2.3% 11.2% 11.2% $31.97 0 0 Midtown A 2,006,668 8,816 79,729 4.0% 18.0% 18.1% $32.16 0 0 Northwest A 3,874,504 38,500 -409,168 -10.6% 38.5% 43.2% $25.65 0 0 San Felipe/Voss A 1,720,793 3,272 -119,895 -7.0% 27.8% 29.0% $36.15 0 0 Southwest A 1,580,642 25,469 27,075 1.7% 24.0% 24.0% $19.11 0 0 Suburban Near A 42,033,802 415,542 368,869 0.9% 24.1% 26.0% $30.47 104,579 0 Katy Freeway East A 4,105,103 23,345 103,171 2.5% 13.8% 14.1% $40.64 0 0 Katy Freeway West A 14,446,523 135,002 320,034 2.2% 22.9% 33.3% $35.20 72,045 0 Westchase A 8,788,607 -19,272 -326,193 -3.7% 22.2% 30.5% $34.61 0 0 Energy Corridor A 27,340,233 139,075 97,012 0.4% 21.3% 29.5% $35.39 72,045 0 FM 1960 A 2,347,252 121,246 32,115 1.4% 7.9% 11.0% $28.79 0 156,000 Gulf Freeway/Pasadena A 0 0 0 0.0% 0.0% 0.0% $0.00 0 0 NASA/Clear Lake A 1,342,961 13,740 -63,626 -4.7% 11.9% 12.1% $24.34 0 0 Sugar Land A 2,924,208 47,088 -57,735 -2.0% 6.4% 10.8% $31.85 0 0 The Woodlands A 5,904,828 731,669 841,342 14.2% 13.8% 14.5% $35.16 705,202 198,340 Suburban Outlying A 12,519,249 913,743 752,096 6.0% 10.7% 12.7% $31.72 705,202 354,340 Houston A 109,823,179 1,648,914 892,730 0.8% 20.5% 24.3% $36.13 881,826 2,241,514 Reid Watler | Manager, Research 1400 Post Oak Suite 1100 Houston, TX 77056 | reid.watler@am.jll.com 2019 Jones Lang LaSalle IP, Inc. All rights reserved.
  • 3. Houston | Office Statistics | Q4 2018 Class Inventory (s.f.) Total net absorption (s.f.) YTD total net absorption (s.f.) YTD total net absorption (% of stock) Direct vacancy (%) Total vacancy (%) Average direct asking rent ($ p.s.f.) YTD completions (s.f.) Under construction (s.f.) CBD B 7,657,176 114,441 -29,735 -0.4% 20.1% 21.0% $30.55 0 0 CBD B 7,657,176 114,441 -29,735 -0.4% 20.1% 21.0% $30.55 0 0 Bellaire B 875,247 -2,152 -29,781 -3.4% 7.2% 8.8% $26.80 0 0 Galleria B 4,947,675 -5,092 -257,477 -5.2% 17.8% 19.6% $27.44 0 0 Greenspoint/North Belt B 4,272,038 -22,706 123,071 2.9% 40.2% 41.0% $15.50 0 0 Greenway Plaza B 2,574,781 81,994 35,306 1.4% 11.8% 12.0% $27.22 0 0 Medical Center B 2,020,025 -295,047 -285,008 -14.1% 7.1% 7.1% $24.69 0 0 Midtown B 2,119,359 -10,819 -31,902 -1.5% 9.9% 10.7% $27.26 0 0 Northwest B 4,698,275 22,661 -19,262 -0.4% 20.5% 22.2% $20.44 0 0 San Felipe/Voss B 3,344,142 -105,601 -180,060 -5.4% 17.6% 19.5% $25.24 0 0 Southwest B 4,448,357 -95,874 -159,839 -3.6% 26.8% 28.2% $17.34 0 0 Suburban Near B 29,299,899 -432,636 -804,952 -2.7% 20.7% 21.9% $21.27 0 0 Katy Freeway East B 1,436,446 -10,119 10,563 0.7% 9.7% 11.7% $22.01 0 0 Katy Freeway West B 5,412,772 90,025 -286,580 -5.3% 30.1% 30.8% $21.96 0 0 Westchase B 4,108,128 91,543 -153,814 -3.7% 19.6% 20.5% $20.65 0 0 Energy Corridor B 10,957,346 171,449 -429,831 -3.9% 23.5% 24.4% $21.47 0 0 FM 1960 B 3,544,416 40,682 -47,336 -1.3% 23.5% 24.3% $16.69 0 0 Gulf Freeway/Pasadena B 1,518,142 131,300 122,234 8.1% 9.4% 9.9% $21.04 0 0 NASA/Clear Lake B 1,863,146 49,173 57,532 3.1% 19.9% 19.9% $21.31 0 0 Sugar Land B 1,297,839 -34,407 -24,854 -1.9% 13.8% 14.4% $23.08 0 0 The Woodlands B 2,099,781 -1,845 37,903 1.8% 16.2% 16.6% $26.33 0 0 Suburban Outlying B 10,323,324 184,903 145,479 1.4% 18.1% 18.6% $19.98 0 0 Houston B 58,237,745 38,157 -1,119,039 -1.9% 20.7% 21.7% $21.98 0 0 Reid Watler | Manager, Research 1400 Post Oak Suite 1100 Houston, TX 77056 | reid.watler@am.jll.com 2019 Jones Lang LaSalle IP, Inc. All rights reserved.
  • 4. Houston Q4 2018 Office leasing activity Leasing activity by size (s.f.) 2,631,894 31 6,491,718 106 2,461,798 170,096 123.2 Growing Shrinking Stable 83,630 0 2,469,393 78,871 0 0 Notable leasing transactions Size Footprint Term (mos) 524,399 Stable 132 284,331 Shrinking 180 284,000 Stable 181 284,000 Stable 181 97,708 Stable 176 87,231 Stable 120 83,518 Growing 360 83,336 Stable 130 68,958 Stable 18 68,706 Growing 116Encino Energy, LLC 5847 San Felipe St San Felipe/Voss Direct McGriff, Seibels & Williams 10100 Katy Fwy Katy Freeway East Direct City of Houston 1100 Louisiana St CBD Sublease Arena Energy 2103 Research Forest Dr The Woodlands PROS, Inc. Direct Houston Forensic Science 500 Jefferson St CBD Direct Direct 800 Capitol St CBDWaste Management Inc HPE HPE Direct E Mossy Oaks Rd The Woodlands Direct 3200 Kirby Dr Greenway Plaza Type 915 N Eldridge Pkwy Katy Freeway West DirectMcDermott International Tenant Address Submarket Direct E Mossy Oaks Rd The Woodlands At a glance Quarterly leasing activity (s.f.) Quarterly number of transactions YTD leasing activity (s.f.) Tenant footprint 6 1 24 YTD number of transactions Leasing activity by transaction type Leasing activity by submarketLeasing activity by industry Quarterly Class A leasing activity (s.f.) Expansion in market Expansion in building Renewal Extension (< 36-month term) Relocation within market New to market Average term (months) Quarterly Class B leasing activity (s.f.) 1,376,730 351,793 528,870 110,087 264,414 0 500,000 1,000,000 1,500,000 100,000+ 75,000-99,999 50,000-74,999 30,000-49,999 20,000-29,999 23% 17% 17% 10% 10% 7% 3% 3% 3% 3%3% CBD The Woodlands Katy Freeway West Midtown Galleria Katy Freeway East FM 1960 San Felipe/Voss Greenway Plaza Southwest Northwest 25% 20% 15% 10% 10% 5% 5% 5% 5% Energy and utilities Technology Engineering Government Real estate Law firm Insurance Business services Banking 0 1,000,000 2,000,000 3,000,000 Q3 2017 Q4 2017 Q1 2018 Q2 2018 Q3 2018 Q4 2018 Historical leasing activity Source: JLL Research | Note: This report analyzes all closed office leases >20,000 s.f. 2019 Jones Lang LaSalle IP, Inc. All rights reserved.
  • 5. Houston Q4 2018 Office development Total available at delivery (%) 4.2% Total leased at delivery (%) 95.8% Average floor plate (s.f.) 35,100 Average number of stories 11 Average asking rent ($ p.s.f.) $37.19 Notable deliveries year-to-date Building Submarket RBA (s.f.) Delivered Leased at delivery (%) 1701 City Plaza Dr 326,800 Q4 2018 100.0% 11300 Energy Dr 189,201 Q4 2018 100.0% 11400 Energy Dr 189,201 Q4 2018 100.0% 1600 W Loop S 104,579 Q1 2018 70.0% 2322 W Grand Parkway N 72,045 Q1 2018 92.6% Total pre-leased (%) 45.6% Total under construction (s.f.) 2,241,514 Total under renovation (s.f.) 0 Average floor plate (s.f.) 28,840 Average asking rent ($ p.s.f.) $48.24 Notable projects under construction Building RBA (s.f.) Estimated delivery Pre-leased (%) 801 Texas Ave 1,106,581 Q4 2021 33.2% 800 Capitol St 780,593 Q2 2019 81.0% 19350 State Highway 249 156,000 Q3 2019 0.0% 1700 City Plaza Dr 149,500 Q2 2019 0.0% 1401 Lake Plaza Dr 48,840 Q2 2019 45.2% BTSPatrinely BTS Landry's Spec/BTSOwner/developer Speculative BTSPatrinely Patrinely Historical completions Deliveries At a glance 881,826 YTD deliveries (s.f.) Speculative CBD Hines Speculative Owner/developer Spec or BTSSubmarket Under construction/renovation 2,241,514 Under construction/renovation (s.f.) At a glance Upcoming deliveries by year (s.f., excludes YTD completions) Speculative Speculative The Woodlands Patrinely Speculative The Woodlands SkanskaCBD FM 1960 Greenwood Properties Speculative The Urban Companies The Woodlands The Woodlands The Woodlands Patrinely Katy Freeway West Galleria 1,134,933 1,106,581 1,090,000 1,095,000 1,100,000 1,105,000 1,110,000 1,115,000 1,120,000 1,125,000 1,130,000 1,135,000 1,140,000 2019 2021 4,063,481 8,071,906 2,485,974 2,819,444 881,826 0 1,000,000 2,000,000 3,000,000 4,000,000 5,000,000 6,000,000 7,000,000 8,000,000 9,000,000 2014 2015 2016 2017 2018 Source: JLL Research | Note: This report analyzes all office developments under construction/renovation >30,000 s.f. 2019 Jones Lang LaSalle IP, Inc. All rights reserved.
  • 6. Houston Q4 2018 Office sales activity $1,706,709,138 40 $214 6.4% 5.3% 94.7% 5.5-6.5% 0 0 $0 7-8.5% 0.0% 40 $1,706,709,138 Notable sales transactions year-to-date RBA (s.f.) $ p.s.f. Sale date 511,225 $794 Jul-18 1,197,300 $147 Feb-18 554,385 $199 Sep-18 504,609 $200 Jan-18 313,420 $322 Aug-18 574,944 $127 Mar-18 806,541 $87 Feb-18 375,440 $181 Jun-18 248,707 $255 Aug-18 276,770 $197 Mar-18 The Aztec Fund Norvin Properties Davidson Kempner Capital Management, Lexington Realty M-M Properties, Baupost Group CBRE Global Investors Lexington Realty Trust Griffin Partners, Investcorp Transwestern $176,500,000 $110,433,467 $101,000,000 $101,000,000 Top 5 sellers (s.f.)Top 5 buyers (s.f.) Lonza Houston Zeller Realty Group Pinchal & Company $54,400,000 1001 McKinney TRC Capital Partners, Amstar Cameron Management, Silverpeak Real Estate Partners $68,000,000 Westgate I Nicola Crosby Real Estate Transwestern, Miller Global Properties, LLC $63,420,285 Loop Central I-III Griffin Partners, Wheelock Street Capital, LLC TIER REIT $72,980,000 Brookhollow Central I-III Hertz Investment Group Parmenter Realty Partners, Cohen & Steers $70,500,000 Pin Oak Park Portfolio Westway Plaza Marathon Oil Tower Western Geophysical Memorial Hermann Medical Plaza LaSalle Investment Management Mischer Investments $405,000,000 Building Buyer Seller Sale price ($) Number of transactions Average Class A cap rate Sales volume $ by submarket Urban sales volume as % of total Suburban sales volume as % of total Cap rate range Sales activity by building classAt a glance YTD sales volume Foreign capital Average partial interest acquired Number of foreign buyers Domestic capital Average Class A price p.s.f. Transactions details Number of partial interest transactions Core Class A CBD Core Class A suburban Number of domestic buyers 1,197,300 s.f. 806,541 s.f. 633,280 s.f. 574,944 s.f. 568,458 s.f. M-M Properties, Baupost Group Hertz Investment Group Davidson Kempner Capital Management, Lexington Realty Trust Griffin Partners, Wheelock Street Capital, LLC Lawrence Wong 1,197,300 s.f. 806,541 s.f. 633,280 s.f. 574,944 s.f. 568,458 s.f. CBRE Global Investors Parmenter Realty Partners, Cohen & Steers Lexington Realty Trust TIER REIT Halliburton $6,025,000 $7,800,000 $14,620,000 $17,800,000 $22,026,288 $23,030,954 $39,000,000 $52,212,896 $53,000,000 $54,400,000 $89,717,029 $91,865,000 $105,500,000 $170,933,467 $173,980,000 $176,500,000 $203,298,504 $405,000,000 Southwest Gulf… NASA/Clear Lake Greenway Plaza San Felipe/Voss Greenspoint/North… Sugar Land The Woodlands Katy Freeway East South CBD Northwest FM 1960 Westchase Bellaire Galleria Katy Freeway West Medical Center $1,180,041,400 $520,642,738 $6,025,000 $0 $200,000,000 $400,000,000 $600,000,000 $800,000,000 $1,000,000,000 $1,200,000,000 $1,400,000,000 A B C Source: JLL Research | Note: This report analyzes all year-to-date office sales > 50,000 s.f. 2019 Jones Lang LaSalle IP, Inc. All rights reserved.