SlideShare a Scribd company logo
1 of 2
Download to read offline
© 2019 Jones Lang LaSalle IP, Inc. All rights reserved. All information contained herein is from sources deemed reliable; however, no representation or warranty is made to the accuracy thereof.
Q3 2019
Grand Rapids
Office Insight
While rent growth has leveled off in the Grand Rapids office market, vacancies
compressed further in the third quarter. Average asking rents are $18.74 per
square foot across the market, up 1.6 percent year-over-year, while market-
wide vacancy currently sits at 8.5 percent, down 1.7 percent over the same
period. The high-profile Warner Building development delivered fully-leased
in August, adding 118,000 square feet to the downtown Class A inventory. The
previously-shelved office component of the Studio Park development
announced that insurance brokerage firm Acrisure has signed a long-term
lease to occupy the 105,000-square-foot building. The move will make them
the largest Class-A occupier in downtown Grand Rapids with plans to add up
to 175,000 square feet of additional space in the future.
In the suburbs, SpendMend signed a long-term lease for 31,000 square feet at
Cascade Office Park on Horizon Drive Southeast, and Michigan Office
Solutions renewed their 40,000-square-foot lease on the Northwest side of
town. LCN Capital Partners purchased the 714,000-square-foot Farmers
Insurance Complex in Caledonia for $147.3 million, or approximately $212 per
square foot from Farmers Insurance, who leased it back on a 15-year deal.
Outlook
Looking ahead toward the end of the year, we can expect the good conditions
in the Grand Rapids office market to remain stable. Keep an eye on 111 Lyon
Street, as Warner Norcross & Judd will make their move to Warner Tower in
November, leaving an approximate 90,000-square-foot vacancy at their old
location. The market should continue growing at a slow and steady pace, and
as more Class A space is delivered and added to the growing construction
pipeline, it will be interesting to watch the these development’s impact on
rents, specifically downtown.
Fundamentals Forecast
YTD net absorption 308,947 s.f. â–˛
Under construction 105,000 s.f. â–˛
Total vacancy 8.5% â–
Average asking rent (gross) $18.74 p.s.f. â–
Concessions Stable â–
-200,000
0
200,000
400,000
2016 2017 2018 YTD
Supply and demand (s.f.) Net absorption
Deliveries
Warner Building delivers while Studio Park finds tenant
14.8%
12.9%
10.0%
8.5%
2016 2017 2018 YTD
Total vacancy
$12.00
$17.00
$22.00
2016 2017 2018 YTD
Average asking rents ($/s.f.) Class A
Class B
For more information, contact: Harrison West | harrison.west@am.jll.com
• The Warner Building delivered downtown fully leased after two years of
construction, adding 118,000 square feet to the Class A inventory.
• Overall rent growth has flattened out with 1.6 percent gain year-over-
year, however the gap between Class A and B asking rents has widened.
• Acrisure made headlines with their announcement to occupy the
105,000-square-foot office component of the Studio Park development.
© 2019 Jones Lang LaSalle IP, Inc. All rights reserved. All information contained herein is from sources deemed reliable; however, no representation or warranty is made to the accuracy thereof.
Q3 2019
Office Statistics
Grand Rapids
For more information, contact: Harrison West | harrison.west@am.jll.com
Class
Inventory
(s.f.)
Total net
absorption
(s.f.)
YTD total net
absorption
(s.f.)
YTD total net
absorption (%
of stock)
Direct
vacancy (%)
Total
vacancy (%)
Average
direct asking
rent ($ p.s.f.)
YTD
Completions
(s.f.)
Under
Development
(s.f.)
Downtown Totals 5,314,919 142,685 206,298 3.9% 7.5% 7.7% $21.20 118,000 105,000
Northeast Totals 764,896 6,622 -11,998 -1.6% 6.7% 6.7% $16.80 0 0
Northwest Totals 411,996 0 20,474 5.0% 0.0% 0.0% NA 0 0
Southeast Totals 3,884,259 54,223 88,364 2.3% 9.8% 10.4% $16.76 23,448 0
Southwest Totals 461,442 -10,555 5,809 1.3% 10.7% 11.2% $15.75 0 0
Suburbs Totals 5,522,593 50,290 102,649 1.9% 8.7% 9.2% $16.67 23,448 0
West Michigan Totals 10,837,512 192,975 308,947 2.9% 8.1% 8.5% $18.74 141,448 105,000
Downtown A 1,944,250 137,010 149,259 7.7% 11.1% 11.2% $21.85 118,000 105,000
Northeast A 121,746 0 0 0.0% 0.0% 0.0% NA 0 0
Southeast A 574,983 2,726 5,264 0.9% 20.5% 22.5% $18.76 23,448 0
Southwest A 18,800 0 0 0.0% 0.0% 0.0% NA 0 0
Suburbs A 715,529 2,726 5,264 0.7% 16.5% 18.1% $18.76 23,448 0
West Michigan A 2,659,779 139,736 154,523 5.8% 12.6% 13.1% $20.75 141,448 105,000
Downtown B 3,370,669 5,675 57,039 1.7% 5.3% 5.7% $20.40 0 0
Northeast B 643,150 6,622 -11,998 -1.9% 7.9% 7.9% $16.80 0 0
Northwest B 411,996 0 20,474 5.0% 0.0% 0.0% NA 0 0
Southeast B 3,309,276 51,497 83,100 2.5% 7.9% 8.3% $15.84 0 0
Southwest B 442,642 -10,555 5,809 1.3% 11.2% 11.6% $15.75 0 0
Suburbs B 4,807,064 47,564 97,385 2.0% 7.5% 7.8% $15.95 0 0
West Michigan B 8,177,733 53,239 154,424 1.9% 6.6% 7.0% $17.45 0 0

More Related Content

What's hot

JLL Grand Rapids - Skyline 2019
JLL Grand Rapids - Skyline 2019JLL Grand Rapids - Skyline 2019
JLL Grand Rapids - Skyline 2019Harrison West
 
JLL Detroit Office Insight & Statistics - Q4 2017
JLL Detroit Office Insight & Statistics - Q4 2017JLL Detroit Office Insight & Statistics - Q4 2017
JLL Detroit Office Insight & Statistics - Q4 2017Harrison West
 
JLL Grand Rapids Office Insight & Statistics - Q1 2018
JLL Grand Rapids Office Insight & Statistics - Q1 2018JLL Grand Rapids Office Insight & Statistics - Q1 2018
JLL Grand Rapids Office Insight & Statistics - Q1 2018Harrison West
 
Christopher Newport University's 2019 CFA Challenge Presentation
Christopher Newport University's 2019 CFA Challenge PresentationChristopher Newport University's 2019 CFA Challenge Presentation
Christopher Newport University's 2019 CFA Challenge PresentationDavidBrynda
 
JLL Detroit Office Insight & Statistics - Q2 2019
JLL Detroit Office Insight & Statistics - Q2 2019JLL Detroit Office Insight & Statistics - Q2 2019
JLL Detroit Office Insight & Statistics - Q2 2019Harrison West
 
JLL Pittsburgh Office Insight & Statistics - Q4 2017
JLL Pittsburgh Office Insight & Statistics - Q4 2017JLL Pittsburgh Office Insight & Statistics - Q4 2017
JLL Pittsburgh Office Insight & Statistics - Q4 2017Tobiah Bilski
 
JLL Pittsburgh Office Insight & Statistics - Q1 2019
JLL Pittsburgh Office Insight & Statistics - Q1 2019JLL Pittsburgh Office Insight & Statistics - Q1 2019
JLL Pittsburgh Office Insight & Statistics - Q1 2019Tobiah Bilski
 
JLL Pittsburgh Office Insight & Statistics - Q3 2017
JLL Pittsburgh Office Insight & Statistics - Q3 2017JLL Pittsburgh Office Insight & Statistics - Q3 2017
JLL Pittsburgh Office Insight & Statistics - Q3 2017Tobiah Bilski
 
JLL Detroit Industrial Insight & Statistics - Q1 2019
JLL Detroit Industrial Insight & Statistics - Q1 2019JLL Detroit Industrial Insight & Statistics - Q1 2019
JLL Detroit Industrial Insight & Statistics - Q1 2019Harrison West
 
JLL Pittsburgh Office Insight & Statistics - Q1 2020
JLL Pittsburgh Office Insight & Statistics - Q1 2020JLL Pittsburgh Office Insight & Statistics - Q1 2020
JLL Pittsburgh Office Insight & Statistics - Q1 2020Tobiah Bilski
 
JLL Pittsburgh Industrial Insight & Statistics - Q2 2021
JLL Pittsburgh Industrial Insight & Statistics - Q2 2021JLL Pittsburgh Industrial Insight & Statistics - Q2 2021
JLL Pittsburgh Industrial Insight & Statistics - Q2 2021Tobiah Bilski
 
JLL Detroit Office Insight & Statistics - Q1 2019
JLL Detroit Office Insight & Statistics - Q1 2019JLL Detroit Office Insight & Statistics - Q1 2019
JLL Detroit Office Insight & Statistics - Q1 2019Harrison West
 
Section 1-6
Section 1-6Section 1-6
Section 1-6Jimbo Lamb
 
JLL - Tampa Bay 2018 Q1 Industrial Outlook
JLL - Tampa Bay 2018 Q1 Industrial OutlookJLL - Tampa Bay 2018 Q1 Industrial Outlook
JLL - Tampa Bay 2018 Q1 Industrial OutlookKyle Koller
 
JLL Houston Office Report Q4
JLL Houston Office Report Q4JLL Houston Office Report Q4
JLL Houston Office Report Q4Rebecca Moraitakis
 
JLL Houston Office Market Report - Q4 2018
JLL Houston Office Market Report - Q4 2018JLL Houston Office Market Report - Q4 2018
JLL Houston Office Market Report - Q4 2018DavidDominy1
 
JLL Pittsburgh Office Insight & Statistics - Q1 2018
JLL Pittsburgh Office Insight & Statistics - Q1 2018JLL Pittsburgh Office Insight & Statistics - Q1 2018
JLL Pittsburgh Office Insight & Statistics - Q1 2018Tobiah Bilski
 
JLL West Michigan Industrial Insight & Statistics - Q2 2018
JLL West Michigan Industrial Insight & Statistics - Q2 2018JLL West Michigan Industrial Insight & Statistics - Q2 2018
JLL West Michigan Industrial Insight & Statistics - Q2 2018Harrison West
 
JLL West Michigan Industrial Insight & Statistics - Q1 2020
JLL West Michigan Industrial Insight & Statistics - Q1 2020JLL West Michigan Industrial Insight & Statistics - Q1 2020
JLL West Michigan Industrial Insight & Statistics - Q1 2020Harrison West
 
JLL Detroit Office Insight & Statistics - Q3 2017
JLL Detroit Office Insight & Statistics - Q3 2017JLL Detroit Office Insight & Statistics - Q3 2017
JLL Detroit Office Insight & Statistics - Q3 2017Harrison West
 

What's hot (20)

JLL Grand Rapids - Skyline 2019
JLL Grand Rapids - Skyline 2019JLL Grand Rapids - Skyline 2019
JLL Grand Rapids - Skyline 2019
 
JLL Detroit Office Insight & Statistics - Q4 2017
JLL Detroit Office Insight & Statistics - Q4 2017JLL Detroit Office Insight & Statistics - Q4 2017
JLL Detroit Office Insight & Statistics - Q4 2017
 
JLL Grand Rapids Office Insight & Statistics - Q1 2018
JLL Grand Rapids Office Insight & Statistics - Q1 2018JLL Grand Rapids Office Insight & Statistics - Q1 2018
JLL Grand Rapids Office Insight & Statistics - Q1 2018
 
Christopher Newport University's 2019 CFA Challenge Presentation
Christopher Newport University's 2019 CFA Challenge PresentationChristopher Newport University's 2019 CFA Challenge Presentation
Christopher Newport University's 2019 CFA Challenge Presentation
 
JLL Detroit Office Insight & Statistics - Q2 2019
JLL Detroit Office Insight & Statistics - Q2 2019JLL Detroit Office Insight & Statistics - Q2 2019
JLL Detroit Office Insight & Statistics - Q2 2019
 
JLL Pittsburgh Office Insight & Statistics - Q4 2017
JLL Pittsburgh Office Insight & Statistics - Q4 2017JLL Pittsburgh Office Insight & Statistics - Q4 2017
JLL Pittsburgh Office Insight & Statistics - Q4 2017
 
JLL Pittsburgh Office Insight & Statistics - Q1 2019
JLL Pittsburgh Office Insight & Statistics - Q1 2019JLL Pittsburgh Office Insight & Statistics - Q1 2019
JLL Pittsburgh Office Insight & Statistics - Q1 2019
 
JLL Pittsburgh Office Insight & Statistics - Q3 2017
JLL Pittsburgh Office Insight & Statistics - Q3 2017JLL Pittsburgh Office Insight & Statistics - Q3 2017
JLL Pittsburgh Office Insight & Statistics - Q3 2017
 
JLL Detroit Industrial Insight & Statistics - Q1 2019
JLL Detroit Industrial Insight & Statistics - Q1 2019JLL Detroit Industrial Insight & Statistics - Q1 2019
JLL Detroit Industrial Insight & Statistics - Q1 2019
 
JLL Pittsburgh Office Insight & Statistics - Q1 2020
JLL Pittsburgh Office Insight & Statistics - Q1 2020JLL Pittsburgh Office Insight & Statistics - Q1 2020
JLL Pittsburgh Office Insight & Statistics - Q1 2020
 
JLL Pittsburgh Industrial Insight & Statistics - Q2 2021
JLL Pittsburgh Industrial Insight & Statistics - Q2 2021JLL Pittsburgh Industrial Insight & Statistics - Q2 2021
JLL Pittsburgh Industrial Insight & Statistics - Q2 2021
 
JLL Detroit Office Insight & Statistics - Q1 2019
JLL Detroit Office Insight & Statistics - Q1 2019JLL Detroit Office Insight & Statistics - Q1 2019
JLL Detroit Office Insight & Statistics - Q1 2019
 
Section 1-6
Section 1-6Section 1-6
Section 1-6
 
JLL - Tampa Bay 2018 Q1 Industrial Outlook
JLL - Tampa Bay 2018 Q1 Industrial OutlookJLL - Tampa Bay 2018 Q1 Industrial Outlook
JLL - Tampa Bay 2018 Q1 Industrial Outlook
 
JLL Houston Office Report Q4
JLL Houston Office Report Q4JLL Houston Office Report Q4
JLL Houston Office Report Q4
 
JLL Houston Office Market Report - Q4 2018
JLL Houston Office Market Report - Q4 2018JLL Houston Office Market Report - Q4 2018
JLL Houston Office Market Report - Q4 2018
 
JLL Pittsburgh Office Insight & Statistics - Q1 2018
JLL Pittsburgh Office Insight & Statistics - Q1 2018JLL Pittsburgh Office Insight & Statistics - Q1 2018
JLL Pittsburgh Office Insight & Statistics - Q1 2018
 
JLL West Michigan Industrial Insight & Statistics - Q2 2018
JLL West Michigan Industrial Insight & Statistics - Q2 2018JLL West Michigan Industrial Insight & Statistics - Q2 2018
JLL West Michigan Industrial Insight & Statistics - Q2 2018
 
JLL West Michigan Industrial Insight & Statistics - Q1 2020
JLL West Michigan Industrial Insight & Statistics - Q1 2020JLL West Michigan Industrial Insight & Statistics - Q1 2020
JLL West Michigan Industrial Insight & Statistics - Q1 2020
 
JLL Detroit Office Insight & Statistics - Q3 2017
JLL Detroit Office Insight & Statistics - Q3 2017JLL Detroit Office Insight & Statistics - Q3 2017
JLL Detroit Office Insight & Statistics - Q3 2017
 

Similar to JLL Grand Rapids Office Insight & Statistics - Q3 2019

JLL Grand Rapids Office Insight & Statistics - Q3 2018
JLL Grand Rapids Office Insight & Statistics - Q3 2018JLL Grand Rapids Office Insight & Statistics - Q3 2018
JLL Grand Rapids Office Insight & Statistics - Q3 2018Harrison West
 
JLL Grand Rapids Office Insight & Statistics - Q4 2019
JLL Grand Rapids Office Insight & Statistics - Q4 2019JLL Grand Rapids Office Insight & Statistics - Q4 2019
JLL Grand Rapids Office Insight & Statistics - Q4 2019Harrison West
 
JLL Grand Rapids Office Insight & Statistics - Q4 2018
JLL Grand Rapids Office Insight & Statistics - Q4 2018JLL Grand Rapids Office Insight & Statistics - Q4 2018
JLL Grand Rapids Office Insight & Statistics - Q4 2018Harrison West
 
JLL Grand Rapids Office Insight & Statistics - Q2 2018
JLL Grand Rapids Office Insight & Statistics - Q2 2018JLL Grand Rapids Office Insight & Statistics - Q2 2018
JLL Grand Rapids Office Insight & Statistics - Q2 2018Harrison West
 
JLL Cleveland Office Outlook: Q1 2017
JLL Cleveland Office Outlook: Q1 2017JLL Cleveland Office Outlook: Q1 2017
JLL Cleveland Office Outlook: Q1 2017Andrew Batson
 
JLL Detroit Industrial Insight & Statistics - Q4 2017
JLL Detroit Industrial Insight & Statistics - Q4 2017JLL Detroit Industrial Insight & Statistics - Q4 2017
JLL Detroit Industrial Insight & Statistics - Q4 2017Harrison West
 
JLL Detroit Office Insight & Statistics - Q4 2018
JLL Detroit Office Insight & Statistics - Q4 2018JLL Detroit Office Insight & Statistics - Q4 2018
JLL Detroit Office Insight & Statistics - Q4 2018Harrison West
 
JLL West Michigan Industrial Insight & Statistics - Q1 2018
JLL West Michigan Industrial Insight & Statistics - Q1 2018JLL West Michigan Industrial Insight & Statistics - Q1 2018
JLL West Michigan Industrial Insight & Statistics - Q1 2018Harrison West
 
JLL Cleveland Office Outlook: Q4 2017
JLL Cleveland Office Outlook: Q4 2017JLL Cleveland Office Outlook: Q4 2017
JLL Cleveland Office Outlook: Q4 2017Andrew Batson
 
JLL West Michigan Industrial Insight & Statistics - Q4 2019
JLL West Michigan Industrial Insight & Statistics - Q4 2019JLL West Michigan Industrial Insight & Statistics - Q4 2019
JLL West Michigan Industrial Insight & Statistics - Q4 2019Harrison West
 
Q4 2014 san_francisco_office
Q4 2014 san_francisco_officeQ4 2014 san_francisco_office
Q4 2014 san_francisco_officeCoy Davidson
 
Q4 2014 San Francisco Office Report
Q4 2014 San Francisco Office ReportQ4 2014 San Francisco Office Report
Q4 2014 San Francisco Office ReportCoy Davidson
 
JLL West Michigan Industrial Insight & Statistics - Q3 2019
JLL West Michigan Industrial Insight & Statistics - Q3 2019JLL West Michigan Industrial Insight & Statistics - Q3 2019
JLL West Michigan Industrial Insight & Statistics - Q3 2019Harrison West
 
JLL Detroit Industrial Insight & Statistics - Q2 2017
JLL Detroit Industrial Insight & Statistics - Q2 2017JLL Detroit Industrial Insight & Statistics - Q2 2017
JLL Detroit Industrial Insight & Statistics - Q2 2017Harrison West
 
JLL West Michigan Industrial Insight & Statistics - Q1 2019
JLL West Michigan Industrial Insight & Statistics - Q1 2019JLL West Michigan Industrial Insight & Statistics - Q1 2019
JLL West Michigan Industrial Insight & Statistics - Q1 2019Harrison West
 
JLL West Michigan Industrial Insight & Statistics - Q4 2018
JLL West Michigan Industrial Insight & Statistics - Q4 2018JLL West Michigan Industrial Insight & Statistics - Q4 2018
JLL West Michigan Industrial Insight & Statistics - Q4 2018Harrison West
 
JLL Cincinnati Office Insight & Statistics - Q3 2016
JLL Cincinnati Office Insight & Statistics - Q3 2016JLL Cincinnati Office Insight & Statistics - Q3 2016
JLL Cincinnati Office Insight & Statistics - Q3 2016Ross Bratcher
 
JLL Detroit Office Insight & Statistics - Q3 2018
JLL Detroit Office Insight & Statistics - Q3 2018JLL Detroit Office Insight & Statistics - Q3 2018
JLL Detroit Office Insight & Statistics - Q3 2018Harrison West
 
JLL Cleveland Industrial Outlook: Q4 2018
JLL Cleveland Industrial Outlook: Q4 2018JLL Cleveland Industrial Outlook: Q4 2018
JLL Cleveland Industrial Outlook: Q4 2018Andrew Batson
 

Similar to JLL Grand Rapids Office Insight & Statistics - Q3 2019 (20)

JLL Grand Rapids Office Insight & Statistics - Q3 2018
JLL Grand Rapids Office Insight & Statistics - Q3 2018JLL Grand Rapids Office Insight & Statistics - Q3 2018
JLL Grand Rapids Office Insight & Statistics - Q3 2018
 
JLL Grand Rapids Office Insight & Statistics - Q4 2019
JLL Grand Rapids Office Insight & Statistics - Q4 2019JLL Grand Rapids Office Insight & Statistics - Q4 2019
JLL Grand Rapids Office Insight & Statistics - Q4 2019
 
JLL Grand Rapids Office Insight & Statistics - Q4 2018
JLL Grand Rapids Office Insight & Statistics - Q4 2018JLL Grand Rapids Office Insight & Statistics - Q4 2018
JLL Grand Rapids Office Insight & Statistics - Q4 2018
 
JLL Grand Rapids Office Insight & Statistics - Q2 2018
JLL Grand Rapids Office Insight & Statistics - Q2 2018JLL Grand Rapids Office Insight & Statistics - Q2 2018
JLL Grand Rapids Office Insight & Statistics - Q2 2018
 
JLL Cleveland Office Outlook: Q1 2017
JLL Cleveland Office Outlook: Q1 2017JLL Cleveland Office Outlook: Q1 2017
JLL Cleveland Office Outlook: Q1 2017
 
Houston industrial report suite q1 2018
Houston industrial report suite q1 2018Houston industrial report suite q1 2018
Houston industrial report suite q1 2018
 
JLL Detroit Industrial Insight & Statistics - Q4 2017
JLL Detroit Industrial Insight & Statistics - Q4 2017JLL Detroit Industrial Insight & Statistics - Q4 2017
JLL Detroit Industrial Insight & Statistics - Q4 2017
 
JLL Detroit Office Insight & Statistics - Q4 2018
JLL Detroit Office Insight & Statistics - Q4 2018JLL Detroit Office Insight & Statistics - Q4 2018
JLL Detroit Office Insight & Statistics - Q4 2018
 
JLL West Michigan Industrial Insight & Statistics - Q1 2018
JLL West Michigan Industrial Insight & Statistics - Q1 2018JLL West Michigan Industrial Insight & Statistics - Q1 2018
JLL West Michigan Industrial Insight & Statistics - Q1 2018
 
JLL Cleveland Office Outlook: Q4 2017
JLL Cleveland Office Outlook: Q4 2017JLL Cleveland Office Outlook: Q4 2017
JLL Cleveland Office Outlook: Q4 2017
 
JLL West Michigan Industrial Insight & Statistics - Q4 2019
JLL West Michigan Industrial Insight & Statistics - Q4 2019JLL West Michigan Industrial Insight & Statistics - Q4 2019
JLL West Michigan Industrial Insight & Statistics - Q4 2019
 
Q4 2014 san_francisco_office
Q4 2014 san_francisco_officeQ4 2014 san_francisco_office
Q4 2014 san_francisco_office
 
Q4 2014 San Francisco Office Report
Q4 2014 San Francisco Office ReportQ4 2014 San Francisco Office Report
Q4 2014 San Francisco Office Report
 
JLL West Michigan Industrial Insight & Statistics - Q3 2019
JLL West Michigan Industrial Insight & Statistics - Q3 2019JLL West Michigan Industrial Insight & Statistics - Q3 2019
JLL West Michigan Industrial Insight & Statistics - Q3 2019
 
JLL Detroit Industrial Insight & Statistics - Q2 2017
JLL Detroit Industrial Insight & Statistics - Q2 2017JLL Detroit Industrial Insight & Statistics - Q2 2017
JLL Detroit Industrial Insight & Statistics - Q2 2017
 
JLL West Michigan Industrial Insight & Statistics - Q1 2019
JLL West Michigan Industrial Insight & Statistics - Q1 2019JLL West Michigan Industrial Insight & Statistics - Q1 2019
JLL West Michigan Industrial Insight & Statistics - Q1 2019
 
JLL West Michigan Industrial Insight & Statistics - Q4 2018
JLL West Michigan Industrial Insight & Statistics - Q4 2018JLL West Michigan Industrial Insight & Statistics - Q4 2018
JLL West Michigan Industrial Insight & Statistics - Q4 2018
 
JLL Cincinnati Office Insight & Statistics - Q3 2016
JLL Cincinnati Office Insight & Statistics - Q3 2016JLL Cincinnati Office Insight & Statistics - Q3 2016
JLL Cincinnati Office Insight & Statistics - Q3 2016
 
JLL Detroit Office Insight & Statistics - Q3 2018
JLL Detroit Office Insight & Statistics - Q3 2018JLL Detroit Office Insight & Statistics - Q3 2018
JLL Detroit Office Insight & Statistics - Q3 2018
 
JLL Cleveland Industrial Outlook: Q4 2018
JLL Cleveland Industrial Outlook: Q4 2018JLL Cleveland Industrial Outlook: Q4 2018
JLL Cleveland Industrial Outlook: Q4 2018
 

Recently uploaded

Shapoorji Pallonji Parkwest Sequoia Tower Bangalore.pdf
Shapoorji Pallonji Parkwest Sequoia Tower Bangalore.pdfShapoorji Pallonji Parkwest Sequoia Tower Bangalore.pdf
Shapoorji Pallonji Parkwest Sequoia Tower Bangalore.pdfashiyadav24
 
Namrata 7 Plumeria Drive Pimpri Chinchwad Pune Brochure.pdf
Namrata 7 Plumeria Drive Pimpri Chinchwad Pune Brochure.pdfNamrata 7 Plumeria Drive Pimpri Chinchwad Pune Brochure.pdf
Namrata 7 Plumeria Drive Pimpri Chinchwad Pune Brochure.pdfPrachiRudram
 
9990771857 Call Girls in Noida Sector 34 Noida (Call Girls) Delhi
9990771857 Call Girls in Noida Sector 34 Noida (Call Girls) Delhi9990771857 Call Girls in Noida Sector 34 Noida (Call Girls) Delhi
9990771857 Call Girls in Noida Sector 34 Noida (Call Girls) Delhidelhimodel235
 
Rustomjee The Panorama At Pali Hill, Bandra West, Mumbai - Brochure.pdf
Rustomjee The Panorama At Pali Hill, Bandra West, Mumbai - Brochure.pdfRustomjee The Panorama At Pali Hill, Bandra West, Mumbai - Brochure.pdf
Rustomjee The Panorama At Pali Hill, Bandra West, Mumbai - Brochure.pdfmonikasharma630
 
SVN Live 4.22.24 Weekly Property Broadcast
SVN Live 4.22.24 Weekly Property BroadcastSVN Live 4.22.24 Weekly Property Broadcast
SVN Live 4.22.24 Weekly Property BroadcastSVN International Corp.
 
Sobha Aranya Sector 80 Gurgaon E- Brochure.pdf
Sobha Aranya Sector 80 Gurgaon E- Brochure.pdfSobha Aranya Sector 80 Gurgaon E- Brochure.pdf
Sobha Aranya Sector 80 Gurgaon E- Brochure.pdffaheemali990101
 
Call Girls in Model Town Delhi 💯Call Us 🔝8264348440🔝
Call Girls in Model Town Delhi 💯Call Us 🔝8264348440🔝Call Girls in Model Town Delhi 💯Call Us 🔝8264348440🔝
Call Girls in Model Town Delhi 💯Call Us 🔝8264348440🔝soniya singh
 
Puravankara Mundhwa Pune E-Brochure.pdf
Puravankara Mundhwa Pune  E-Brochure.pdfPuravankara Mundhwa Pune  E-Brochure.pdf
Puravankara Mundhwa Pune E-Brochure.pdfManishSaxena95
 
9990771857 Call Girls in Noida Sector 10 Noida (Call Girls) Delhi
9990771857 Call Girls in Noida Sector 10 Noida (Call Girls) Delhi9990771857 Call Girls in Noida Sector 10 Noida (Call Girls) Delhi
9990771857 Call Girls in Noida Sector 10 Noida (Call Girls) Delhidelhimodel235
 
)_Call Girls In Radisson Blu Plaza Hotel, Delhi Airport ❤️8860477959 _Indepen...
)_Call Girls In Radisson Blu Plaza Hotel, Delhi Airport ❤️8860477959 _Indepen...)_Call Girls In Radisson Blu Plaza Hotel, Delhi Airport ❤️8860477959 _Indepen...
)_Call Girls In Radisson Blu Plaza Hotel, Delhi Airport ❤️8860477959 _Indepen...lizamodels9
 
Omaxe Dwarka In Delhi E Brochure Pdf
Omaxe Dwarka In Delhi E Brochure     PdfOmaxe Dwarka In Delhi E Brochure     Pdf
Omaxe Dwarka In Delhi E Brochure Pdfashiyadav24
 
How to Build Multifamily and Laneway Suites in Toronto!! (feat. Expert Archi...
How to Build Multifamily and Laneway Suites  in Toronto!! (feat. Expert Archi...How to Build Multifamily and Laneway Suites  in Toronto!! (feat. Expert Archi...
How to Build Multifamily and Laneway Suites in Toronto!! (feat. Expert Archi...Volition Properties
 
9990771857 Call Girls in Noida Sector 06 Noida (Call Girls) Delhi
9990771857 Call Girls in Noida Sector 06 Noida (Call Girls) Delhi9990771857 Call Girls in Noida Sector 06 Noida (Call Girls) Delhi
9990771857 Call Girls in Noida Sector 06 Noida (Call Girls) Delhidelhimodel235
 
9990771857 Call Girls in Noida Sector 1 Noida (Call Girls) Delhi
9990771857 Call Girls in Noida Sector 1 Noida (Call Girls) Delhi9990771857 Call Girls in Noida Sector 1 Noida (Call Girls) Delhi
9990771857 Call Girls in Noida Sector 1 Noida (Call Girls) Delhidelhimodel235
 
Call Girls In Vasundhara Ghaziabad ❤️8860477959 Low Rate Escorts Service In 2...
Call Girls In Vasundhara Ghaziabad ❤️8860477959 Low Rate Escorts Service In 2...Call Girls In Vasundhara Ghaziabad ❤️8860477959 Low Rate Escorts Service In 2...
Call Girls In Vasundhara Ghaziabad ❤️8860477959 Low Rate Escorts Service In 2...lizamodels9
 
Call Girls in Nehru Place Delhi 💯Call Us 🔝8264348440🔝
Call Girls in Nehru Place Delhi 💯Call Us 🔝8264348440🔝Call Girls in Nehru Place Delhi 💯Call Us 🔝8264348440🔝
Call Girls in Nehru Place Delhi 💯Call Us 🔝8264348440🔝soniya singh
 
Low Rate Call Girls in Triveni Complex Delhi Call 9990771857
Low Rate Call Girls in Triveni Complex Delhi Call 9990771857Low Rate Call Girls in Triveni Complex Delhi Call 9990771857
Low Rate Call Girls in Triveni Complex Delhi Call 9990771857delhimodel235
 

Recently uploaded (20)

Shapoorji Pallonji Parkwest Sequoia Tower Bangalore.pdf
Shapoorji Pallonji Parkwest Sequoia Tower Bangalore.pdfShapoorji Pallonji Parkwest Sequoia Tower Bangalore.pdf
Shapoorji Pallonji Parkwest Sequoia Tower Bangalore.pdf
 
Call Girls in Mahavir Nagar whatsaap call US +919953056974
Call Girls in Mahavir Nagar  whatsaap call US  +919953056974Call Girls in Mahavir Nagar  whatsaap call US  +919953056974
Call Girls in Mahavir Nagar whatsaap call US +919953056974
 
Namrata 7 Plumeria Drive Pimpri Chinchwad Pune Brochure.pdf
Namrata 7 Plumeria Drive Pimpri Chinchwad Pune Brochure.pdfNamrata 7 Plumeria Drive Pimpri Chinchwad Pune Brochure.pdf
Namrata 7 Plumeria Drive Pimpri Chinchwad Pune Brochure.pdf
 
9990771857 Call Girls in Noida Sector 34 Noida (Call Girls) Delhi
9990771857 Call Girls in Noida Sector 34 Noida (Call Girls) Delhi9990771857 Call Girls in Noida Sector 34 Noida (Call Girls) Delhi
9990771857 Call Girls in Noida Sector 34 Noida (Call Girls) Delhi
 
Hot call girls in Moti Bagh🔝 9953056974 🔝 escort Service
Hot call girls in Moti Bagh🔝 9953056974 🔝 escort ServiceHot call girls in Moti Bagh🔝 9953056974 🔝 escort Service
Hot call girls in Moti Bagh🔝 9953056974 🔝 escort Service
 
Rustomjee The Panorama At Pali Hill, Bandra West, Mumbai - Brochure.pdf
Rustomjee The Panorama At Pali Hill, Bandra West, Mumbai - Brochure.pdfRustomjee The Panorama At Pali Hill, Bandra West, Mumbai - Brochure.pdf
Rustomjee The Panorama At Pali Hill, Bandra West, Mumbai - Brochure.pdf
 
SVN Live 4.22.24 Weekly Property Broadcast
SVN Live 4.22.24 Weekly Property BroadcastSVN Live 4.22.24 Weekly Property Broadcast
SVN Live 4.22.24 Weekly Property Broadcast
 
Sobha Aranya Sector 80 Gurgaon E- Brochure.pdf
Sobha Aranya Sector 80 Gurgaon E- Brochure.pdfSobha Aranya Sector 80 Gurgaon E- Brochure.pdf
Sobha Aranya Sector 80 Gurgaon E- Brochure.pdf
 
Call Girls in Model Town Delhi 💯Call Us 🔝8264348440🔝
Call Girls in Model Town Delhi 💯Call Us 🔝8264348440🔝Call Girls in Model Town Delhi 💯Call Us 🔝8264348440🔝
Call Girls in Model Town Delhi 💯Call Us 🔝8264348440🔝
 
Puravankara Mundhwa Pune E-Brochure.pdf
Puravankara Mundhwa Pune  E-Brochure.pdfPuravankara Mundhwa Pune  E-Brochure.pdf
Puravankara Mundhwa Pune E-Brochure.pdf
 
9990771857 Call Girls in Noida Sector 10 Noida (Call Girls) Delhi
9990771857 Call Girls in Noida Sector 10 Noida (Call Girls) Delhi9990771857 Call Girls in Noida Sector 10 Noida (Call Girls) Delhi
9990771857 Call Girls in Noida Sector 10 Noida (Call Girls) Delhi
 
)_Call Girls In Radisson Blu Plaza Hotel, Delhi Airport ❤️8860477959 _Indepen...
)_Call Girls In Radisson Blu Plaza Hotel, Delhi Airport ❤️8860477959 _Indepen...)_Call Girls In Radisson Blu Plaza Hotel, Delhi Airport ❤️8860477959 _Indepen...
)_Call Girls In Radisson Blu Plaza Hotel, Delhi Airport ❤️8860477959 _Indepen...
 
Omaxe Dwarka In Delhi E Brochure Pdf
Omaxe Dwarka In Delhi E Brochure     PdfOmaxe Dwarka In Delhi E Brochure     Pdf
Omaxe Dwarka In Delhi E Brochure Pdf
 
How to Build Multifamily and Laneway Suites in Toronto!! (feat. Expert Archi...
How to Build Multifamily and Laneway Suites  in Toronto!! (feat. Expert Archi...How to Build Multifamily and Laneway Suites  in Toronto!! (feat. Expert Archi...
How to Build Multifamily and Laneway Suites in Toronto!! (feat. Expert Archi...
 
9990771857 Call Girls in Noida Sector 06 Noida (Call Girls) Delhi
9990771857 Call Girls in Noida Sector 06 Noida (Call Girls) Delhi9990771857 Call Girls in Noida Sector 06 Noida (Call Girls) Delhi
9990771857 Call Girls in Noida Sector 06 Noida (Call Girls) Delhi
 
9990771857 Call Girls in Noida Sector 1 Noida (Call Girls) Delhi
9990771857 Call Girls in Noida Sector 1 Noida (Call Girls) Delhi9990771857 Call Girls in Noida Sector 1 Noida (Call Girls) Delhi
9990771857 Call Girls in Noida Sector 1 Noida (Call Girls) Delhi
 
Call Girls In Vasundhara Ghaziabad ❤️8860477959 Low Rate Escorts Service In 2...
Call Girls In Vasundhara Ghaziabad ❤️8860477959 Low Rate Escorts Service In 2...Call Girls In Vasundhara Ghaziabad ❤️8860477959 Low Rate Escorts Service In 2...
Call Girls In Vasundhara Ghaziabad ❤️8860477959 Low Rate Escorts Service In 2...
 
Call Girls in Nehru Place Delhi 💯Call Us 🔝8264348440🔝
Call Girls in Nehru Place Delhi 💯Call Us 🔝8264348440🔝Call Girls in Nehru Place Delhi 💯Call Us 🔝8264348440🔝
Call Girls in Nehru Place Delhi 💯Call Us 🔝8264348440🔝
 
Low Rate Call Girls in Triveni Complex Delhi Call 9873940964
Low Rate Call Girls in Triveni Complex Delhi Call 9873940964Low Rate Call Girls in Triveni Complex Delhi Call 9873940964
Low Rate Call Girls in Triveni Complex Delhi Call 9873940964
 
Low Rate Call Girls in Triveni Complex Delhi Call 9990771857
Low Rate Call Girls in Triveni Complex Delhi Call 9990771857Low Rate Call Girls in Triveni Complex Delhi Call 9990771857
Low Rate Call Girls in Triveni Complex Delhi Call 9990771857
 

JLL Grand Rapids Office Insight & Statistics - Q3 2019

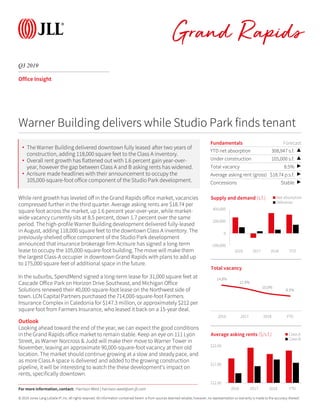
  • 1. © 2019 Jones Lang LaSalle IP, Inc. All rights reserved. All information contained herein is from sources deemed reliable; however, no representation or warranty is made to the accuracy thereof. Q3 2019 Grand Rapids Office Insight While rent growth has leveled off in the Grand Rapids office market, vacancies compressed further in the third quarter. Average asking rents are $18.74 per square foot across the market, up 1.6 percent year-over-year, while market- wide vacancy currently sits at 8.5 percent, down 1.7 percent over the same period. The high-profile Warner Building development delivered fully-leased in August, adding 118,000 square feet to the downtown Class A inventory. The previously-shelved office component of the Studio Park development announced that insurance brokerage firm Acrisure has signed a long-term lease to occupy the 105,000-square-foot building. The move will make them the largest Class-A occupier in downtown Grand Rapids with plans to add up to 175,000 square feet of additional space in the future. In the suburbs, SpendMend signed a long-term lease for 31,000 square feet at Cascade Office Park on Horizon Drive Southeast, and Michigan Office Solutions renewed their 40,000-square-foot lease on the Northwest side of town. LCN Capital Partners purchased the 714,000-square-foot Farmers Insurance Complex in Caledonia for $147.3 million, or approximately $212 per square foot from Farmers Insurance, who leased it back on a 15-year deal. Outlook Looking ahead toward the end of the year, we can expect the good conditions in the Grand Rapids office market to remain stable. Keep an eye on 111 Lyon Street, as Warner Norcross & Judd will make their move to Warner Tower in November, leaving an approximate 90,000-square-foot vacancy at their old location. The market should continue growing at a slow and steady pace, and as more Class A space is delivered and added to the growing construction pipeline, it will be interesting to watch the these development’s impact on rents, specifically downtown. Fundamentals Forecast YTD net absorption 308,947 s.f. â–˛ Under construction 105,000 s.f. â–˛ Total vacancy 8.5% â–¶ Average asking rent (gross) $18.74 p.s.f. â–¶ Concessions Stable â–¶ -200,000 0 200,000 400,000 2016 2017 2018 YTD Supply and demand (s.f.) Net absorption Deliveries Warner Building delivers while Studio Park finds tenant 14.8% 12.9% 10.0% 8.5% 2016 2017 2018 YTD Total vacancy $12.00 $17.00 $22.00 2016 2017 2018 YTD Average asking rents ($/s.f.) Class A Class B For more information, contact: Harrison West | harrison.west@am.jll.com • The Warner Building delivered downtown fully leased after two years of construction, adding 118,000 square feet to the Class A inventory. • Overall rent growth has flattened out with 1.6 percent gain year-over- year, however the gap between Class A and B asking rents has widened. • Acrisure made headlines with their announcement to occupy the 105,000-square-foot office component of the Studio Park development.
  • 2. © 2019 Jones Lang LaSalle IP, Inc. All rights reserved. All information contained herein is from sources deemed reliable; however, no representation or warranty is made to the accuracy thereof. Q3 2019 Office Statistics Grand Rapids For more information, contact: Harrison West | harrison.west@am.jll.com Class Inventory (s.f.) Total net absorption (s.f.) YTD total net absorption (s.f.) YTD total net absorption (% of stock) Direct vacancy (%) Total vacancy (%) Average direct asking rent ($ p.s.f.) YTD Completions (s.f.) Under Development (s.f.) Downtown Totals 5,314,919 142,685 206,298 3.9% 7.5% 7.7% $21.20 118,000 105,000 Downtown Totals 5,314,919 142,685 206,298 3.9% 7.5% 7.7% $21.20 118,000 105,000 Northeast Totals 764,896 6,622 -11,998 -1.6% 6.7% 6.7% $16.80 0 0 Northwest Totals 411,996 0 20,474 5.0% 0.0% 0.0% NA 0 0 Southeast Totals 3,884,259 54,223 88,364 2.3% 9.8% 10.4% $16.76 23,448 0 Southwest Totals 461,442 -10,555 5,809 1.3% 10.7% 11.2% $15.75 0 0 Suburbs Totals 5,522,593 50,290 102,649 1.9% 8.7% 9.2% $16.67 23,448 0 West Michigan Totals 10,837,512 192,975 308,947 2.9% 8.1% 8.5% $18.74 141,448 105,000 Downtown A 1,944,250 137,010 149,259 7.7% 11.1% 11.2% $21.85 118,000 105,000 Downtown A 1,944,250 137,010 149,259 7.7% 11.1% 11.2% $21.85 118,000 105,000 Northeast A 121,746 0 0 0.0% 0.0% 0.0% NA 0 0 Southeast A 574,983 2,726 5,264 0.9% 20.5% 22.5% $18.76 23,448 0 Southwest A 18,800 0 0 0.0% 0.0% 0.0% NA 0 0 Suburbs A 715,529 2,726 5,264 0.7% 16.5% 18.1% $18.76 23,448 0 West Michigan A 2,659,779 139,736 154,523 5.8% 12.6% 13.1% $20.75 141,448 105,000 Downtown B 3,370,669 5,675 57,039 1.7% 5.3% 5.7% $20.40 0 0 Downtown B 3,370,669 5,675 57,039 1.7% 5.3% 5.7% $20.40 0 0 Northeast B 643,150 6,622 -11,998 -1.9% 7.9% 7.9% $16.80 0 0 Northwest B 411,996 0 20,474 5.0% 0.0% 0.0% NA 0 0 Southeast B 3,309,276 51,497 83,100 2.5% 7.9% 8.3% $15.84 0 0 Southwest B 442,642 -10,555 5,809 1.3% 11.2% 11.6% $15.75 0 0 Suburbs B 4,807,064 47,564 97,385 2.0% 7.5% 7.8% $15.95 0 0 West Michigan B 8,177,733 53,239 154,424 1.9% 6.6% 7.0% $17.45 0 0