SlideShare a Scribd company logo
1 of 2
Download to read offline
© 2017 Jones Lang LaSalle IP, Inc. All rights reserved. All information contained herein is from sources deemed reliable; however, no representation or warranty is made to the accuracy thereof.
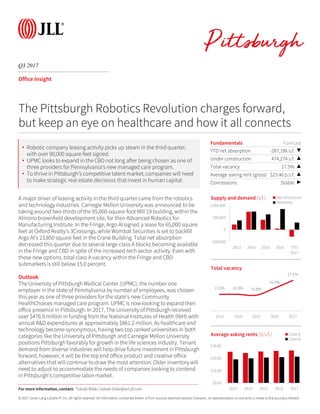
Fundamentals Forecast
YTD net absorption -287,186 s.f. ▼
Under construction 474,274 s.f. ▲
Total vacancy 17.5% ▲
Average asking rent (gross) $23.46 p.s.f. ▲
Concessions Stable ▶
Q3 2017
Office Insight
A major driver of leasing activity in the third quarter came from the robotics
and technology industries. Carnegie Mellon University was announced to be
taking around two-thirds of the 95,000-square-foot Mill 19 building, within the
Almono brownfield development site, for their Advanced Robotics for
Manufacturing Institute. In the Fringe, Argo AI signed a lease for 65,000 square
feet at Oxford Realty’s 3Crossings, while Wombat Securities is set to backfill
Argo AI’s 23,850 square feet in the Crane Building. Total net absorption
decreased this quarter due to several large class A blocks becoming available
in the Fringe and CBD in spite of the increased tech sector activity. Even with
these new options, total class A vacancy within the Fringe and CBD
submarkets is still below 15.0 percent.
Outlook
The University of Pittsburgh Medical Center (UPMC), the number one
employer in the state of Pennsylvania by number of employees, was chosen
this year as one of three providers for the state’s new Community
HealthChoices managed care program. UPMC is now looking to expand their
office presence in Pittsburgh. In 2017, The University of Pittsburgh received
over $476.9 million in funding from the National Institutes of Health (NIH) with
annual R&D expenditures at approximately $861.2 million. As healthcare and
technology become synonymous, having two top ranked universities in both
categories like the University of Pittsburgh and Carnegie Mellon University
positions Pittsburgh favorably for growth in the life sciences industry. Tenant
demand from diverse industries will help drive future investment in Pittsburgh
forward, however, it will be the top end office product and creative office
alternatives that will continue to draw the most attention. Older inventory will
need to adjust to accommodate the needs of companies looking to contend
in Pittsburgh’s competitive labor market.
-500,000
0
500,000
1,000,000
2013 2014 2015 2016 YTD
2017
Supply and demand (s.f.) Net absorption
Deliveries
The Pittsburgh Robotics Revolution charges forward,
but keep an eye on healthcare and how it all connects
15.9% 15.9% 15.8%
16.6%
17.5%
2013 2014 2015 2016 2017
Total vacancy
$0.00
$10.00
$20.00
$30.00
2013 2014 2015 2016 2017
Average asking rents ($/s.f.) Class A
Class B
For more information, contact: Tobiah Bilski | tobiah.bilski@am.jll.com
• Robotic company leasing activity picks up steam in the third quarter,
with over 90,000 square feet signed.
• UPMC looks to expand in the CBD not long after being chosen as one of
three providers for Pennsylvania’s new managed care program.
• To thrive in Pittsburgh’s competitive talent market, companies will need
to make strategic real estate decisions that invest in human capital.
© 2017 Jones Lang LaSalle IP, Inc. All rights reserved. All information contained herein is from sources deemed reliable; however, no representation or warranty is made to the accuracy thereof.
Q3 2017
Office Statistics
For more information, contact: Tobiah Bilski | tobiah.bilski@am.jll.com
Class
Inventory
(s.f.)
Total net
absorption
(s.f.)
YTD total net
absorption
(s.f.)
YTD total net
absorption
(%)
Direct
vacancy (%)
Total
vacancy (%)
Average
direct asking
rent ($ p.s.f.)
YTD
completions
(s.f.)
Under
construction
(s.f.)
CBD Totals 18,928,135 -268,932 -362,728 -1.9% 14.0% 15.9% $26.55 0 50,000
Fringe Totals 7,708,658 -144,962 -233,439 -3.0% 14.6% 17.6% $23.42 105,000 187,500
Oakland/East End Totals 2,057,856 65,841 115,278 5.6% 5.5% 5.6% $32.70 64,500 0
Urban Totals 28,694,649 -348,053 -480,889 -1.7% 13.6% 15.6% $25.84 169,500 237,500
North Totals 3,624,734 3,614 -94,712 -2.6% 11.7% 12.3% $21.44 45,000 103,000
Northern I-79/Cranberry Totals 3,442,781 50,950 173,028 5.0% 9.9% 11.5% $24.03 0 133,774
East Totals 3,045,135 41,054 91,934 3.0% 31.1% 33.0% $20.38 0 0
South Totals 2,347,259 -20,815 -51,191 -2.2% 13.3% 15.7% $20.86 80,000 0
Southpointe Totals 2,972,107 5,515 -22,431 -0.8% 19.6% 27.0% $22.51 0 0
West Totals 7,002,426 -41,522 97,075 1.4% 19.0% 20.5% $21.10 0 0
Suburban Totals 22,434,442 38,796 193,703 0.9% 17.6% 19.8% $21.37 125,000 236,774
Pittsburgh Totals 51,129,091 -309,257 -287,186 -0.6% 15.3% 17.5% $23.46 294,500 474,274
CBD A 13,102,880 -260,674 -158,092 -1.2% 11.3% 13.2% $29.61 0 50,000
Fringe A 2,087,970 -153,346 -82,658 -4.0% 3.7% 14.1% $24.89 105,000 0
Oakland/East End A 969,243 7,785 55,012 5.7% 8.0% 8.4% $34.71 64,500 0
Urban A 16,160,093 -406,235 -185,738 -1.1% 10.1% 13.0% $29.68 169,500 50,000
North A 786,347 18,394 -25,104 -3.2% 9.5% 11.6% $24.45 45,000 103,000
Northern I-79/Cranberry A 2,766,249 5,711 57,059 2.1% 9.7% 11.6% $24.50 0 44,700
East A 1,580,784 820 70,538 4.5% 28.4% 29.7% $22.15 0 0
South A 0 0 0 0.0% 0.0% 0.0% $0.00 0 0
Southpointe A 1,909,754 -8,216 -34,214 -1.8% 10.6% 20.9% $23.34 0 0
West A 3,767,504 -41,054 15,969 0.4% 16.7% 19.2% $22.69 0 0
Suburban A 10,810,638 -24,345 84,248 0.8% 15.0% 18.5% $23.21 45,000 147,700
Pittsburgh A 26,970,731 -430,580 -101,490 -0.4% 12.1% 15.2% $26.35 214,500 197,700
CBD B 5,825,255 -8,258 -204,636 -3.5% 20.2% 22.1% $22.25 0 0
Fringe B 5,620,688 8,384 -150,781 -2.7% 18.7% 18.9% $23.32 0 187,500
Oakland/East End B 1,088,613 58,056 60,266 5.5% 3.2% 3.2% $23.61 0 0
Urban B 12,534,556 58,182 -295,151 -2.4% 18.0% 19.0% $22.77 0 187,500
North B 2,838,387 -14,780 -69,608 -2.5% 12.3% 12.4% $19.02 0 0
Northern I-79/Cranberry B 676,532 45,239 115,969 17.1% 11.1% 11.1% $22.28 0 89,074
East B 1,464,351 40,234 21,396 1.5% 33.9% 36.6% $18.79 0 0
South B 2,347,259 -20,815 -51,191 -2.2% 13.3% 15.7% $20.86 80,000 0
Southpointe B 1,062,353 13,731 11,783 1.1% 35.8% 37.8% $22.06 0 0
West B 3,234,922 -468 81,106 2.5% 21.7% 21.9% $19.58 0 0
Suburban B 11,623,804 63,141 109,455 0.9% 19.9% 21.0% $20.08 80,000 89,074
Pittsburgh B 24,158,360 121,323 -185,696 -0.8% 18.9% 20.0% $21.30 80,000 276,574

More Related Content

What's hot

JLL Detroit Industrial Insight & Statistics - Q2 2017
JLL Detroit Industrial Insight & Statistics - Q2 2017JLL Detroit Industrial Insight & Statistics - Q2 2017
JLL Detroit Industrial Insight & Statistics - Q2 2017Harrison West
 
JLL Pittsburgh Industrial Insight & Statistics - Q2 2021
JLL Pittsburgh Industrial Insight & Statistics - Q2 2021JLL Pittsburgh Industrial Insight & Statistics - Q2 2021
JLL Pittsburgh Industrial Insight & Statistics - Q2 2021Tobiah Bilski
 
JLL Detroit Industrial Insight & Statistics - Q4 2018
JLL Detroit Industrial Insight & Statistics - Q4 2018JLL Detroit Industrial Insight & Statistics - Q4 2018
JLL Detroit Industrial Insight & Statistics - Q4 2018Harrison West
 
JLL Detroit Industrial Insight & Statistics - Q3 2017
JLL Detroit Industrial Insight & Statistics - Q3 2017JLL Detroit Industrial Insight & Statistics - Q3 2017
JLL Detroit Industrial Insight & Statistics - Q3 2017Harrison West
 
JLL Detroit Industrial Insight & Statistics - Q1 2017
JLL Detroit Industrial Insight & Statistics - Q1 2017JLL Detroit Industrial Insight & Statistics - Q1 2017
JLL Detroit Industrial Insight & Statistics - Q1 2017Harrison West
 
JLL Pittsburgh Industrial Insight & Statistics - Q3 2020
JLL Pittsburgh Industrial Insight & Statistics - Q3 2020JLL Pittsburgh Industrial Insight & Statistics - Q3 2020
JLL Pittsburgh Industrial Insight & Statistics - Q3 2020Tobiah Bilski
 
JLL Detroit Industrial Insight & Statistics - Q4 2018
JLL Detroit Industrial Insight & Statistics - Q4 2018JLL Detroit Industrial Insight & Statistics - Q4 2018
JLL Detroit Industrial Insight & Statistics - Q4 2018Harrison West
 
JLL Pittsburgh Industrial Insight & Statistics - Q3 2019
JLL Pittsburgh Industrial Insight & Statistics - Q3 2019JLL Pittsburgh Industrial Insight & Statistics - Q3 2019
JLL Pittsburgh Industrial Insight & Statistics - Q3 2019Tobiah Bilski
 
JLL Pittsburgh Industrial Insight & Statistics - Q1 2017
JLL Pittsburgh Industrial Insight & Statistics - Q1 2017JLL Pittsburgh Industrial Insight & Statistics - Q1 2017
JLL Pittsburgh Industrial Insight & Statistics - Q1 2017Tobiah Bilski
 
JLL Pittsburgh Office Insight & Statistics - Q2 2019
JLL Pittsburgh Office Insight & Statistics - Q2 2019JLL Pittsburgh Office Insight & Statistics - Q2 2019
JLL Pittsburgh Office Insight & Statistics - Q2 2019Tobiah Bilski
 
JLL Pittsburgh Industrial Insight & Statistics - Q4 2019
JLL Pittsburgh Industrial Insight & Statistics - Q4 2019JLL Pittsburgh Industrial Insight & Statistics - Q4 2019
JLL Pittsburgh Industrial Insight & Statistics - Q4 2019Tobiah Bilski
 
JLL Pittsburgh Industrial Insight & Statistics - Q2 2018
JLL Pittsburgh Industrial Insight & Statistics - Q2 2018JLL Pittsburgh Industrial Insight & Statistics - Q2 2018
JLL Pittsburgh Industrial Insight & Statistics - Q2 2018Tobiah Bilski
 
JLL Detroit Industrial Insight & Statistics - Q4 2017
JLL Detroit Industrial Insight & Statistics - Q4 2017JLL Detroit Industrial Insight & Statistics - Q4 2017
JLL Detroit Industrial Insight & Statistics - Q4 2017Harrison West
 
JLL Pittsburgh Industrial Insight & Statistics - Q2 2020
JLL Pittsburgh Industrial Insight & Statistics - Q2 2020JLL Pittsburgh Industrial Insight & Statistics - Q2 2020
JLL Pittsburgh Industrial Insight & Statistics - Q2 2020Tobiah Bilski
 
JLL Detroit Industrial Insight & Statistics - Q2 2016
JLL Detroit Industrial Insight & Statistics - Q2 2016JLL Detroit Industrial Insight & Statistics - Q2 2016
JLL Detroit Industrial Insight & Statistics - Q2 2016Aaron Moore
 
JLL West Michigan Industrial Insight & Statistics - Q1 2020
JLL West Michigan Industrial Insight & Statistics - Q1 2020JLL West Michigan Industrial Insight & Statistics - Q1 2020
JLL West Michigan Industrial Insight & Statistics - Q1 2020Harrison West
 
JLL Pittsburgh Industrial Insight & Statistics - Q4 201itt
JLL Pittsburgh Industrial Insight & Statistics - Q4 201ittJLL Pittsburgh Industrial Insight & Statistics - Q4 201itt
JLL Pittsburgh Industrial Insight & Statistics - Q4 201ittTobiah Bilski
 
JLL Louisville Industrial Outlook - Q4 2019
JLL Louisville Industrial Outlook - Q4 2019JLL Louisville Industrial Outlook - Q4 2019
JLL Louisville Industrial Outlook - Q4 2019Alex Westcott
 
JLL Pittsburgh Office Insight & Statistics - Q1 2019
JLL Pittsburgh Office Insight & Statistics - Q1 2019JLL Pittsburgh Office Insight & Statistics - Q1 2019
JLL Pittsburgh Office Insight & Statistics - Q1 2019Tobiah Bilski
 
St. Louis Office Insight
St. Louis Office InsightSt. Louis Office Insight
St. Louis Office InsightBlaise Tomazic
 

What's hot (20)

JLL Detroit Industrial Insight & Statistics - Q2 2017
JLL Detroit Industrial Insight & Statistics - Q2 2017JLL Detroit Industrial Insight & Statistics - Q2 2017
JLL Detroit Industrial Insight & Statistics - Q2 2017
 
JLL Pittsburgh Industrial Insight & Statistics - Q2 2021
JLL Pittsburgh Industrial Insight & Statistics - Q2 2021JLL Pittsburgh Industrial Insight & Statistics - Q2 2021
JLL Pittsburgh Industrial Insight & Statistics - Q2 2021
 
JLL Detroit Industrial Insight & Statistics - Q4 2018
JLL Detroit Industrial Insight & Statistics - Q4 2018JLL Detroit Industrial Insight & Statistics - Q4 2018
JLL Detroit Industrial Insight & Statistics - Q4 2018
 
JLL Detroit Industrial Insight & Statistics - Q3 2017
JLL Detroit Industrial Insight & Statistics - Q3 2017JLL Detroit Industrial Insight & Statistics - Q3 2017
JLL Detroit Industrial Insight & Statistics - Q3 2017
 
JLL Detroit Industrial Insight & Statistics - Q1 2017
JLL Detroit Industrial Insight & Statistics - Q1 2017JLL Detroit Industrial Insight & Statistics - Q1 2017
JLL Detroit Industrial Insight & Statistics - Q1 2017
 
JLL Pittsburgh Industrial Insight & Statistics - Q3 2020
JLL Pittsburgh Industrial Insight & Statistics - Q3 2020JLL Pittsburgh Industrial Insight & Statistics - Q3 2020
JLL Pittsburgh Industrial Insight & Statistics - Q3 2020
 
JLL Detroit Industrial Insight & Statistics - Q4 2018
JLL Detroit Industrial Insight & Statistics - Q4 2018JLL Detroit Industrial Insight & Statistics - Q4 2018
JLL Detroit Industrial Insight & Statistics - Q4 2018
 
JLL Pittsburgh Industrial Insight & Statistics - Q3 2019
JLL Pittsburgh Industrial Insight & Statistics - Q3 2019JLL Pittsburgh Industrial Insight & Statistics - Q3 2019
JLL Pittsburgh Industrial Insight & Statistics - Q3 2019
 
JLL Pittsburgh Industrial Insight & Statistics - Q1 2017
JLL Pittsburgh Industrial Insight & Statistics - Q1 2017JLL Pittsburgh Industrial Insight & Statistics - Q1 2017
JLL Pittsburgh Industrial Insight & Statistics - Q1 2017
 
JLL Pittsburgh Office Insight & Statistics - Q2 2019
JLL Pittsburgh Office Insight & Statistics - Q2 2019JLL Pittsburgh Office Insight & Statistics - Q2 2019
JLL Pittsburgh Office Insight & Statistics - Q2 2019
 
JLL Pittsburgh Industrial Insight & Statistics - Q4 2019
JLL Pittsburgh Industrial Insight & Statistics - Q4 2019JLL Pittsburgh Industrial Insight & Statistics - Q4 2019
JLL Pittsburgh Industrial Insight & Statistics - Q4 2019
 
JLL Pittsburgh Industrial Insight & Statistics - Q2 2018
JLL Pittsburgh Industrial Insight & Statistics - Q2 2018JLL Pittsburgh Industrial Insight & Statistics - Q2 2018
JLL Pittsburgh Industrial Insight & Statistics - Q2 2018
 
JLL Detroit Industrial Insight & Statistics - Q4 2017
JLL Detroit Industrial Insight & Statistics - Q4 2017JLL Detroit Industrial Insight & Statistics - Q4 2017
JLL Detroit Industrial Insight & Statistics - Q4 2017
 
JLL Pittsburgh Industrial Insight & Statistics - Q2 2020
JLL Pittsburgh Industrial Insight & Statistics - Q2 2020JLL Pittsburgh Industrial Insight & Statistics - Q2 2020
JLL Pittsburgh Industrial Insight & Statistics - Q2 2020
 
JLL Detroit Industrial Insight & Statistics - Q2 2016
JLL Detroit Industrial Insight & Statistics - Q2 2016JLL Detroit Industrial Insight & Statistics - Q2 2016
JLL Detroit Industrial Insight & Statistics - Q2 2016
 
JLL West Michigan Industrial Insight & Statistics - Q1 2020
JLL West Michigan Industrial Insight & Statistics - Q1 2020JLL West Michigan Industrial Insight & Statistics - Q1 2020
JLL West Michigan Industrial Insight & Statistics - Q1 2020
 
JLL Pittsburgh Industrial Insight & Statistics - Q4 201itt
JLL Pittsburgh Industrial Insight & Statistics - Q4 201ittJLL Pittsburgh Industrial Insight & Statistics - Q4 201itt
JLL Pittsburgh Industrial Insight & Statistics - Q4 201itt
 
JLL Louisville Industrial Outlook - Q4 2019
JLL Louisville Industrial Outlook - Q4 2019JLL Louisville Industrial Outlook - Q4 2019
JLL Louisville Industrial Outlook - Q4 2019
 
JLL Pittsburgh Office Insight & Statistics - Q1 2019
JLL Pittsburgh Office Insight & Statistics - Q1 2019JLL Pittsburgh Office Insight & Statistics - Q1 2019
JLL Pittsburgh Office Insight & Statistics - Q1 2019
 
St. Louis Office Insight
St. Louis Office InsightSt. Louis Office Insight
St. Louis Office Insight
 

Similar to Pittsburgh robotics and healthcare drive office growth

JLL Pittsburgh Office Insight & Statistics - Q4 2019
JLL Pittsburgh Office Insight & Statistics - Q4 2019JLL Pittsburgh Office Insight & Statistics - Q4 2019
JLL Pittsburgh Office Insight & Statistics - Q4 2019Tobiah Bilski
 
JLL Pittsburgh Office Insight & Statistics - Q4 2017
JLL Pittsburgh Office Insight & Statistics - Q4 2017JLL Pittsburgh Office Insight & Statistics - Q4 2017
JLL Pittsburgh Office Insight & Statistics - Q4 2017Tobiah Bilski
 
JLL Pittsburgh Office Insight & Statistics - Q1 2018
JLL Pittsburgh Office Insight & Statistics - Q1 2018JLL Pittsburgh Office Insight & Statistics - Q1 2018
JLL Pittsburgh Office Insight & Statistics - Q1 2018Tobiah Bilski
 
JLL Pittsburgh Office Insight & Statistics - Q2 2018
JLL Pittsburgh Office Insight & Statistics - Q2 2018 JLL Pittsburgh Office Insight & Statistics - Q2 2018
JLL Pittsburgh Office Insight & Statistics - Q2 2018 Tobiah Bilski
 
JLL Pittsburgh Office Insight & Statistics - Q3 2018
JLL Pittsburgh Office Insight & Statistics - Q3 2018JLL Pittsburgh Office Insight & Statistics - Q3 2018
JLL Pittsburgh Office Insight & Statistics - Q3 2018Tobiah Bilski
 
JLL Pittsburgh Industrial Insight & Statistics - Q3 2018
JLL Pittsburgh Industrial Insight & Statistics - Q3 2018JLL Pittsburgh Industrial Insight & Statistics - Q3 2018
JLL Pittsburgh Industrial Insight & Statistics - Q3 2018Tobiah Bilski
 
JLL Cincinnati Industrial Outlook Q3 2017
JLL Cincinnati Industrial Outlook  Q3 2017JLL Cincinnati Industrial Outlook  Q3 2017
JLL Cincinnati Industrial Outlook Q3 2017Abby Armbruster
 
Jll cincinnati industrial outlook q1 2017
Jll cincinnati industrial outlook   q1 2017Jll cincinnati industrial outlook   q1 2017
Jll cincinnati industrial outlook q1 2017Abby Armbruster
 
JLL Louisville Office Outlook Q4 2017
JLL Louisville Office Outlook Q4 2017JLL Louisville Office Outlook Q4 2017
JLL Louisville Office Outlook Q4 2017Alex Westcott
 
JLL Louisville Office Outlook - Q2 2018
JLL Louisville Office Outlook - Q2 2018JLL Louisville Office Outlook - Q2 2018
JLL Louisville Office Outlook - Q2 2018Alex Westcott
 
JLL Cincinnati Industrial Outlook Q4 2017
JLL Cincinnati Industrial Outlook Q4 2017JLL Cincinnati Industrial Outlook Q4 2017
JLL Cincinnati Industrial Outlook Q4 2017Abby Armbruster
 
JLL Pittsburgh Industrial Insight & Statistics - Q4 2018
JLL Pittsburgh Industrial Insight & Statistics - Q4 2018JLL Pittsburgh Industrial Insight & Statistics - Q4 2018
JLL Pittsburgh Industrial Insight & Statistics - Q4 2018Tobiah Bilski
 
JLL Pittsburgh Office Insight & Statistics - Q3 2019
 JLL Pittsburgh Office Insight & Statistics - Q3 2019 JLL Pittsburgh Office Insight & Statistics - Q3 2019
JLL Pittsburgh Office Insight & Statistics - Q3 2019Tobiah Bilski
 
JLL Louisville Industrial Outlook Q3 2017
JLL Louisville Industrial Outlook  Q3 2017 JLL Louisville Industrial Outlook  Q3 2017
JLL Louisville Industrial Outlook Q3 2017 Ross Bratcher
 
JLL Cincinnati Office Insight & Statistics - Q2 2016
JLL Cincinnati Office Insight & Statistics - Q2 2016JLL Cincinnati Office Insight & Statistics - Q2 2016
JLL Cincinnati Office Insight & Statistics - Q2 2016Ross Bratcher
 
JLL Cleveland Office Outlook: Q4 2018
JLL Cleveland Office Outlook: Q4 2018JLL Cleveland Office Outlook: Q4 2018
JLL Cleveland Office Outlook: Q4 2018Andrew Batson
 
JLL Louisville Industrial Outlook - Q1 2018
JLL Louisville Industrial Outlook - Q1 2018 JLL Louisville Industrial Outlook - Q1 2018
JLL Louisville Industrial Outlook - Q1 2018 Alex Westcott
 
JLL Pittsburgh Office Insight & Statistics - Q2 2020
JLL Pittsburgh Office Insight & Statistics - Q2 2020JLL Pittsburgh Office Insight & Statistics - Q2 2020
JLL Pittsburgh Office Insight & Statistics - Q2 2020Tobiah Bilski
 
JLL Cincinnati Industrial Outlook - Q3 2016
JLL Cincinnati Industrial Outlook - Q3 2016JLL Cincinnati Industrial Outlook - Q3 2016
JLL Cincinnati Industrial Outlook - Q3 2016Ross Bratcher
 

Similar to Pittsburgh robotics and healthcare drive office growth (20)

JLL Pittsburgh Office Insight & Statistics - Q4 2019
JLL Pittsburgh Office Insight & Statistics - Q4 2019JLL Pittsburgh Office Insight & Statistics - Q4 2019
JLL Pittsburgh Office Insight & Statistics - Q4 2019
 
JLL Pittsburgh Office Insight & Statistics - Q4 2017
JLL Pittsburgh Office Insight & Statistics - Q4 2017JLL Pittsburgh Office Insight & Statistics - Q4 2017
JLL Pittsburgh Office Insight & Statistics - Q4 2017
 
JLL Pittsburgh Office Insight & Statistics - Q1 2018
JLL Pittsburgh Office Insight & Statistics - Q1 2018JLL Pittsburgh Office Insight & Statistics - Q1 2018
JLL Pittsburgh Office Insight & Statistics - Q1 2018
 
JLL Pittsburgh Office Insight & Statistics - Q2 2018
JLL Pittsburgh Office Insight & Statistics - Q2 2018 JLL Pittsburgh Office Insight & Statistics - Q2 2018
JLL Pittsburgh Office Insight & Statistics - Q2 2018
 
JLL Pittsburgh Office Insight & Statistics - Q3 2018
JLL Pittsburgh Office Insight & Statistics - Q3 2018JLL Pittsburgh Office Insight & Statistics - Q3 2018
JLL Pittsburgh Office Insight & Statistics - Q3 2018
 
JLL Pittsburgh Industrial Insight & Statistics - Q3 2018
JLL Pittsburgh Industrial Insight & Statistics - Q3 2018JLL Pittsburgh Industrial Insight & Statistics - Q3 2018
JLL Pittsburgh Industrial Insight & Statistics - Q3 2018
 
JLL Cincinnati Industrial Outlook Q3 2017
JLL Cincinnati Industrial Outlook  Q3 2017JLL Cincinnati Industrial Outlook  Q3 2017
JLL Cincinnati Industrial Outlook Q3 2017
 
Jll cincinnati industrial outlook q1 2017
Jll cincinnati industrial outlook   q1 2017Jll cincinnati industrial outlook   q1 2017
Jll cincinnati industrial outlook q1 2017
 
JLL Louisville Office Outlook Q4 2017
JLL Louisville Office Outlook Q4 2017JLL Louisville Office Outlook Q4 2017
JLL Louisville Office Outlook Q4 2017
 
JLL Louisville Office Outlook - Q2 2018
JLL Louisville Office Outlook - Q2 2018JLL Louisville Office Outlook - Q2 2018
JLL Louisville Office Outlook - Q2 2018
 
JLL Cincinnati Industrial Outlook Q4 2017
JLL Cincinnati Industrial Outlook Q4 2017JLL Cincinnati Industrial Outlook Q4 2017
JLL Cincinnati Industrial Outlook Q4 2017
 
JLL Pittsburgh Industrial Insight & Statistics - Q4 2018
JLL Pittsburgh Industrial Insight & Statistics - Q4 2018JLL Pittsburgh Industrial Insight & Statistics - Q4 2018
JLL Pittsburgh Industrial Insight & Statistics - Q4 2018
 
JLL Pittsburgh Office Insight & Statistics - Q3 2019
 JLL Pittsburgh Office Insight & Statistics - Q3 2019 JLL Pittsburgh Office Insight & Statistics - Q3 2019
JLL Pittsburgh Office Insight & Statistics - Q3 2019
 
JLL Louisville Industrial Outlook Q3 2017
JLL Louisville Industrial Outlook  Q3 2017 JLL Louisville Industrial Outlook  Q3 2017
JLL Louisville Industrial Outlook Q3 2017
 
JLL Cincinnati Office Insight & Statistics - Q2 2016
JLL Cincinnati Office Insight & Statistics - Q2 2016JLL Cincinnati Office Insight & Statistics - Q2 2016
JLL Cincinnati Office Insight & Statistics - Q2 2016
 
JLL Cleveland Office Outlook: Q4 2018
JLL Cleveland Office Outlook: Q4 2018JLL Cleveland Office Outlook: Q4 2018
JLL Cleveland Office Outlook: Q4 2018
 
JLL Louisville Industrial Outlook - Q1 2018
JLL Louisville Industrial Outlook - Q1 2018 JLL Louisville Industrial Outlook - Q1 2018
JLL Louisville Industrial Outlook - Q1 2018
 
JLL Pittsburgh Office Insight & Statistics - Q2 2020
JLL Pittsburgh Office Insight & Statistics - Q2 2020JLL Pittsburgh Office Insight & Statistics - Q2 2020
JLL Pittsburgh Office Insight & Statistics - Q2 2020
 
Q3 2019 | Austin Office | Research & Forecast Report
Q3 2019 | Austin Office | Research & Forecast ReportQ3 2019 | Austin Office | Research & Forecast Report
Q3 2019 | Austin Office | Research & Forecast Report
 
JLL Cincinnati Industrial Outlook - Q3 2016
JLL Cincinnati Industrial Outlook - Q3 2016JLL Cincinnati Industrial Outlook - Q3 2016
JLL Cincinnati Industrial Outlook - Q3 2016
 

More from Tobiah Bilski

Pittsburgh Office Insight & Stats Q1 2022
Pittsburgh Office Insight & Stats Q1 2022Pittsburgh Office Insight & Stats Q1 2022
Pittsburgh Office Insight & Stats Q1 2022Tobiah Bilski
 
JLL Pittsburgh Industrial Insight & Statistics - Q4 2021
JLL Pittsburgh Industrial Insight & Statistics - Q4 2021JLL Pittsburgh Industrial Insight & Statistics - Q4 2021
JLL Pittsburgh Industrial Insight & Statistics - Q4 2021Tobiah Bilski
 
Pittsburgh Office Insight & Stats Q4 2021
Pittsburgh Office Insight & Stats Q4 2021Pittsburgh Office Insight & Stats Q4 2021
Pittsburgh Office Insight & Stats Q4 2021Tobiah Bilski
 
JLL Pittsburgh Industrial Insight & Statistics - Q3 2021
JLL Pittsburgh Industrial Insight & Statistics - Q3 2021JLL Pittsburgh Industrial Insight & Statistics - Q3 2021
JLL Pittsburgh Industrial Insight & Statistics - Q3 2021Tobiah Bilski
 
JLL Pittsburgh Industrial Insight & Statistics - Q1 2021
JLL Pittsburgh Industrial Insight & Statistics - Q1 2021JLL Pittsburgh Industrial Insight & Statistics - Q1 2021
JLL Pittsburgh Industrial Insight & Statistics - Q1 2021Tobiah Bilski
 
JLL Pittsburgh Office Insight & Statistics - Q1 2021
JLL Pittsburgh Office Insight & Statistics - Q1 2021JLL Pittsburgh Office Insight & Statistics - Q1 2021
JLL Pittsburgh Office Insight & Statistics - Q1 2021Tobiah Bilski
 
JLL Pittsburgh Industrial Insight & Statistics - Q4 2020
JLL Pittsburgh Industrial Insight & Statistics - Q4 2020JLL Pittsburgh Industrial Insight & Statistics - Q4 2020
JLL Pittsburgh Industrial Insight & Statistics - Q4 2020Tobiah Bilski
 
JLL Pittsburgh Industrial Insight & Statistics - Q1 2020
JLL Pittsburgh Industrial Insight & Statistics - Q1 2020JLL Pittsburgh Industrial Insight & Statistics - Q1 2020
JLL Pittsburgh Industrial Insight & Statistics - Q1 2020Tobiah Bilski
 
JLL Pittsburgh Industrial Insight & Statistics - Q2 2019
JLL Pittsburgh Industrial Insight & Statistics - Q2 2019JLL Pittsburgh Industrial Insight & Statistics - Q2 2019
JLL Pittsburgh Industrial Insight & Statistics - Q2 2019Tobiah Bilski
 
JLL Pittsburgh Industrial Insight & Statistics - Q1 2019
JLL Pittsburgh Industrial Insight & Statistics - Q1 2019JLL Pittsburgh Industrial Insight & Statistics - Q1 2019
JLL Pittsburgh Industrial Insight & Statistics - Q1 2019Tobiah Bilski
 

More from Tobiah Bilski (10)

Pittsburgh Office Insight & Stats Q1 2022
Pittsburgh Office Insight & Stats Q1 2022Pittsburgh Office Insight & Stats Q1 2022
Pittsburgh Office Insight & Stats Q1 2022
 
JLL Pittsburgh Industrial Insight & Statistics - Q4 2021
JLL Pittsburgh Industrial Insight & Statistics - Q4 2021JLL Pittsburgh Industrial Insight & Statistics - Q4 2021
JLL Pittsburgh Industrial Insight & Statistics - Q4 2021
 
Pittsburgh Office Insight & Stats Q4 2021
Pittsburgh Office Insight & Stats Q4 2021Pittsburgh Office Insight & Stats Q4 2021
Pittsburgh Office Insight & Stats Q4 2021
 
JLL Pittsburgh Industrial Insight & Statistics - Q3 2021
JLL Pittsburgh Industrial Insight & Statistics - Q3 2021JLL Pittsburgh Industrial Insight & Statistics - Q3 2021
JLL Pittsburgh Industrial Insight & Statistics - Q3 2021
 
JLL Pittsburgh Industrial Insight & Statistics - Q1 2021
JLL Pittsburgh Industrial Insight & Statistics - Q1 2021JLL Pittsburgh Industrial Insight & Statistics - Q1 2021
JLL Pittsburgh Industrial Insight & Statistics - Q1 2021
 
JLL Pittsburgh Office Insight & Statistics - Q1 2021
JLL Pittsburgh Office Insight & Statistics - Q1 2021JLL Pittsburgh Office Insight & Statistics - Q1 2021
JLL Pittsburgh Office Insight & Statistics - Q1 2021
 
JLL Pittsburgh Industrial Insight & Statistics - Q4 2020
JLL Pittsburgh Industrial Insight & Statistics - Q4 2020JLL Pittsburgh Industrial Insight & Statistics - Q4 2020
JLL Pittsburgh Industrial Insight & Statistics - Q4 2020
 
JLL Pittsburgh Industrial Insight & Statistics - Q1 2020
JLL Pittsburgh Industrial Insight & Statistics - Q1 2020JLL Pittsburgh Industrial Insight & Statistics - Q1 2020
JLL Pittsburgh Industrial Insight & Statistics - Q1 2020
 
JLL Pittsburgh Industrial Insight & Statistics - Q2 2019
JLL Pittsburgh Industrial Insight & Statistics - Q2 2019JLL Pittsburgh Industrial Insight & Statistics - Q2 2019
JLL Pittsburgh Industrial Insight & Statistics - Q2 2019
 
JLL Pittsburgh Industrial Insight & Statistics - Q1 2019
JLL Pittsburgh Industrial Insight & Statistics - Q1 2019JLL Pittsburgh Industrial Insight & Statistics - Q1 2019
JLL Pittsburgh Industrial Insight & Statistics - Q1 2019
 

Recently uploaded

call girls in lajapat nagar 9811711561/..
call girls in lajapat nagar 9811711561/..call girls in lajapat nagar 9811711561/..
call girls in lajapat nagar 9811711561/..vikas rana
 
Nanke Area Estate commercial ( Dir. Kat Kuo)
Nanke Area Estate commercial ( Dir. Kat Kuo)Nanke Area Estate commercial ( Dir. Kat Kuo)
Nanke Area Estate commercial ( Dir. Kat Kuo)jessica288382
 
Call Girls Janta Market {Delhi//8447779280)) ₹↬Short 2000 Full Night 5500 ↫Es...
Call Girls Janta Market {Delhi//8447779280)) ₹↬Short 2000 Full Night 5500 ↫Es...Call Girls Janta Market {Delhi//8447779280)) ₹↬Short 2000 Full Night 5500 ↫Es...
Call Girls Janta Market {Delhi//8447779280)) ₹↬Short 2000 Full Night 5500 ↫Es...asmaqueen5
 
Call Girls in Noida Sector 11 Noida 💯Call Us 🔝 9582086666 🔝 South Delhi Escor...
Call Girls in Noida Sector 11 Noida 💯Call Us 🔝 9582086666 🔝 South Delhi Escor...Call Girls in Noida Sector 11 Noida 💯Call Us 🔝 9582086666 🔝 South Delhi Escor...
Call Girls in Noida Sector 11 Noida 💯Call Us 🔝 9582086666 🔝 South Delhi Escor...delhimodel235
 
Call Girls in Noida Sector 12 Noida 💯Call Us 🔝 9582086666 🔝 South Delhi Escor...
Call Girls in Noida Sector 12 Noida 💯Call Us 🔝 9582086666 🔝 South Delhi Escor...Call Girls in Noida Sector 12 Noida 💯Call Us 🔝 9582086666 🔝 South Delhi Escor...
Call Girls in Noida Sector 12 Noida 💯Call Us 🔝 9582086666 🔝 South Delhi Escor...delhimodel235
 
The Omaxe State Dwarka Delhi-broucher.pdf.pdf
The Omaxe State Dwarka Delhi-broucher.pdf.pdfThe Omaxe State Dwarka Delhi-broucher.pdf.pdf
The Omaxe State Dwarka Delhi-broucher.pdf.pdfkratirudram
 
Call Girls in shastri nagar Delhi 8264348440 ✅ call girls ❤️
Call Girls in shastri nagar Delhi 8264348440 ✅ call girls ❤️Call Girls in shastri nagar Delhi 8264348440 ✅ call girls ❤️
Call Girls in shastri nagar Delhi 8264348440 ✅ call girls ❤️soniya singh
 
9711199012 Call {Girls Delhi} Very Low rate Vaishali DownLoad PDF
9711199012 Call {Girls Delhi} Very Low rate Vaishali DownLoad PDF9711199012 Call {Girls Delhi} Very Low rate Vaishali DownLoad PDF
9711199012 Call {Girls Delhi} Very Low rate Vaishali DownLoad PDFMs Riya
 
Model Call Girl in Shastri Nagar Delhi reach out to us at 🔝8264348440🔝
Model Call Girl in Shastri Nagar Delhi reach out to us at 🔝8264348440🔝Model Call Girl in Shastri Nagar Delhi reach out to us at 🔝8264348440🔝
Model Call Girl in Shastri Nagar Delhi reach out to us at 🔝8264348440🔝soniya singh
 
call girls in ganesh nagar Delhi 8264348440 ✅ call girls ❤️
call girls in ganesh nagar Delhi 8264348440 ✅ call girls ❤️call girls in ganesh nagar Delhi 8264348440 ✅ call girls ❤️
call girls in ganesh nagar Delhi 8264348440 ✅ call girls ❤️soniya singh
 
Rustomjee Cleon Bandra East, Mumbai - Brochure.pdf
Rustomjee Cleon Bandra East, Mumbai - Brochure.pdfRustomjee Cleon Bandra East, Mumbai - Brochure.pdf
Rustomjee Cleon Bandra East, Mumbai - Brochure.pdfmonikasharma630
 
Raquel Thompson: Combining Creativity with Practicality in Architecture
Raquel Thompson: Combining  Creativity with Practicality in ArchitectureRaquel Thompson: Combining  Creativity with Practicality in Architecture
Raquel Thompson: Combining Creativity with Practicality in ArchitectureRaquel Thompson Barbados
 
Puravankara Mundhwa Pune E-Brochure.pdf
Puravankara Mundhwa Pune  E-Brochure.pdfPuravankara Mundhwa Pune  E-Brochure.pdf
Puravankara Mundhwa Pune E-Brochure.pdfManishSaxena95
 
Call Girls In Mayur Vihar Delhi ☆↫8447779280 ❤Escorts Service In Delhi
Call Girls In Mayur Vihar Delhi ☆↫8447779280 ❤Escorts Service In DelhiCall Girls In Mayur Vihar Delhi ☆↫8447779280 ❤Escorts Service In Delhi
Call Girls In Mayur Vihar Delhi ☆↫8447779280 ❤Escorts Service In Delhiasmaqueen5
 
Call Girls In Chand Nagar (Delhi)+918447779280 Welcome To Vip Women Seeking M...
Call Girls In Chand Nagar (Delhi)+918447779280 Welcome To Vip Women Seeking M...Call Girls In Chand Nagar (Delhi)+918447779280 Welcome To Vip Women Seeking M...
Call Girls In Chand Nagar (Delhi)+918447779280 Welcome To Vip Women Seeking M...asmaqueen5
 
Telibagh & Call Girls Lucknow - 450+ Call Girl Cash Payment 🎂 8923113531 🎪 Ne...
Telibagh & Call Girls Lucknow - 450+ Call Girl Cash Payment 🎂 8923113531 🎪 Ne...Telibagh & Call Girls Lucknow - 450+ Call Girl Cash Payment 🎂 8923113531 🎪 Ne...
Telibagh & Call Girls Lucknow - 450+ Call Girl Cash Payment 🎂 8923113531 🎪 Ne...gurkirankumar98700
 
Call Girls in Janakpuri ↫8447779280↫Short 1500 Night 6000-Escorts Service In ...
Call Girls in Janakpuri ↫8447779280↫Short 1500 Night 6000-Escorts Service In ...Call Girls in Janakpuri ↫8447779280↫Short 1500 Night 6000-Escorts Service In ...
Call Girls in Janakpuri ↫8447779280↫Short 1500 Night 6000-Escorts Service In ...asmaqueen5
 
Omaxe Dwarka In Delhi E Brochure Pdf
Omaxe Dwarka In Delhi E Brochure     PdfOmaxe Dwarka In Delhi E Brochure     Pdf
Omaxe Dwarka In Delhi E Brochure Pdfashiyadav24
 
FULL ENJOY - 8264348440 Call Girls in DLf Phase 4 | Gurgaon
FULL ENJOY - 8264348440 Call Girls in DLf Phase 4 | GurgaonFULL ENJOY - 8264348440 Call Girls in DLf Phase 4 | Gurgaon
FULL ENJOY - 8264348440 Call Girls in DLf Phase 4 | Gurgaonsoniya singh
 

Recently uploaded (20)

call girls in lajapat nagar 9811711561/..
call girls in lajapat nagar 9811711561/..call girls in lajapat nagar 9811711561/..
call girls in lajapat nagar 9811711561/..
 
Nanke Area Estate commercial ( Dir. Kat Kuo)
Nanke Area Estate commercial ( Dir. Kat Kuo)Nanke Area Estate commercial ( Dir. Kat Kuo)
Nanke Area Estate commercial ( Dir. Kat Kuo)
 
Call Girls Janta Market {Delhi//8447779280)) ₹↬Short 2000 Full Night 5500 ↫Es...
Call Girls Janta Market {Delhi//8447779280)) ₹↬Short 2000 Full Night 5500 ↫Es...Call Girls Janta Market {Delhi//8447779280)) ₹↬Short 2000 Full Night 5500 ↫Es...
Call Girls Janta Market {Delhi//8447779280)) ₹↬Short 2000 Full Night 5500 ↫Es...
 
VIP Escorts in Delhi:🔝9953056974🔝 Hot Qutub Minar Delhi Escorts Service
VIP Escorts in Delhi:🔝9953056974🔝 Hot Qutub Minar Delhi Escorts ServiceVIP Escorts in Delhi:🔝9953056974🔝 Hot Qutub Minar Delhi Escorts Service
VIP Escorts in Delhi:🔝9953056974🔝 Hot Qutub Minar Delhi Escorts Service
 
Call Girls in Noida Sector 11 Noida 💯Call Us 🔝 9582086666 🔝 South Delhi Escor...
Call Girls in Noida Sector 11 Noida 💯Call Us 🔝 9582086666 🔝 South Delhi Escor...Call Girls in Noida Sector 11 Noida 💯Call Us 🔝 9582086666 🔝 South Delhi Escor...
Call Girls in Noida Sector 11 Noida 💯Call Us 🔝 9582086666 🔝 South Delhi Escor...
 
Call Girls in Noida Sector 12 Noida 💯Call Us 🔝 9582086666 🔝 South Delhi Escor...
Call Girls in Noida Sector 12 Noida 💯Call Us 🔝 9582086666 🔝 South Delhi Escor...Call Girls in Noida Sector 12 Noida 💯Call Us 🔝 9582086666 🔝 South Delhi Escor...
Call Girls in Noida Sector 12 Noida 💯Call Us 🔝 9582086666 🔝 South Delhi Escor...
 
The Omaxe State Dwarka Delhi-broucher.pdf.pdf
The Omaxe State Dwarka Delhi-broucher.pdf.pdfThe Omaxe State Dwarka Delhi-broucher.pdf.pdf
The Omaxe State Dwarka Delhi-broucher.pdf.pdf
 
Call Girls in shastri nagar Delhi 8264348440 ✅ call girls ❤️
Call Girls in shastri nagar Delhi 8264348440 ✅ call girls ❤️Call Girls in shastri nagar Delhi 8264348440 ✅ call girls ❤️
Call Girls in shastri nagar Delhi 8264348440 ✅ call girls ❤️
 
9711199012 Call {Girls Delhi} Very Low rate Vaishali DownLoad PDF
9711199012 Call {Girls Delhi} Very Low rate Vaishali DownLoad PDF9711199012 Call {Girls Delhi} Very Low rate Vaishali DownLoad PDF
9711199012 Call {Girls Delhi} Very Low rate Vaishali DownLoad PDF
 
Model Call Girl in Shastri Nagar Delhi reach out to us at 🔝8264348440🔝
Model Call Girl in Shastri Nagar Delhi reach out to us at 🔝8264348440🔝Model Call Girl in Shastri Nagar Delhi reach out to us at 🔝8264348440🔝
Model Call Girl in Shastri Nagar Delhi reach out to us at 🔝8264348440🔝
 
call girls in ganesh nagar Delhi 8264348440 ✅ call girls ❤️
call girls in ganesh nagar Delhi 8264348440 ✅ call girls ❤️call girls in ganesh nagar Delhi 8264348440 ✅ call girls ❤️
call girls in ganesh nagar Delhi 8264348440 ✅ call girls ❤️
 
Rustomjee Cleon Bandra East, Mumbai - Brochure.pdf
Rustomjee Cleon Bandra East, Mumbai - Brochure.pdfRustomjee Cleon Bandra East, Mumbai - Brochure.pdf
Rustomjee Cleon Bandra East, Mumbai - Brochure.pdf
 
Raquel Thompson: Combining Creativity with Practicality in Architecture
Raquel Thompson: Combining  Creativity with Practicality in ArchitectureRaquel Thompson: Combining  Creativity with Practicality in Architecture
Raquel Thompson: Combining Creativity with Practicality in Architecture
 
Puravankara Mundhwa Pune E-Brochure.pdf
Puravankara Mundhwa Pune  E-Brochure.pdfPuravankara Mundhwa Pune  E-Brochure.pdf
Puravankara Mundhwa Pune E-Brochure.pdf
 
Call Girls In Mayur Vihar Delhi ☆↫8447779280 ❤Escorts Service In Delhi
Call Girls In Mayur Vihar Delhi ☆↫8447779280 ❤Escorts Service In DelhiCall Girls In Mayur Vihar Delhi ☆↫8447779280 ❤Escorts Service In Delhi
Call Girls In Mayur Vihar Delhi ☆↫8447779280 ❤Escorts Service In Delhi
 
Call Girls In Chand Nagar (Delhi)+918447779280 Welcome To Vip Women Seeking M...
Call Girls In Chand Nagar (Delhi)+918447779280 Welcome To Vip Women Seeking M...Call Girls In Chand Nagar (Delhi)+918447779280 Welcome To Vip Women Seeking M...
Call Girls In Chand Nagar (Delhi)+918447779280 Welcome To Vip Women Seeking M...
 
Telibagh & Call Girls Lucknow - 450+ Call Girl Cash Payment 🎂 8923113531 🎪 Ne...
Telibagh & Call Girls Lucknow - 450+ Call Girl Cash Payment 🎂 8923113531 🎪 Ne...Telibagh & Call Girls Lucknow - 450+ Call Girl Cash Payment 🎂 8923113531 🎪 Ne...
Telibagh & Call Girls Lucknow - 450+ Call Girl Cash Payment 🎂 8923113531 🎪 Ne...
 
Call Girls in Janakpuri ↫8447779280↫Short 1500 Night 6000-Escorts Service In ...
Call Girls in Janakpuri ↫8447779280↫Short 1500 Night 6000-Escorts Service In ...Call Girls in Janakpuri ↫8447779280↫Short 1500 Night 6000-Escorts Service In ...
Call Girls in Janakpuri ↫8447779280↫Short 1500 Night 6000-Escorts Service In ...
 
Omaxe Dwarka In Delhi E Brochure Pdf
Omaxe Dwarka In Delhi E Brochure     PdfOmaxe Dwarka In Delhi E Brochure     Pdf
Omaxe Dwarka In Delhi E Brochure Pdf
 
FULL ENJOY - 8264348440 Call Girls in DLf Phase 4 | Gurgaon
FULL ENJOY - 8264348440 Call Girls in DLf Phase 4 | GurgaonFULL ENJOY - 8264348440 Call Girls in DLf Phase 4 | Gurgaon
FULL ENJOY - 8264348440 Call Girls in DLf Phase 4 | Gurgaon
 

Pittsburgh robotics and healthcare drive office growth

  • 1. © 2017 Jones Lang LaSalle IP, Inc. All rights reserved. All information contained herein is from sources deemed reliable; however, no representation or warranty is made to the accuracy thereof. Fundamentals Forecast YTD net absorption -287,186 s.f. ▼ Under construction 474,274 s.f. ▲ Total vacancy 17.5% ▲ Average asking rent (gross) $23.46 p.s.f. ▲ Concessions Stable ▶ Q3 2017 Office Insight A major driver of leasing activity in the third quarter came from the robotics and technology industries. Carnegie Mellon University was announced to be taking around two-thirds of the 95,000-square-foot Mill 19 building, within the Almono brownfield development site, for their Advanced Robotics for Manufacturing Institute. In the Fringe, Argo AI signed a lease for 65,000 square feet at Oxford Realty’s 3Crossings, while Wombat Securities is set to backfill Argo AI’s 23,850 square feet in the Crane Building. Total net absorption decreased this quarter due to several large class A blocks becoming available in the Fringe and CBD in spite of the increased tech sector activity. Even with these new options, total class A vacancy within the Fringe and CBD submarkets is still below 15.0 percent. Outlook The University of Pittsburgh Medical Center (UPMC), the number one employer in the state of Pennsylvania by number of employees, was chosen this year as one of three providers for the state’s new Community HealthChoices managed care program. UPMC is now looking to expand their office presence in Pittsburgh. In 2017, The University of Pittsburgh received over $476.9 million in funding from the National Institutes of Health (NIH) with annual R&D expenditures at approximately $861.2 million. As healthcare and technology become synonymous, having two top ranked universities in both categories like the University of Pittsburgh and Carnegie Mellon University positions Pittsburgh favorably for growth in the life sciences industry. Tenant demand from diverse industries will help drive future investment in Pittsburgh forward, however, it will be the top end office product and creative office alternatives that will continue to draw the most attention. Older inventory will need to adjust to accommodate the needs of companies looking to contend in Pittsburgh’s competitive labor market. -500,000 0 500,000 1,000,000 2013 2014 2015 2016 YTD 2017 Supply and demand (s.f.) Net absorption Deliveries The Pittsburgh Robotics Revolution charges forward, but keep an eye on healthcare and how it all connects 15.9% 15.9% 15.8% 16.6% 17.5% 2013 2014 2015 2016 2017 Total vacancy $0.00 $10.00 $20.00 $30.00 2013 2014 2015 2016 2017 Average asking rents ($/s.f.) Class A Class B For more information, contact: Tobiah Bilski | tobiah.bilski@am.jll.com • Robotic company leasing activity picks up steam in the third quarter, with over 90,000 square feet signed. • UPMC looks to expand in the CBD not long after being chosen as one of three providers for Pennsylvania’s new managed care program. • To thrive in Pittsburgh’s competitive talent market, companies will need to make strategic real estate decisions that invest in human capital.
  • 2. © 2017 Jones Lang LaSalle IP, Inc. All rights reserved. All information contained herein is from sources deemed reliable; however, no representation or warranty is made to the accuracy thereof. Q3 2017 Office Statistics For more information, contact: Tobiah Bilski | tobiah.bilski@am.jll.com Class Inventory (s.f.) Total net absorption (s.f.) YTD total net absorption (s.f.) YTD total net absorption (%) Direct vacancy (%) Total vacancy (%) Average direct asking rent ($ p.s.f.) YTD completions (s.f.) Under construction (s.f.) CBD Totals 18,928,135 -268,932 -362,728 -1.9% 14.0% 15.9% $26.55 0 50,000 Fringe Totals 7,708,658 -144,962 -233,439 -3.0% 14.6% 17.6% $23.42 105,000 187,500 Oakland/East End Totals 2,057,856 65,841 115,278 5.6% 5.5% 5.6% $32.70 64,500 0 Urban Totals 28,694,649 -348,053 -480,889 -1.7% 13.6% 15.6% $25.84 169,500 237,500 North Totals 3,624,734 3,614 -94,712 -2.6% 11.7% 12.3% $21.44 45,000 103,000 Northern I-79/Cranberry Totals 3,442,781 50,950 173,028 5.0% 9.9% 11.5% $24.03 0 133,774 East Totals 3,045,135 41,054 91,934 3.0% 31.1% 33.0% $20.38 0 0 South Totals 2,347,259 -20,815 -51,191 -2.2% 13.3% 15.7% $20.86 80,000 0 Southpointe Totals 2,972,107 5,515 -22,431 -0.8% 19.6% 27.0% $22.51 0 0 West Totals 7,002,426 -41,522 97,075 1.4% 19.0% 20.5% $21.10 0 0 Suburban Totals 22,434,442 38,796 193,703 0.9% 17.6% 19.8% $21.37 125,000 236,774 Pittsburgh Totals 51,129,091 -309,257 -287,186 -0.6% 15.3% 17.5% $23.46 294,500 474,274 CBD A 13,102,880 -260,674 -158,092 -1.2% 11.3% 13.2% $29.61 0 50,000 Fringe A 2,087,970 -153,346 -82,658 -4.0% 3.7% 14.1% $24.89 105,000 0 Oakland/East End A 969,243 7,785 55,012 5.7% 8.0% 8.4% $34.71 64,500 0 Urban A 16,160,093 -406,235 -185,738 -1.1% 10.1% 13.0% $29.68 169,500 50,000 North A 786,347 18,394 -25,104 -3.2% 9.5% 11.6% $24.45 45,000 103,000 Northern I-79/Cranberry A 2,766,249 5,711 57,059 2.1% 9.7% 11.6% $24.50 0 44,700 East A 1,580,784 820 70,538 4.5% 28.4% 29.7% $22.15 0 0 South A 0 0 0 0.0% 0.0% 0.0% $0.00 0 0 Southpointe A 1,909,754 -8,216 -34,214 -1.8% 10.6% 20.9% $23.34 0 0 West A 3,767,504 -41,054 15,969 0.4% 16.7% 19.2% $22.69 0 0 Suburban A 10,810,638 -24,345 84,248 0.8% 15.0% 18.5% $23.21 45,000 147,700 Pittsburgh A 26,970,731 -430,580 -101,490 -0.4% 12.1% 15.2% $26.35 214,500 197,700 CBD B 5,825,255 -8,258 -204,636 -3.5% 20.2% 22.1% $22.25 0 0 Fringe B 5,620,688 8,384 -150,781 -2.7% 18.7% 18.9% $23.32 0 187,500 Oakland/East End B 1,088,613 58,056 60,266 5.5% 3.2% 3.2% $23.61 0 0 Urban B 12,534,556 58,182 -295,151 -2.4% 18.0% 19.0% $22.77 0 187,500 North B 2,838,387 -14,780 -69,608 -2.5% 12.3% 12.4% $19.02 0 0 Northern I-79/Cranberry B 676,532 45,239 115,969 17.1% 11.1% 11.1% $22.28 0 89,074 East B 1,464,351 40,234 21,396 1.5% 33.9% 36.6% $18.79 0 0 South B 2,347,259 -20,815 -51,191 -2.2% 13.3% 15.7% $20.86 80,000 0 Southpointe B 1,062,353 13,731 11,783 1.1% 35.8% 37.8% $22.06 0 0 West B 3,234,922 -468 81,106 2.5% 21.7% 21.9% $19.58 0 0 Suburban B 11,623,804 63,141 109,455 0.9% 19.9% 21.0% $20.08 80,000 89,074 Pittsburgh B 24,158,360 121,323 -185,696 -0.8% 18.9% 20.0% $21.30 80,000 276,574