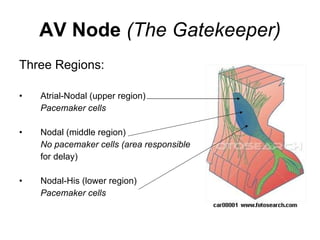
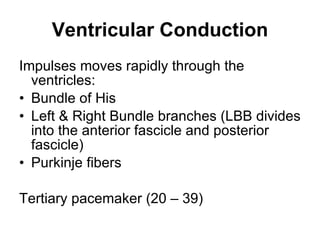
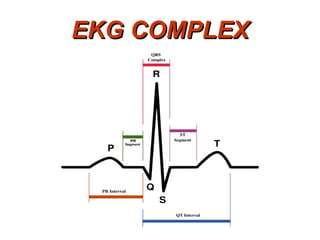
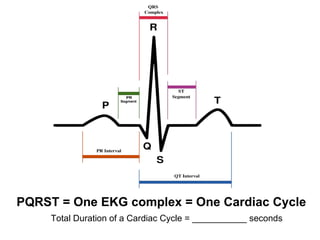
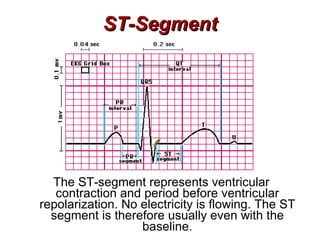
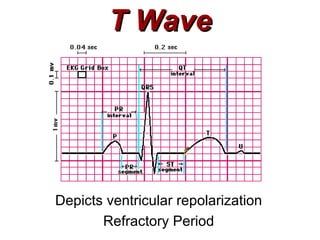
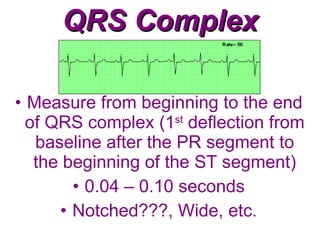
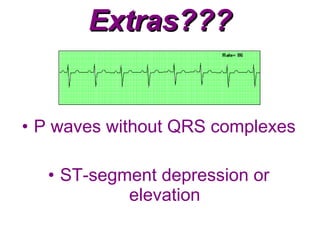
Basic Arrhythmias Interpretation Cardiac Electrophysiology Natalie Bermudez, RN, BSN, MS Clinical Educator for Telemetry
Myocardial Cardiac Cell Types P Cells  Pacemaker cells Responsible for generation of action potentials  electrical activity Cardiomyocytes Myocardial Cells Contractile cells that generate force Mechanical activity
Cardiac Cell Activity Electrical activity  ALWAYS  precedes mechanical activity Electrical activity can occur  without  a mechanical response (i.e. pulse). This is known as  pulseless electrical activity  (PEA).
Primary Characteristics of Cardiac Cells Automaticity Excitability Conductivity Contractility ECG Workout Textbook: p. 10
Is it  GOOD  or  BAD ??? ALL  ELECTRICAL CARDIAC CELLS ARE CAPABLE OF AUTOMATICITY!!! IRRITABILITY!!! Automaticity It is definitely REALLY GOOD THING!! But it can also be a  REALLY BAD THING!!
Electrolytes and Cardiac Cells Electrolyte solution surrounds cardiac cells K +  primary intracellular ion Na +  primary extracellular ion Ready State: Inside of the cell  more negative Cell stimulated; membrane permeability changes
Polarization Depolarization   Repolarization Electrical Activity at the Cellular Level
Cardiac Action Potential As cardiac cells reverse polarity, the electrical  impulse generated during that event creates an energy stimulus that travels across the cell membrane High-speed, self-producing current (heart only)
Slow-Response Cells SA node & AV node  Spontaneously depolarize slowly Shorter, non-prominent  plateau phase  with slower repolarization period
Fast-Response Cells Purkinje cells and working myocardial cells Rapid depolarization Then, a period of sustained depolarization –  plateau phase
Phases of Action Potential Phase 0  Cellular depolarization is initiated as + ions enter the cell (Na +  and Ca ++ ) Working cells rapidly depolarize as Na +  enters the cells through Na +  fast channels (fast response) SA/AV node depolarize as Ca ++  enters the cell through Ca ++  slow channels (slow-response)
Phases of Action Potential Phase 1  Small, early, rapid repolarization as K +  exits the intracellular space Phase 2 The plateau phase as Ca ++  ions enter the intracellular space
Phases of Action Potential Phase 3  Completion of repolarization and return of cell to resting state Phase 4 Resting phase before the next depolarization (Na +  out, K +  in)
 
POLARIZATION Electrical charges are balanced and ready for discharge.
The discharge of energy that accompanies the transfer of electrical charges across the membrane. The process of electrical discharge and flow of electrical activity. An electrical event that can be recorded on an EKG or rhythm strip. DEPOLARIZATION
The return of electrical charges across the cell membrane. REPOLARIZATION
Refractory Period Absolute:  The brief period during repolarization when the cell  CAN’T  respond to any stimulus, no matter how strong. *Relative:  The brief period during repolarization when excitability is depressed. If stimulated, the cell may respond, but a stronger than usual stimulus is required. Supernormal:  The cells will respond to a weaker than normal stimulus (this period occurs just before the cells have completely repolarized)
What is an EKG? Think of it as a map that shows the road traveled by an electrical impulse Each waveform indicates the location of the electrical impulse and if has traveled through that location “normally”
Isoelectric Line & Waveforms Isoelectric Line:  electrically neutral baseline of an EKG complex. Waveform : any part of the EKG tracing that moves away from & returns to the isoelectric line (baseline)
Deflections Deflection:   a waveform on an EKG strip that denotes electrical activity; may be positive (upright) and/or negative (downward). Monophasic or Biphasic See Overhead slide 1-0
Positive & Negative Poles Electrical activity that travels towards a positive pole appears upright on an EKG appears and is called a  positive deflection . Electrical activity that travels towards a negative pole appears inverted (downward) on an EKG and is called a  negative deflection
Positive & Negative Poles See Overhead Slide 1-1
Cardiac Monitors Electrodes, Poles, Wires, Leads, and Electrode Placement
Five-Leadwire System
Electrode Pad Placement Electrode An electrode pad is the medium through electrical activity is registered/recorded Proper placement of the electrode pad is the most important step in obtaining a good quality and accurate EKG tracing  An EKG lead provides a view of the heart’s electrical activity between two points or poles (one positive & one negative) The EKG waveforms are recorded via an electrode/wire system – i.e.  five-leadwire system
Poles & Lead II Lead II consists of the following electrode placement: Right Limb Lead (negative pole): the 2 nd  intercostal space on the right  Left Limb Lead (positive pole): the 8 th  intercostal space on the left Grounding Lead: 8 th  intercostal space to the right
LEAD II Lead II is used alone quite frequently. Normal rhythms present with a prominent P wave and a tall QRS.
Irritability versus Escape Irritability  – a site that speeds up and takes over as the pacemaker. Escape  – when the normal pacemaker slows down or fails and a lower site assumes pace making responsibility.  Either of these may exist as a beat or rhythm!
More EKG Terminology Focus, Ectopy, Aberrancy, Artifact
Important Terminology Focus  -  The starting point of an electrical impulse Ectopic  – An impulse that originates from a focus other than the primary pacemaker.
Aberrancy Aberrancy   – abnormal conduction of an electrical impulse Aberrant Ventricular Conduction  – An impulse that originates from the SA node, atria, or AV junction that is abnormally conducted through the ventricles producing a wider than normal QRS complex:  a.k.a “aberrancy”
Artifact Electrical activity displayed on graph paper that is superimposed on cardiac tracings, interfering with interpretation of the rhythm. Can be caused by outside electrical soures, muscle tremors, patient movement; also called interference.     
Cardiac Electrophysiology The Electrical Conduction Pathway
Nervous System Stimulation Sympathetic Nervous System:  causes an increase in heart rate, increase in AV conduction , and increase in ventricular contractility The increase is caused a release of norepinephrine (catecholamine/neurotransmitter)
Nervous System Stimulation Parasympathetic Nervous System:  (from the vagus nerve) causes a slowing of the heart rate, a decrease in AV conduction, and a slight decrease in ventricular contractility The decrease is caused a release of acetylcholine (catecholamine/neurotransmitter)
Pacemaker Pacemaker  – the SA node is the natural/normal pacemaker of the heart. Latent Pacemaker Cells  – Cells in the electrical conduction system located below the SA node with the property of automaticity These cells hold the property of automaticity in reserve in case the SA node fails to function properly or electrical impulses fail to be conducted. a.k.a. –  Subsidiary pacemaker cells
The Electrical Conduction Pathway
SA Node ie. Sinoatrial Node or Sinus Node Posesses the highest level of automaticity SA Node is the primary pacemaker of the heart If it fails to fire or slows down less than its inherent firing rate (60 – 100), another pacemaker that is lower in the conduction system will take over
AV Node   (The Gatekeeper) Three main functions: Slows conduction to allow time for the atria to contract & empty its contents (atrial kick) before the ventricles contract Secondary pacemaker (40 – 59 bpm) Blocks some of the impulses from being conducted to the ventricles when atrial rate is rapid
AV Node   (The Gatekeeper) Three Regions: Atrial-Nodal (upper region) Pacemaker cells Nodal (middle region) No pacemaker cells (area responsible for delay) Nodal-His (lower region) Pacemaker cells
Ventricular Conduction Impulses moves rapidly through the ventricles: Bundle of His Left & Right Bundle branches (LBB divides into the anterior fascicle and posterior fascicle) Purkinje fibers Tertiary pacemaker (20 – 39)
EKG COMPLEX
PQRST = One EKG complex = One Cardiac Cycle Total Duration of a Cardiac Cycle = ___________ seconds
P Wave Depicts the firing of the SA node and atrial depolarization (contraction). P waves are upright & rounded (in Lead II). Precedes a QRS Both atria depolarize simultaneously.
P Wave Abnormalities p mitrale  =  Wide & Notched P wave  ______________________________________________________________________ p pulmonale   = Tall, peaked P wave ________________________________________________________________________
PR Segment The PR segment represents delay in the AV node Flat = Baseline
QRS Complex Depicts the electrical impulse traveling through the ventricles and ventricular depolarization (contraction). Not all QRS complexes have a Q, R, and S.
QRS Complex Q wave  is the FIRST negative deflection  R wave  is the FIRST positive deflection S wave  is the negative deflection that follows the R wave J Point  is the point where the QRS complex ends See Overhead Slide 1-3
QRS Complex Variations Overhead Slide 1-2
ST-Segment The ST-segment represents ventricular contraction and period before ventricular repolarization. No electricity is flowing. The ST segment is therefore usually even with the baseline.
ST-Segment Elevation & Depression To be considered a significant elevation or depression the ST must deviate at least 1 mm above or below the baseline (in at least 2 or more correlating leads)
ST-Segment Depression Most often seen with acute myocardial ischemia Other Causes: Left and right ventricular hypertrophy Left and Right BBB Hypokalemia Drug Effects (i.e. digitalis)
ST-Segment Elevation Most often seen with acute myocardial injury or infarction Other Causes: Coronary vasospasm (Prinzmetal’s Angina) Pericarditis Ventricular Aneurysm Hyperkalemia Early repolarization (a normal variant)
T Wave Depicts ventricular repolarization Refractory Period
T Waves Positive Deflection  (above baseline < 5 mm) Should appear rounded and symmetrical Peak is closer to the end of the wave
Elevated T Waves Positive Deflection  (above baseline  >  5 mm) Tall, peaked (tented) HYPERKALEMIA  or MYOCARDIAL INJURY
Inverted T Waves Negative Deflection  (below baseline) Causes: Myocardial Ischemia Myocardial Infarction Pericarditis Ventricular Enlargement Bundle Branch Block Subarachnoid Hemorrhage Certain Drugs (quinidine or procainamide)
U Wave Depicts last phase of ventricular repolarization or endocardial repolarization???
U Wave U Wave < 2 mm Seen most commonly with BRADYCARDIC rate Can cause inaccuracies when measuring QT intervals
U Wave U Wave < 2 mm Large = hypokalemia, cardiomyopathy, LV enlargement Some drugs may cause a large U wave May cause Torsades de Pointes
Atrial Repolarization ??? Hidden beneath the QRS complex.
 
EKG Graph Paper
Waveform Measurements
PR Interval Measurement: 0.12 – 0.20 seconds Represents the time from SA node firing to the end of AV node delay
PRI Abnormalities Prolonged or Inconsistent PRI’s may indicate a type of heart block: 1 st  degree AVB Mobitz 1 or Mobitz 2 Complete AVB
PRI Abnormalities Shortened or Nonexistent PRI’s may indicate: Tachycardic Rhythms  WPW Syndrome Junctional Rhythms Ectopic Atrial Rhythms Ventricular Rhythms
PRI Abnormalities See Overhead Slide 1-4
PR Interval PRI= PRI=
QRS Duration Measurement: 0.04 – 0.10 seconds Represents the travel time of electrical activity through the ventricles
QRS Complex Variations Wide and/or notched QRS complexes:  - BBB’s  - Aberrant ventricular  conductivity - Rhythms with Ventricular Focus
Aberrant QRS Complex See Overhead Slide 1-5
QRS Duration QRS= QRS=
QT Interval Measurement: < ½ the distance of the preceding R-R interval Represents travel time through ventricles to the end of ventricular repolarization Normally varies according to age, sex, and particularly heart rate
QT Rate Corrected HR  ↑  = QT interval  ↓   HR  ↓  = QT interval  ↑   QTc =  QT + 1.75 (ventricular rate – 60)
QT Interval QT= QTc= QT= QTc=
Prolonged QT Intervals Represents a prolonged time to repolarization May lead to  R-on-T Phenomenon and ventricular dysrhythmias!!!
Basics to Interpreting Strips Rhythm Rate P Wave PR Interval (PRI) QRS Duration
RHYTHM Determine regularity or irregularity Use calipers for accuracy Measure distance from R-R wave Regular Rhythm  = R-R distance does not vary (less than 3 small boxes of variation does not count) Irregular Rhythm  = R-R distance varies (3 small small boxes or greater)
HEART RATE Use 1500-rule and the 6-second rule for all  regular  rhythms 6-second rule only for  irregular  rhythms
Calculating Heart Rates The 6-Second Rule The Rule of 300’s The 1500 Rule
6-Second Strip Count number of R waves in a 6-second strip and multiply by 10 A.K.A. Rapid Rate Calculation HR = # R waves x 10 Not very accurate Used only for very quick estimate
Rule of 300’s Count number of large squares between 2 consecutive R waves and divide into 300. HR = 300 / # large squares Very quick Used only with regular rhythms Not very accurate with fast rates
Rule of 300’s Scale of 300 1 large square = 300 bpm 2 large squares = 150 bpm 3 large squares = 100 bpm 4 large squares = 75 bpm 5 large squares = 60 bpm 6 large squares = 50 bpm
1500 Rule Count number of small squares between 2 consecutive R waves and divide into 1500 A.K.A. – Precise Rate Calculation Most accurate Used only with regular rhythms Time-consuming
P Waves Upright Uniform Precedes each QRS complex Any extra P waves
PRI Measure from beginning of P wave to the end of the PR segment 0.12 – 0.20 seconds Constant
QRS Complex Measure from beginning to the end of QRS complex (1 st  deflection from baseline after the PR segment to the beginning of the ST segment) 0.04 – 0.10 seconds Notched???, Wide, etc.
QT Interval or QTc QT Interval = Count the # of small boxes from beginning QRS complex to the end of the T wave. Should be less than ½ the distance of the preceding  R-R interval QTc  =  QT + 1.75 (ventricular rate – 60)
Extras??? P waves without QRS complexes ST-segment depression or elevation
 
References Chernecky, C., et al. (2002).  Real world nursing survival guide: ECG’s & the heart.  United States of America: W. B. Saunders Company. Garcia, T. B., & Holtz, N. E. (2001).  12-lead ecg: The art of interpretation.  Sudbury, MA: Jones and Bartlett Publishers. Huff, J. (2006).  ECG workout: Exercises in arrhythmia interpretation  (5 th  ed.). United States of America: Lippincott, Williams & Wilkins. Smeltzer, S. C., et al. (2008).  Brunner and suddarth’s testbook of medical-surgical nursing,  (11 th  ed.). Philadelphia, PA: Lippincott, Williams & Wilkins. Walraven, G. (1999).  Basic arrhythmias  (5 th  ed.). United States of America: Prentice-Hall, Inc. Woods, S. L., et al. (2005).  Cardiac nursing,  (5 th  ed.). Philadelphia, PA: Lippincott, Williams & Wilkins. www.madsci.com/manu/ekg_rhy.htm

Cardiac Electrophysiology

  • 1.
    Basic Arrhythmias InterpretationCardiac Electrophysiology Natalie Bermudez, RN, BSN, MS Clinical Educator for Telemetry
  • 2.
    Myocardial Cardiac CellTypes P Cells Pacemaker cells Responsible for generation of action potentials electrical activity Cardiomyocytes Myocardial Cells Contractile cells that generate force Mechanical activity
  • 3.
    Cardiac Cell ActivityElectrical activity ALWAYS precedes mechanical activity Electrical activity can occur without a mechanical response (i.e. pulse). This is known as pulseless electrical activity (PEA).
  • 4.
    Primary Characteristics ofCardiac Cells Automaticity Excitability Conductivity Contractility ECG Workout Textbook: p. 10
  • 5.
    Is it GOOD or BAD ??? ALL ELECTRICAL CARDIAC CELLS ARE CAPABLE OF AUTOMATICITY!!! IRRITABILITY!!! Automaticity It is definitely REALLY GOOD THING!! But it can also be a REALLY BAD THING!!
  • 6.
    Electrolytes and CardiacCells Electrolyte solution surrounds cardiac cells K + primary intracellular ion Na + primary extracellular ion Ready State: Inside of the cell more negative Cell stimulated; membrane permeability changes
  • 7.
    Polarization Depolarization Repolarization Electrical Activity at the Cellular Level
  • 8.
    Cardiac Action PotentialAs cardiac cells reverse polarity, the electrical impulse generated during that event creates an energy stimulus that travels across the cell membrane High-speed, self-producing current (heart only)
  • 9.
    Slow-Response Cells SAnode & AV node Spontaneously depolarize slowly Shorter, non-prominent plateau phase with slower repolarization period
  • 10.
    Fast-Response Cells Purkinjecells and working myocardial cells Rapid depolarization Then, a period of sustained depolarization – plateau phase
  • 11.
    Phases of ActionPotential Phase 0 Cellular depolarization is initiated as + ions enter the cell (Na + and Ca ++ ) Working cells rapidly depolarize as Na + enters the cells through Na + fast channels (fast response) SA/AV node depolarize as Ca ++ enters the cell through Ca ++ slow channels (slow-response)
  • 12.
    Phases of ActionPotential Phase 1 Small, early, rapid repolarization as K + exits the intracellular space Phase 2 The plateau phase as Ca ++ ions enter the intracellular space
  • 13.
    Phases of ActionPotential Phase 3 Completion of repolarization and return of cell to resting state Phase 4 Resting phase before the next depolarization (Na + out, K + in)
  • 14.
  • 15.
    POLARIZATION Electrical chargesare balanced and ready for discharge.
  • 16.
    The discharge ofenergy that accompanies the transfer of electrical charges across the membrane. The process of electrical discharge and flow of electrical activity. An electrical event that can be recorded on an EKG or rhythm strip. DEPOLARIZATION
  • 17.
    The return ofelectrical charges across the cell membrane. REPOLARIZATION
  • 18.
    Refractory Period Absolute: The brief period during repolarization when the cell CAN’T respond to any stimulus, no matter how strong. *Relative: The brief period during repolarization when excitability is depressed. If stimulated, the cell may respond, but a stronger than usual stimulus is required. Supernormal: The cells will respond to a weaker than normal stimulus (this period occurs just before the cells have completely repolarized)
  • 19.
    What is anEKG? Think of it as a map that shows the road traveled by an electrical impulse Each waveform indicates the location of the electrical impulse and if has traveled through that location “normally”
  • 20.
    Isoelectric Line &Waveforms Isoelectric Line: electrically neutral baseline of an EKG complex. Waveform : any part of the EKG tracing that moves away from & returns to the isoelectric line (baseline)
  • 21.
    Deflections Deflection: a waveform on an EKG strip that denotes electrical activity; may be positive (upright) and/or negative (downward). Monophasic or Biphasic See Overhead slide 1-0
  • 22.
    Positive & NegativePoles Electrical activity that travels towards a positive pole appears upright on an EKG appears and is called a positive deflection . Electrical activity that travels towards a negative pole appears inverted (downward) on an EKG and is called a negative deflection
  • 23.
    Positive & NegativePoles See Overhead Slide 1-1
  • 24.
    Cardiac Monitors Electrodes,Poles, Wires, Leads, and Electrode Placement
  • 25.
  • 26.
    Electrode Pad PlacementElectrode An electrode pad is the medium through electrical activity is registered/recorded Proper placement of the electrode pad is the most important step in obtaining a good quality and accurate EKG tracing An EKG lead provides a view of the heart’s electrical activity between two points or poles (one positive & one negative) The EKG waveforms are recorded via an electrode/wire system – i.e. five-leadwire system
  • 27.
    Poles & LeadII Lead II consists of the following electrode placement: Right Limb Lead (negative pole): the 2 nd intercostal space on the right Left Limb Lead (positive pole): the 8 th intercostal space on the left Grounding Lead: 8 th intercostal space to the right
  • 28.
    LEAD II LeadII is used alone quite frequently. Normal rhythms present with a prominent P wave and a tall QRS.
  • 29.
    Irritability versus EscapeIrritability – a site that speeds up and takes over as the pacemaker. Escape – when the normal pacemaker slows down or fails and a lower site assumes pace making responsibility. Either of these may exist as a beat or rhythm!
  • 30.
    More EKG TerminologyFocus, Ectopy, Aberrancy, Artifact
  • 31.
    Important Terminology Focus - The starting point of an electrical impulse Ectopic – An impulse that originates from a focus other than the primary pacemaker.
  • 32.
    Aberrancy Aberrancy – abnormal conduction of an electrical impulse Aberrant Ventricular Conduction – An impulse that originates from the SA node, atria, or AV junction that is abnormally conducted through the ventricles producing a wider than normal QRS complex: a.k.a “aberrancy”
  • 33.
    Artifact Electrical activitydisplayed on graph paper that is superimposed on cardiac tracings, interfering with interpretation of the rhythm. Can be caused by outside electrical soures, muscle tremors, patient movement; also called interference.     
  • 34.
    Cardiac Electrophysiology TheElectrical Conduction Pathway
  • 35.
    Nervous System StimulationSympathetic Nervous System: causes an increase in heart rate, increase in AV conduction , and increase in ventricular contractility The increase is caused a release of norepinephrine (catecholamine/neurotransmitter)
  • 36.
    Nervous System StimulationParasympathetic Nervous System: (from the vagus nerve) causes a slowing of the heart rate, a decrease in AV conduction, and a slight decrease in ventricular contractility The decrease is caused a release of acetylcholine (catecholamine/neurotransmitter)
  • 37.
    Pacemaker Pacemaker – the SA node is the natural/normal pacemaker of the heart. Latent Pacemaker Cells – Cells in the electrical conduction system located below the SA node with the property of automaticity These cells hold the property of automaticity in reserve in case the SA node fails to function properly or electrical impulses fail to be conducted. a.k.a. – Subsidiary pacemaker cells
  • 38.
  • 39.
    SA Node ie.Sinoatrial Node or Sinus Node Posesses the highest level of automaticity SA Node is the primary pacemaker of the heart If it fails to fire or slows down less than its inherent firing rate (60 – 100), another pacemaker that is lower in the conduction system will take over
  • 40.
    AV Node (The Gatekeeper) Three main functions: Slows conduction to allow time for the atria to contract & empty its contents (atrial kick) before the ventricles contract Secondary pacemaker (40 – 59 bpm) Blocks some of the impulses from being conducted to the ventricles when atrial rate is rapid
  • 41.
    AV Node (The Gatekeeper) Three Regions: Atrial-Nodal (upper region) Pacemaker cells Nodal (middle region) No pacemaker cells (area responsible for delay) Nodal-His (lower region) Pacemaker cells
  • 42.
    Ventricular Conduction Impulsesmoves rapidly through the ventricles: Bundle of His Left & Right Bundle branches (LBB divides into the anterior fascicle and posterior fascicle) Purkinje fibers Tertiary pacemaker (20 – 39)
  • 43.
  • 44.
    PQRST = OneEKG complex = One Cardiac Cycle Total Duration of a Cardiac Cycle = ___________ seconds
  • 45.
    P Wave Depictsthe firing of the SA node and atrial depolarization (contraction). P waves are upright & rounded (in Lead II). Precedes a QRS Both atria depolarize simultaneously.
  • 46.
    P Wave Abnormalitiesp mitrale = Wide & Notched P wave ______________________________________________________________________ p pulmonale = Tall, peaked P wave ________________________________________________________________________
  • 47.
    PR Segment ThePR segment represents delay in the AV node Flat = Baseline
  • 48.
    QRS Complex Depictsthe electrical impulse traveling through the ventricles and ventricular depolarization (contraction). Not all QRS complexes have a Q, R, and S.
  • 49.
    QRS Complex Qwave is the FIRST negative deflection R wave is the FIRST positive deflection S wave is the negative deflection that follows the R wave J Point is the point where the QRS complex ends See Overhead Slide 1-3
  • 50.
    QRS Complex VariationsOverhead Slide 1-2
  • 51.
    ST-Segment The ST-segmentrepresents ventricular contraction and period before ventricular repolarization. No electricity is flowing. The ST segment is therefore usually even with the baseline.
  • 52.
    ST-Segment Elevation &Depression To be considered a significant elevation or depression the ST must deviate at least 1 mm above or below the baseline (in at least 2 or more correlating leads)
  • 53.
    ST-Segment Depression Mostoften seen with acute myocardial ischemia Other Causes: Left and right ventricular hypertrophy Left and Right BBB Hypokalemia Drug Effects (i.e. digitalis)
  • 54.
    ST-Segment Elevation Mostoften seen with acute myocardial injury or infarction Other Causes: Coronary vasospasm (Prinzmetal’s Angina) Pericarditis Ventricular Aneurysm Hyperkalemia Early repolarization (a normal variant)
  • 55.
    T Wave Depictsventricular repolarization Refractory Period
  • 56.
    T Waves PositiveDeflection (above baseline < 5 mm) Should appear rounded and symmetrical Peak is closer to the end of the wave
  • 57.
    Elevated T WavesPositive Deflection (above baseline > 5 mm) Tall, peaked (tented) HYPERKALEMIA or MYOCARDIAL INJURY
  • 58.
    Inverted T WavesNegative Deflection (below baseline) Causes: Myocardial Ischemia Myocardial Infarction Pericarditis Ventricular Enlargement Bundle Branch Block Subarachnoid Hemorrhage Certain Drugs (quinidine or procainamide)
  • 59.
    U Wave Depictslast phase of ventricular repolarization or endocardial repolarization???
  • 60.
    U Wave UWave < 2 mm Seen most commonly with BRADYCARDIC rate Can cause inaccuracies when measuring QT intervals
  • 61.
    U Wave UWave < 2 mm Large = hypokalemia, cardiomyopathy, LV enlargement Some drugs may cause a large U wave May cause Torsades de Pointes
  • 62.
    Atrial Repolarization ???Hidden beneath the QRS complex.
  • 63.
  • 64.
  • 65.
  • 66.
    PR Interval Measurement:0.12 – 0.20 seconds Represents the time from SA node firing to the end of AV node delay
  • 67.
    PRI Abnormalities Prolongedor Inconsistent PRI’s may indicate a type of heart block: 1 st degree AVB Mobitz 1 or Mobitz 2 Complete AVB
  • 68.
    PRI Abnormalities Shortenedor Nonexistent PRI’s may indicate: Tachycardic Rhythms WPW Syndrome Junctional Rhythms Ectopic Atrial Rhythms Ventricular Rhythms
  • 69.
    PRI Abnormalities SeeOverhead Slide 1-4
  • 70.
  • 71.
    QRS Duration Measurement:0.04 – 0.10 seconds Represents the travel time of electrical activity through the ventricles
  • 72.
    QRS Complex VariationsWide and/or notched QRS complexes: - BBB’s - Aberrant ventricular conductivity - Rhythms with Ventricular Focus
  • 73.
    Aberrant QRS ComplexSee Overhead Slide 1-5
  • 74.
  • 75.
    QT Interval Measurement:< ½ the distance of the preceding R-R interval Represents travel time through ventricles to the end of ventricular repolarization Normally varies according to age, sex, and particularly heart rate
  • 76.
    QT Rate CorrectedHR ↑ = QT interval ↓ HR ↓ = QT interval ↑ QTc = QT + 1.75 (ventricular rate – 60)
  • 77.
    QT Interval QT=QTc= QT= QTc=
  • 78.
    Prolonged QT IntervalsRepresents a prolonged time to repolarization May lead to R-on-T Phenomenon and ventricular dysrhythmias!!!
  • 79.
    Basics to InterpretingStrips Rhythm Rate P Wave PR Interval (PRI) QRS Duration
  • 80.
    RHYTHM Determine regularityor irregularity Use calipers for accuracy Measure distance from R-R wave Regular Rhythm = R-R distance does not vary (less than 3 small boxes of variation does not count) Irregular Rhythm = R-R distance varies (3 small small boxes or greater)
  • 81.
    HEART RATE Use1500-rule and the 6-second rule for all regular rhythms 6-second rule only for irregular rhythms
  • 82.
    Calculating Heart RatesThe 6-Second Rule The Rule of 300’s The 1500 Rule
  • 83.
    6-Second Strip Countnumber of R waves in a 6-second strip and multiply by 10 A.K.A. Rapid Rate Calculation HR = # R waves x 10 Not very accurate Used only for very quick estimate
  • 84.
    Rule of 300’sCount number of large squares between 2 consecutive R waves and divide into 300. HR = 300 / # large squares Very quick Used only with regular rhythms Not very accurate with fast rates
  • 85.
    Rule of 300’sScale of 300 1 large square = 300 bpm 2 large squares = 150 bpm 3 large squares = 100 bpm 4 large squares = 75 bpm 5 large squares = 60 bpm 6 large squares = 50 bpm
  • 86.
    1500 Rule Countnumber of small squares between 2 consecutive R waves and divide into 1500 A.K.A. – Precise Rate Calculation Most accurate Used only with regular rhythms Time-consuming
  • 87.
    P Waves UprightUniform Precedes each QRS complex Any extra P waves
  • 88.
    PRI Measure frombeginning of P wave to the end of the PR segment 0.12 – 0.20 seconds Constant
  • 89.
    QRS Complex Measurefrom beginning to the end of QRS complex (1 st deflection from baseline after the PR segment to the beginning of the ST segment) 0.04 – 0.10 seconds Notched???, Wide, etc.
  • 90.
    QT Interval orQTc QT Interval = Count the # of small boxes from beginning QRS complex to the end of the T wave. Should be less than ½ the distance of the preceding R-R interval QTc = QT + 1.75 (ventricular rate – 60)
  • 91.
    Extras??? P waveswithout QRS complexes ST-segment depression or elevation
  • 92.
  • 93.
    References Chernecky, C.,et al. (2002). Real world nursing survival guide: ECG’s & the heart. United States of America: W. B. Saunders Company. Garcia, T. B., & Holtz, N. E. (2001). 12-lead ecg: The art of interpretation. Sudbury, MA: Jones and Bartlett Publishers. Huff, J. (2006). ECG workout: Exercises in arrhythmia interpretation (5 th ed.). United States of America: Lippincott, Williams & Wilkins. Smeltzer, S. C., et al. (2008). Brunner and suddarth’s testbook of medical-surgical nursing, (11 th ed.). Philadelphia, PA: Lippincott, Williams & Wilkins. Walraven, G. (1999). Basic arrhythmias (5 th ed.). United States of America: Prentice-Hall, Inc. Woods, S. L., et al. (2005). Cardiac nursing, (5 th ed.). Philadelphia, PA: Lippincott, Williams & Wilkins. www.madsci.com/manu/ekg_rhy.htm