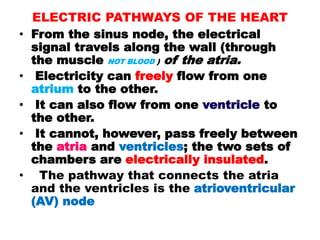
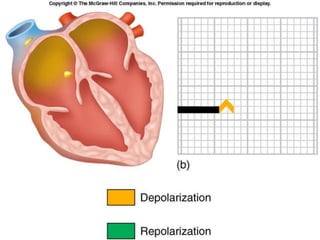
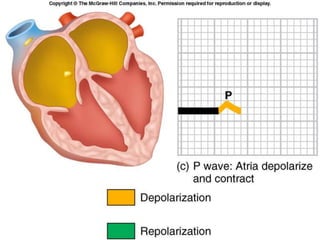
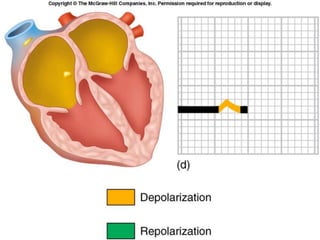
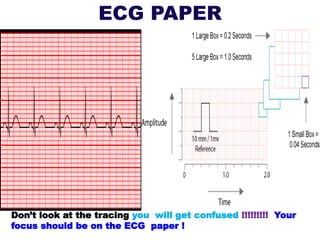
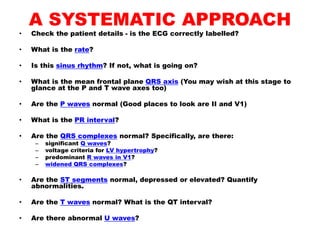
EASY WAY TO UNDERSTAND
ELECTROCARDIOGRAPH
(ECG OR EKG)
Daniel M.I. Alliangana , M.Phil.
Department of medical Physiology
School of Medicine
College of Health Sciences
Moi University
His restrictive covenant was more restrictive than
sweetheart had originally thought.
Comic Relief
Hope you will read your ECG more carefully and
understand than the medical student read bitterheart’s
Easter Card message.
OUT
THE
DOCTOR
IS
EINTHOVEN
• In the late 1800's and the early
1900's, a man named Willem
Einthoven pioneered the practice of
electrocardiography.
• He developed a machine that was
sensitive enough to reliably measure
electrical differences between two
different parts of the body.
• Plotting the values measured over
time gave a picture of the electrical
activity of the human heart.
WHAT IS ECG(EKG)?
• IS the Instrument that records the electrical activity
of the heart (measures electrical potentials on the
body surface)
• It generates a record of the electrical currents
associated with heart muscle activity
MAIN USE
- detection and diagnosis of heart
abnormalities
• Electrocardiograph is the instrument
• Electrocardiogram is the record of that activity
( electrical activity of the heart on paper (chart).
CONFUSSIUS
• ECGs can be very confusing, and there
are dozens of different methods of
interpretation.
• BEFORE YOU GET CONFUSED HOW ECG
WORKS
• LET’S UNDERSTAND THE HEART’S
CONDUCTION SYSTEM FIRST.
A FIRECRACKER REPRESENTING THE
HEART'S ELECTRICAL SYSTEMT
THE CONDUCTION SYSTEM
CONDUCTION AND CONTRACTION
FUNCTION
• Sinus (SA) node - conduction only
• Atria muscle - conduction and
contraction
• Atrioventricular (AV) node -
conduction only
• Bundle of His - conduction only
• Bundle branches - conduction only
• Purkinje fibers - conduction only
• Ventricular muscle - conduction
and contraction
ELECTRIC PATHWAYS OF THE HEART
• From the sinus node, the electrical
signal travels along the wall (through
the muscle NOT BLOOD ) of the atria.
• Electricity can freely flow from one
atrium to the other.
• It can also flow from one ventricle to
the other.
• It cannot, however, pass freely between
the atria and ventricles; the two sets of
chambers are electrically insulated.
• The pathway that connects the atria
and the ventricles is the atrioventricular
(AV) node
ELECTRIC PATHWAYS OF THE HEART
• Starts in the sinus node
• Travels through the atria by (possibly) a combination of
regular muscle cells and specialized conduction cells. The
impulse should cover the entire wall of the atria
• Travels through the AV node (specialized conduction cells)
• Travels through the AV bundle ( the bundle of His,
specialized conduction cells)
• Splits between the left and right bundle branches
(specialized conduction cells)
• Enters various Purkinje fibers (specialized conduction cells)
• Finally Reaches the ventricular muscle cells
VOLUME CONDUCTOR
• When cell membranes in the heart
depolarize, voltages change and
currents flow.
• A human can be regarded as a bag
of salt water (with very baaad
attitude), in other words, a volume
conductor,
• Changes in potential are
transmitted throughout the body,
and can be measured.
HEART DEPOLARISATION
• When the heart depolarizes, it's
convenient (and fairly accurate) to
represent the electrical activity
as a dipole --- a vector between
two point charges.
• Remember that a vector has both
a size (magnitude), and a
direction
TWO CHAMBERED HEART
• The normal heart has electrically
speaking, only two chambers, an atrial
and a ventricular `chamber'.
• Propagation of electrical activity
spreads freely within atria and
ventricles, but communication between
these two chambers is limited to the AV
node.
• Everyone knows that the P wave
corresponds to atrial depolarization, the
QRS complex to ventricular
depolarization, and the T wave to
repolarization of the ventricle.
MYOCARDIAL ACTIVITY
• In order to be able to record
myocardial activity, the
electrocardiograph needs to be able to
detect tiny changes in potential on the
body surface.
• These are signals that are often
around 1mV, and may be smaller.
• In addition, we need some reference
point to which we can relate the
potential changes.
ELECTRICAL CARDIAC CYCLE
SUMMARY
ECG PAPER
Don’t look at the tracing you will get confused !!!!!!!!! Your
focus should be on the ECG paper !
ECG PAPER
Heart Rate :- 1500
----------------------------------
Number of small squares between
R—R Interval
Time :- 25mm per 1 second.
1mm = 1/25 second
1mm = 1 small square = 0.04 seconds
Amplitude :- 10 Divisions = 10mm = 1mv
Standard calibration
25 mm/s
0.1 mV/mm
We use the number 1500 because
there are 1500 small squares in a
minute
ECG WAVES
• Each electrical stimulus takes the form of a wave and so patterns emerge
made up of a number of connected waves.
• A standard ECG is printed at 25mm per second or 25 small squares per second
• In this way it is possible to calculate the duration of individual waves and their
intervals.
A normal ECG contains waves,
intervals, segments, and one
complex
ECG WAVES
• The direction in which the waves point
- indicates whether electricity is moving towards or
away from a particular lead.
• The general direction in which electricity
- normally travels through the heart is a downward
diagonal line from the right shoulder to the left lower
abdomen.
• This is because
- the electrical stimulus originates in the SA node
(upper right side of the heart)
- travels through the AV node and bundle of His, and
finishes mainly in the left ventricle.
(remember that there is more conduction in the left
ventricle).
• So different leads may have waves pointing in different
directions
ECG WAVES
Electrical impulse(wave of depolarization moving towards the
positive end of the electrode ) that travels towards the electrode
produces an upright (“positive”) deflection relative to the
isoelectric baseline
Eg. lead V6 (mid-left axilla, 5th intercostal space), will
always see the electrical stimulus coming towards it and
therefore the waves expressed in V6 for sinus rhythm,
PQRST, will always be point upwards.
ECG WAVES
• Electrical impulse that travels away
from the electrode produces a
downward (“negative”) deflection
relative to the isoelectric baseline
Eg. Lead AVR (right shoulder/right arm/wrist) will always see the electrical
stimulus travelling away from it, therefore the waves expressed in AVR for
sinus rhythm, PQRST, will all point downwards.
The P wave
• Occurs when the SA node creates an action potential that depolarizes the
atria.
• The P wave should be upright in lead II if the action potential is originating
from the SA node.
• If this is so, the ECG is said to demonstrate a "normal sinus rhythm"
abbreviated "NSR".
• As long as the atrial depolarization is able to spread through the AV node
to the ventricles, each P wave should be followed by a QRS complex.
The QRS complex
• Comes after the P wave when the SA nodal action potential travels
through the AV node to the ventricles to cause ventricular
depolarization.
• The first downward deflection is called the Q wave.
• The first upward deflection is called the R wave.
• The second downward deflection is called the S wave.
The T wave
• Occurs after the QRS complex and is a result of ventricular
repolarization.
• T waves should be upright in most leads (except aVR and V1).
• T waves should be asymmetric in nature.
• The second portion of the T wave should have a steeper decline
when compared to the incline of the first part of the T wave.
• If the T wave appears symmetric, cardiac pathology may be
present.
The U wave
• It is possible to see another wave after the PQRST
complex.
• This is known as a U wave.
• It is not very common and is easy to overlook.
U waves are indicated by the arrows
An interval
• Is the distance between two specific ECG events.
For example:
PR Interval (PRI):
The time from the beginning of the P wave (atrial
depolarization) to the beginning of the QRS
complex (ventricular depolarization).
A prolonged or shortened PR interval can indicate
certain disease states.
QT interval
• The time from the beginning of the
QRS complex (ventricular
depolarization) to the end of the T
wave (ventricular repolarization).
• QT interval prolongation can be very
serious.
In practice, the Q-T interval is expressed as a "corrected Q-T (QTc)" by
taking the Q-T interval and dividing it by the square root of the R-R
interval .
This allows an assessment of the Q-T interval that is independent of heart
rate. Normal corrected Q-Tc intervals are less than 0.44 seconds.
ECG LEADS
Leads are electrodes which measure the
difference in electrical potential between
either:
1. Two different points on the body (bipolar
leads)
2. One point on the body and a virtual
reference point with zero electrical
potential, located in the center of the heart
(unipolar leads)
ELECTRODE PLACEMENT
LIMB LEADS
made up of 4 leads placed on the extremities:
left and right wrist
left and right ankle.
The lead connected to the right ankle is a neutral lead, like
you would find in an electric plug.
It is there to complete an electrical circuit and plays no role
in the ECG itself.
• Bipolar leads
I II III
• Augment leads
Avr Avl Avf
Einthoven’s triangle
• The 2 leads situated on the right and left wrist (or shoulders), AVR
and AVL respectively, and the lead situated on the left ankle (or left
lower abdomen) AVf, make up a triangle, known as "Einthoven’s
Triangle".
• Information gathered between these leads is known as "bipolar".
• It is represented on the ECG as 3 "bipolar" leads.
• information between AVr and AVl is known as lead l.
• Information between AVr and AVf is known as lead ll
• Information between AVl and AVf is known as lead lll
Types of ECG Recordings
• Bipolar leads record voltage
between electrodes placed
on wrists & legs (right leg is
ground)
• Lead I records between right
arm & left arm
• Lead II: right arm & left leg
• Lead III: left arm & left leg
13-61
CREATION OF THE 6 VERTICAL
LEADS
• The three bipolar leads (I, II
and III) are calculated from
the differences between
points on Eindhoven's triangle.
• This creates the 6 vertical
leads:
AXIS
• The peculiar system used in electrocardiography
is non-Cartesian, and rather arbitrary!
• We measure the direction of vectors in degrees.
• zero is indeed facing `East', but +90o is South,
instead of North as it would be in a Cartesian
system.
• You can work out that ± 180o is 'West', and that
minus 90o is 'North'.
Standard Limb Leads
Augmented Limb Leads
All Limb Leads
AXIS
• We can talk about the `axis' of any ECG depolarization, but
most people when talking about the 'axis' refer to the mean
frontal plane QRS axis.
• There is a number of ways of determining this, but the
following method has the merit of simplicity:
1. Estimate the overall deflection (positive or negative, and how
much) of the QRS in standard lead I;
2. Do the same for AVF;
3. Plot the vector on a system of axes, and estimate the angle,
thus:
Note in the above picture that the (abnormal) axis illustrated is
negative ("towards the left") because AVF is negative.
(There are several other causes of left or right axis deviation, for
example depolarization via accessory pathways
CHEST LEADS
6 UNIPOLAR LEADS
V1,V2, V3,V4, V5, V6
The chest electrodes are labelled “V” and are numbered
from 1 to 6.
The placement of these electrodes
• The placement of these electrodes needs to be exact to give the optimum
information as possible.
• If the electrodes are placed incorrectly on the chest, the tracing will reveal
duplication of some information, while other areas will not be represented
properly.
• Incorrect placement of the electrodes can
lead to serious errors of interpretation.
• There are six chest leads: V1, V2,V3,V4, V5 and V6.
• V1 At the fourth intercostal space, at the right margin of the sternum
• V2 At the fourth intercostal space, at the left margin of the sternum
• V3 Midway between the position of leads V2 and V4 (in a straight line)
• V4 At the fifth intercostals space at the junction of the left midclavicular
line
• V5 Midway between the position of leads V4 and V6 (straight down from the
axillary Line on the same horizontal position as V4 and V6)
• V6 At the horizontal position of V4, at the left of the midaxillary line.
The standard ECG has 12 leads
With 12 leads, we need to know which regions of the heart each lead is looking at
and what groups they make up.
- AVL is on the left wrist or shoulder and looks at the upper left side
of the heart.
- Lead l travels towards AVL creating a second high lateral lead.
- AVf is on the left ankle or left lower abdomen and looks at the
bottom, or inferior wall, of the heart.
- Lead ll travels from AVr towards AVf to become a 2nd inferior lead
- Lead lll travels from AVL towards AVf to become a 3rd inferior lead.
- V2 V3 and V4 look at the front of the heart and are the anterior leads.
- V1 is often ignored but if changes occur in V1 and V2 only, these leads are
referred to as Septal leads.
- V5 and V6 look at the left side of the heart and are the lateral leads.
- Next slide shows the ECG where these leads are when printed.
3 Standard Limb Leads
3 Augmented Limb Leads
6 Precordial Leads
ECG with regions of the heart highlighted
BASIC INTERPRETATION OF
THE ECG (EKG)
• Sit back and look - identify the patterns,
and write down what you see!
• Go through the ECG systematically;
• Correlate ECG and clinical findings, and
if necessary, go back and do a complete
rethink;
• Try and invalidate your assessment ---
look for holes!
A SYSTEMATIC APPROACH
• Check the patient details - is the ECG correctly labelled?
• What is the rate?
• Is this sinus rhythm? If not, what is going on?
• What is the mean frontal plane QRS axis (You may wish at this stage to
glance at the P and T wave axes too)
• Are the P waves normal (Good places to look are II and V1)
• What is the PR interval?
• Are the QRS complexes normal? Specifically, are there:
– significant Q waves?
– voltage criteria for LV hypertrophy?
– predominant R waves in V1?
– widened QRS complexes?
• Are the ST segments normal, depressed or elevated? Quantify
abnormalities.
• Are the T waves normal? What is the QT interval?
• Are there abnormal U waves?
THANKYOU
WISHING YOU THE BEST IN
INTERPRETING YOUR ECG
SCRIBLES
ADIOS!!!!!

ecg made easy ecocadiograph interpretation

  • 1.
    EASY WAY TOUNDERSTAND ELECTROCARDIOGRAPH (ECG OR EKG) Daniel M.I. Alliangana , M.Phil. Department of medical Physiology School of Medicine College of Health Sciences Moi University
  • 2.
    His restrictive covenantwas more restrictive than sweetheart had originally thought. Comic Relief Hope you will read your ECG more carefully and understand than the medical student read bitterheart’s Easter Card message. OUT THE DOCTOR IS
  • 3.
    EINTHOVEN • In thelate 1800's and the early 1900's, a man named Willem Einthoven pioneered the practice of electrocardiography. • He developed a machine that was sensitive enough to reliably measure electrical differences between two different parts of the body. • Plotting the values measured over time gave a picture of the electrical activity of the human heart.
  • 4.
    WHAT IS ECG(EKG)? •IS the Instrument that records the electrical activity of the heart (measures electrical potentials on the body surface) • It generates a record of the electrical currents associated with heart muscle activity MAIN USE - detection and diagnosis of heart abnormalities • Electrocardiograph is the instrument • Electrocardiogram is the record of that activity ( electrical activity of the heart on paper (chart).
  • 5.
    CONFUSSIUS • ECGs canbe very confusing, and there are dozens of different methods of interpretation. • BEFORE YOU GET CONFUSED HOW ECG WORKS • LET’S UNDERSTAND THE HEART’S CONDUCTION SYSTEM FIRST.
  • 6.
    A FIRECRACKER REPRESENTINGTHE HEART'S ELECTRICAL SYSTEMT
  • 7.
  • 8.
    CONDUCTION AND CONTRACTION FUNCTION •Sinus (SA) node - conduction only • Atria muscle - conduction and contraction • Atrioventricular (AV) node - conduction only • Bundle of His - conduction only • Bundle branches - conduction only • Purkinje fibers - conduction only • Ventricular muscle - conduction and contraction
  • 9.
    ELECTRIC PATHWAYS OFTHE HEART • From the sinus node, the electrical signal travels along the wall (through the muscle NOT BLOOD ) of the atria. • Electricity can freely flow from one atrium to the other. • It can also flow from one ventricle to the other. • It cannot, however, pass freely between the atria and ventricles; the two sets of chambers are electrically insulated. • The pathway that connects the atria and the ventricles is the atrioventricular (AV) node
  • 10.
    ELECTRIC PATHWAYS OFTHE HEART • Starts in the sinus node • Travels through the atria by (possibly) a combination of regular muscle cells and specialized conduction cells. The impulse should cover the entire wall of the atria • Travels through the AV node (specialized conduction cells) • Travels through the AV bundle ( the bundle of His, specialized conduction cells) • Splits between the left and right bundle branches (specialized conduction cells) • Enters various Purkinje fibers (specialized conduction cells) • Finally Reaches the ventricular muscle cells
  • 11.
    VOLUME CONDUCTOR • Whencell membranes in the heart depolarize, voltages change and currents flow. • A human can be regarded as a bag of salt water (with very baaad attitude), in other words, a volume conductor, • Changes in potential are transmitted throughout the body, and can be measured.
  • 12.
    HEART DEPOLARISATION • Whenthe heart depolarizes, it's convenient (and fairly accurate) to represent the electrical activity as a dipole --- a vector between two point charges. • Remember that a vector has both a size (magnitude), and a direction
  • 13.
    TWO CHAMBERED HEART •The normal heart has electrically speaking, only two chambers, an atrial and a ventricular `chamber'. • Propagation of electrical activity spreads freely within atria and ventricles, but communication between these two chambers is limited to the AV node. • Everyone knows that the P wave corresponds to atrial depolarization, the QRS complex to ventricular depolarization, and the T wave to repolarization of the ventricle.
  • 14.
    MYOCARDIAL ACTIVITY • Inorder to be able to record myocardial activity, the electrocardiograph needs to be able to detect tiny changes in potential on the body surface. • These are signals that are often around 1mV, and may be smaller. • In addition, we need some reference point to which we can relate the potential changes.
  • 15.
  • 20.
    ECG PAPER Don’t lookat the tracing you will get confused !!!!!!!!! Your focus should be on the ECG paper !
  • 21.
  • 22.
    Heart Rate :-1500 ---------------------------------- Number of small squares between R—R Interval Time :- 25mm per 1 second. 1mm = 1/25 second 1mm = 1 small square = 0.04 seconds Amplitude :- 10 Divisions = 10mm = 1mv Standard calibration 25 mm/s 0.1 mV/mm We use the number 1500 because there are 1500 small squares in a minute
  • 23.
    ECG WAVES • Eachelectrical stimulus takes the form of a wave and so patterns emerge made up of a number of connected waves. • A standard ECG is printed at 25mm per second or 25 small squares per second • In this way it is possible to calculate the duration of individual waves and their intervals. A normal ECG contains waves, intervals, segments, and one complex
  • 24.
    ECG WAVES • Thedirection in which the waves point - indicates whether electricity is moving towards or away from a particular lead. • The general direction in which electricity - normally travels through the heart is a downward diagonal line from the right shoulder to the left lower abdomen. • This is because - the electrical stimulus originates in the SA node (upper right side of the heart) - travels through the AV node and bundle of His, and finishes mainly in the left ventricle. (remember that there is more conduction in the left ventricle). • So different leads may have waves pointing in different directions
  • 25.
    ECG WAVES Electrical impulse(waveof depolarization moving towards the positive end of the electrode ) that travels towards the electrode produces an upright (“positive”) deflection relative to the isoelectric baseline Eg. lead V6 (mid-left axilla, 5th intercostal space), will always see the electrical stimulus coming towards it and therefore the waves expressed in V6 for sinus rhythm, PQRST, will always be point upwards.
  • 26.
    ECG WAVES • Electricalimpulse that travels away from the electrode produces a downward (“negative”) deflection relative to the isoelectric baseline Eg. Lead AVR (right shoulder/right arm/wrist) will always see the electrical stimulus travelling away from it, therefore the waves expressed in AVR for sinus rhythm, PQRST, will all point downwards.
  • 27.
    The P wave •Occurs when the SA node creates an action potential that depolarizes the atria. • The P wave should be upright in lead II if the action potential is originating from the SA node. • If this is so, the ECG is said to demonstrate a "normal sinus rhythm" abbreviated "NSR". • As long as the atrial depolarization is able to spread through the AV node to the ventricles, each P wave should be followed by a QRS complex.
  • 28.
    The QRS complex •Comes after the P wave when the SA nodal action potential travels through the AV node to the ventricles to cause ventricular depolarization. • The first downward deflection is called the Q wave. • The first upward deflection is called the R wave. • The second downward deflection is called the S wave.
  • 29.
    The T wave •Occurs after the QRS complex and is a result of ventricular repolarization. • T waves should be upright in most leads (except aVR and V1). • T waves should be asymmetric in nature. • The second portion of the T wave should have a steeper decline when compared to the incline of the first part of the T wave. • If the T wave appears symmetric, cardiac pathology may be present.
  • 30.
    The U wave •It is possible to see another wave after the PQRST complex. • This is known as a U wave. • It is not very common and is easy to overlook. U waves are indicated by the arrows
  • 31.
    An interval • Isthe distance between two specific ECG events. For example: PR Interval (PRI): The time from the beginning of the P wave (atrial depolarization) to the beginning of the QRS complex (ventricular depolarization). A prolonged or shortened PR interval can indicate certain disease states.
  • 32.
    QT interval • Thetime from the beginning of the QRS complex (ventricular depolarization) to the end of the T wave (ventricular repolarization). • QT interval prolongation can be very serious.
  • 33.
    In practice, theQ-T interval is expressed as a "corrected Q-T (QTc)" by taking the Q-T interval and dividing it by the square root of the R-R interval . This allows an assessment of the Q-T interval that is independent of heart rate. Normal corrected Q-Tc intervals are less than 0.44 seconds.
  • 34.
    ECG LEADS Leads areelectrodes which measure the difference in electrical potential between either: 1. Two different points on the body (bipolar leads) 2. One point on the body and a virtual reference point with zero electrical potential, located in the center of the heart (unipolar leads)
  • 35.
    ELECTRODE PLACEMENT LIMB LEADS madeup of 4 leads placed on the extremities: left and right wrist left and right ankle. The lead connected to the right ankle is a neutral lead, like you would find in an electric plug. It is there to complete an electrical circuit and plays no role in the ECG itself. • Bipolar leads I II III • Augment leads Avr Avl Avf
  • 36.
    Einthoven’s triangle • The2 leads situated on the right and left wrist (or shoulders), AVR and AVL respectively, and the lead situated on the left ankle (or left lower abdomen) AVf, make up a triangle, known as "Einthoven’s Triangle". • Information gathered between these leads is known as "bipolar". • It is represented on the ECG as 3 "bipolar" leads. • information between AVr and AVl is known as lead l. • Information between AVr and AVf is known as lead ll • Information between AVl and AVf is known as lead lll
  • 37.
    Types of ECGRecordings • Bipolar leads record voltage between electrodes placed on wrists & legs (right leg is ground) • Lead I records between right arm & left arm • Lead II: right arm & left leg • Lead III: left arm & left leg 13-61
  • 38.
    CREATION OF THE6 VERTICAL LEADS • The three bipolar leads (I, II and III) are calculated from the differences between points on Eindhoven's triangle. • This creates the 6 vertical leads:
  • 39.
    AXIS • The peculiarsystem used in electrocardiography is non-Cartesian, and rather arbitrary! • We measure the direction of vectors in degrees. • zero is indeed facing `East', but +90o is South, instead of North as it would be in a Cartesian system. • You can work out that ± 180o is 'West', and that minus 90o is 'North'.
  • 40.
  • 41.
  • 42.
  • 43.
    AXIS • We cantalk about the `axis' of any ECG depolarization, but most people when talking about the 'axis' refer to the mean frontal plane QRS axis. • There is a number of ways of determining this, but the following method has the merit of simplicity: 1. Estimate the overall deflection (positive or negative, and how much) of the QRS in standard lead I; 2. Do the same for AVF; 3. Plot the vector on a system of axes, and estimate the angle, thus: Note in the above picture that the (abnormal) axis illustrated is negative ("towards the left") because AVF is negative. (There are several other causes of left or right axis deviation, for example depolarization via accessory pathways
  • 44.
    CHEST LEADS 6 UNIPOLARLEADS V1,V2, V3,V4, V5, V6 The chest electrodes are labelled “V” and are numbered from 1 to 6.
  • 45.
    The placement ofthese electrodes • The placement of these electrodes needs to be exact to give the optimum information as possible. • If the electrodes are placed incorrectly on the chest, the tracing will reveal duplication of some information, while other areas will not be represented properly. • Incorrect placement of the electrodes can lead to serious errors of interpretation. • There are six chest leads: V1, V2,V3,V4, V5 and V6. • V1 At the fourth intercostal space, at the right margin of the sternum • V2 At the fourth intercostal space, at the left margin of the sternum • V3 Midway between the position of leads V2 and V4 (in a straight line) • V4 At the fifth intercostals space at the junction of the left midclavicular line • V5 Midway between the position of leads V4 and V6 (straight down from the axillary Line on the same horizontal position as V4 and V6) • V6 At the horizontal position of V4, at the left of the midaxillary line.
  • 46.
    The standard ECGhas 12 leads With 12 leads, we need to know which regions of the heart each lead is looking at and what groups they make up. - AVL is on the left wrist or shoulder and looks at the upper left side of the heart. - Lead l travels towards AVL creating a second high lateral lead. - AVf is on the left ankle or left lower abdomen and looks at the bottom, or inferior wall, of the heart. - Lead ll travels from AVr towards AVf to become a 2nd inferior lead - Lead lll travels from AVL towards AVf to become a 3rd inferior lead. - V2 V3 and V4 look at the front of the heart and are the anterior leads. - V1 is often ignored but if changes occur in V1 and V2 only, these leads are referred to as Septal leads. - V5 and V6 look at the left side of the heart and are the lateral leads. - Next slide shows the ECG where these leads are when printed. 3 Standard Limb Leads 3 Augmented Limb Leads 6 Precordial Leads
  • 47.
    ECG with regionsof the heart highlighted
  • 48.
    BASIC INTERPRETATION OF THEECG (EKG) • Sit back and look - identify the patterns, and write down what you see! • Go through the ECG systematically; • Correlate ECG and clinical findings, and if necessary, go back and do a complete rethink; • Try and invalidate your assessment --- look for holes!
  • 49.
    A SYSTEMATIC APPROACH •Check the patient details - is the ECG correctly labelled? • What is the rate? • Is this sinus rhythm? If not, what is going on? • What is the mean frontal plane QRS axis (You may wish at this stage to glance at the P and T wave axes too) • Are the P waves normal (Good places to look are II and V1) • What is the PR interval? • Are the QRS complexes normal? Specifically, are there: – significant Q waves? – voltage criteria for LV hypertrophy? – predominant R waves in V1? – widened QRS complexes? • Are the ST segments normal, depressed or elevated? Quantify abnormalities. • Are the T waves normal? What is the QT interval? • Are there abnormal U waves?
  • 50.
    THANKYOU WISHING YOU THEBEST IN INTERPRETING YOUR ECG SCRIBLES ADIOS!!!!!