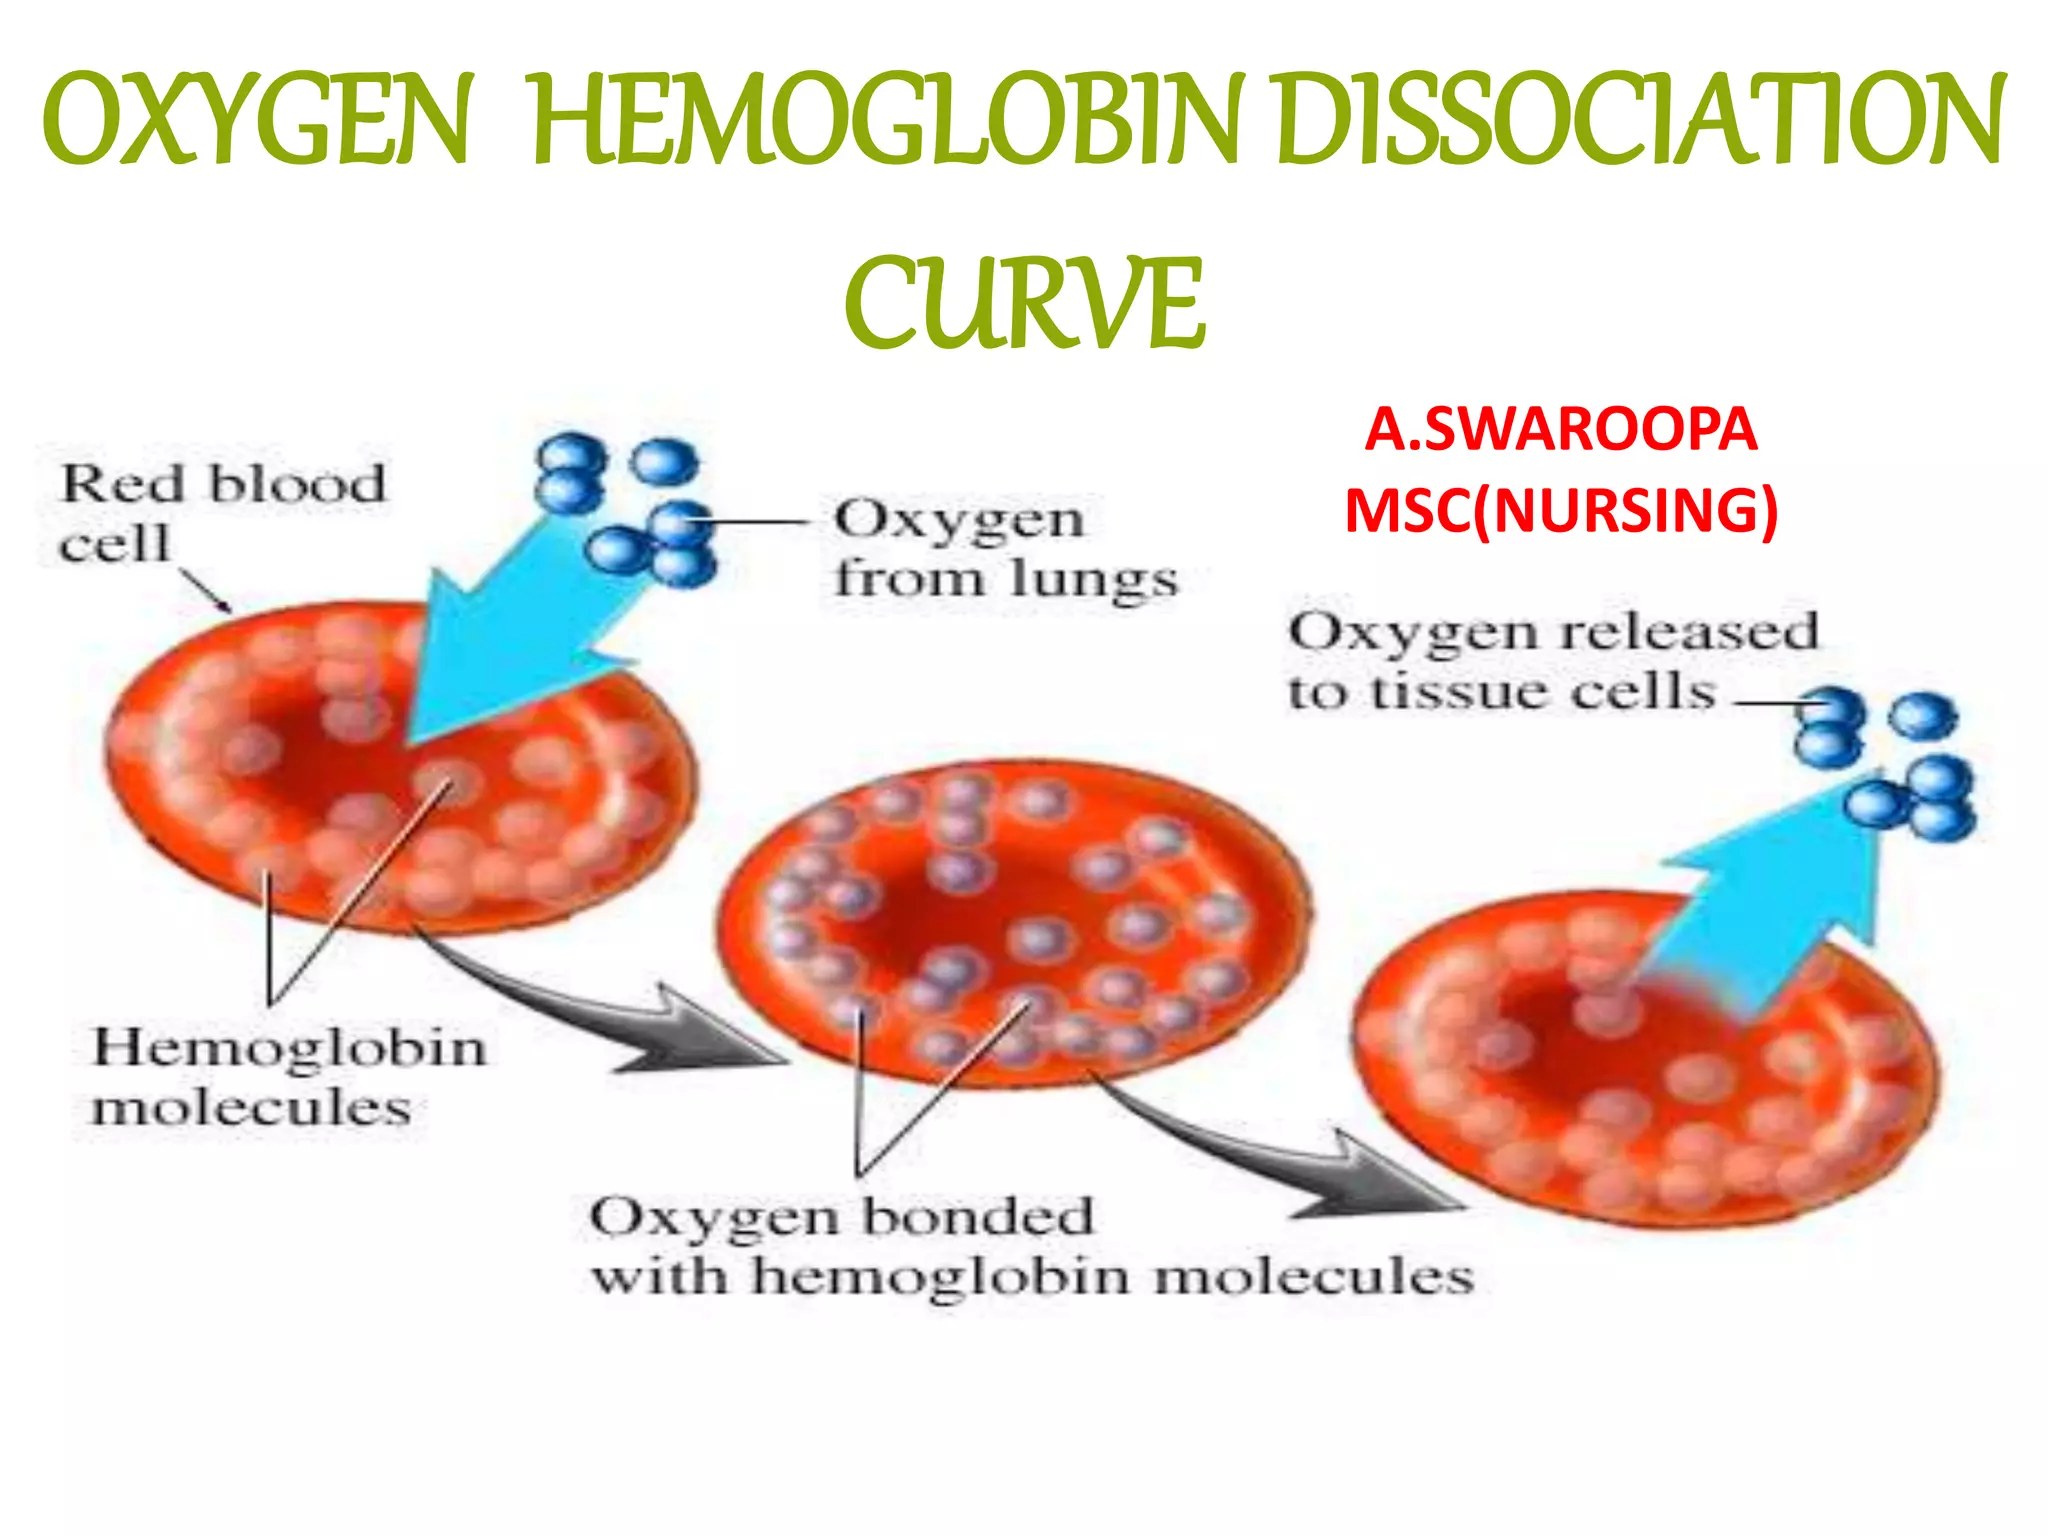
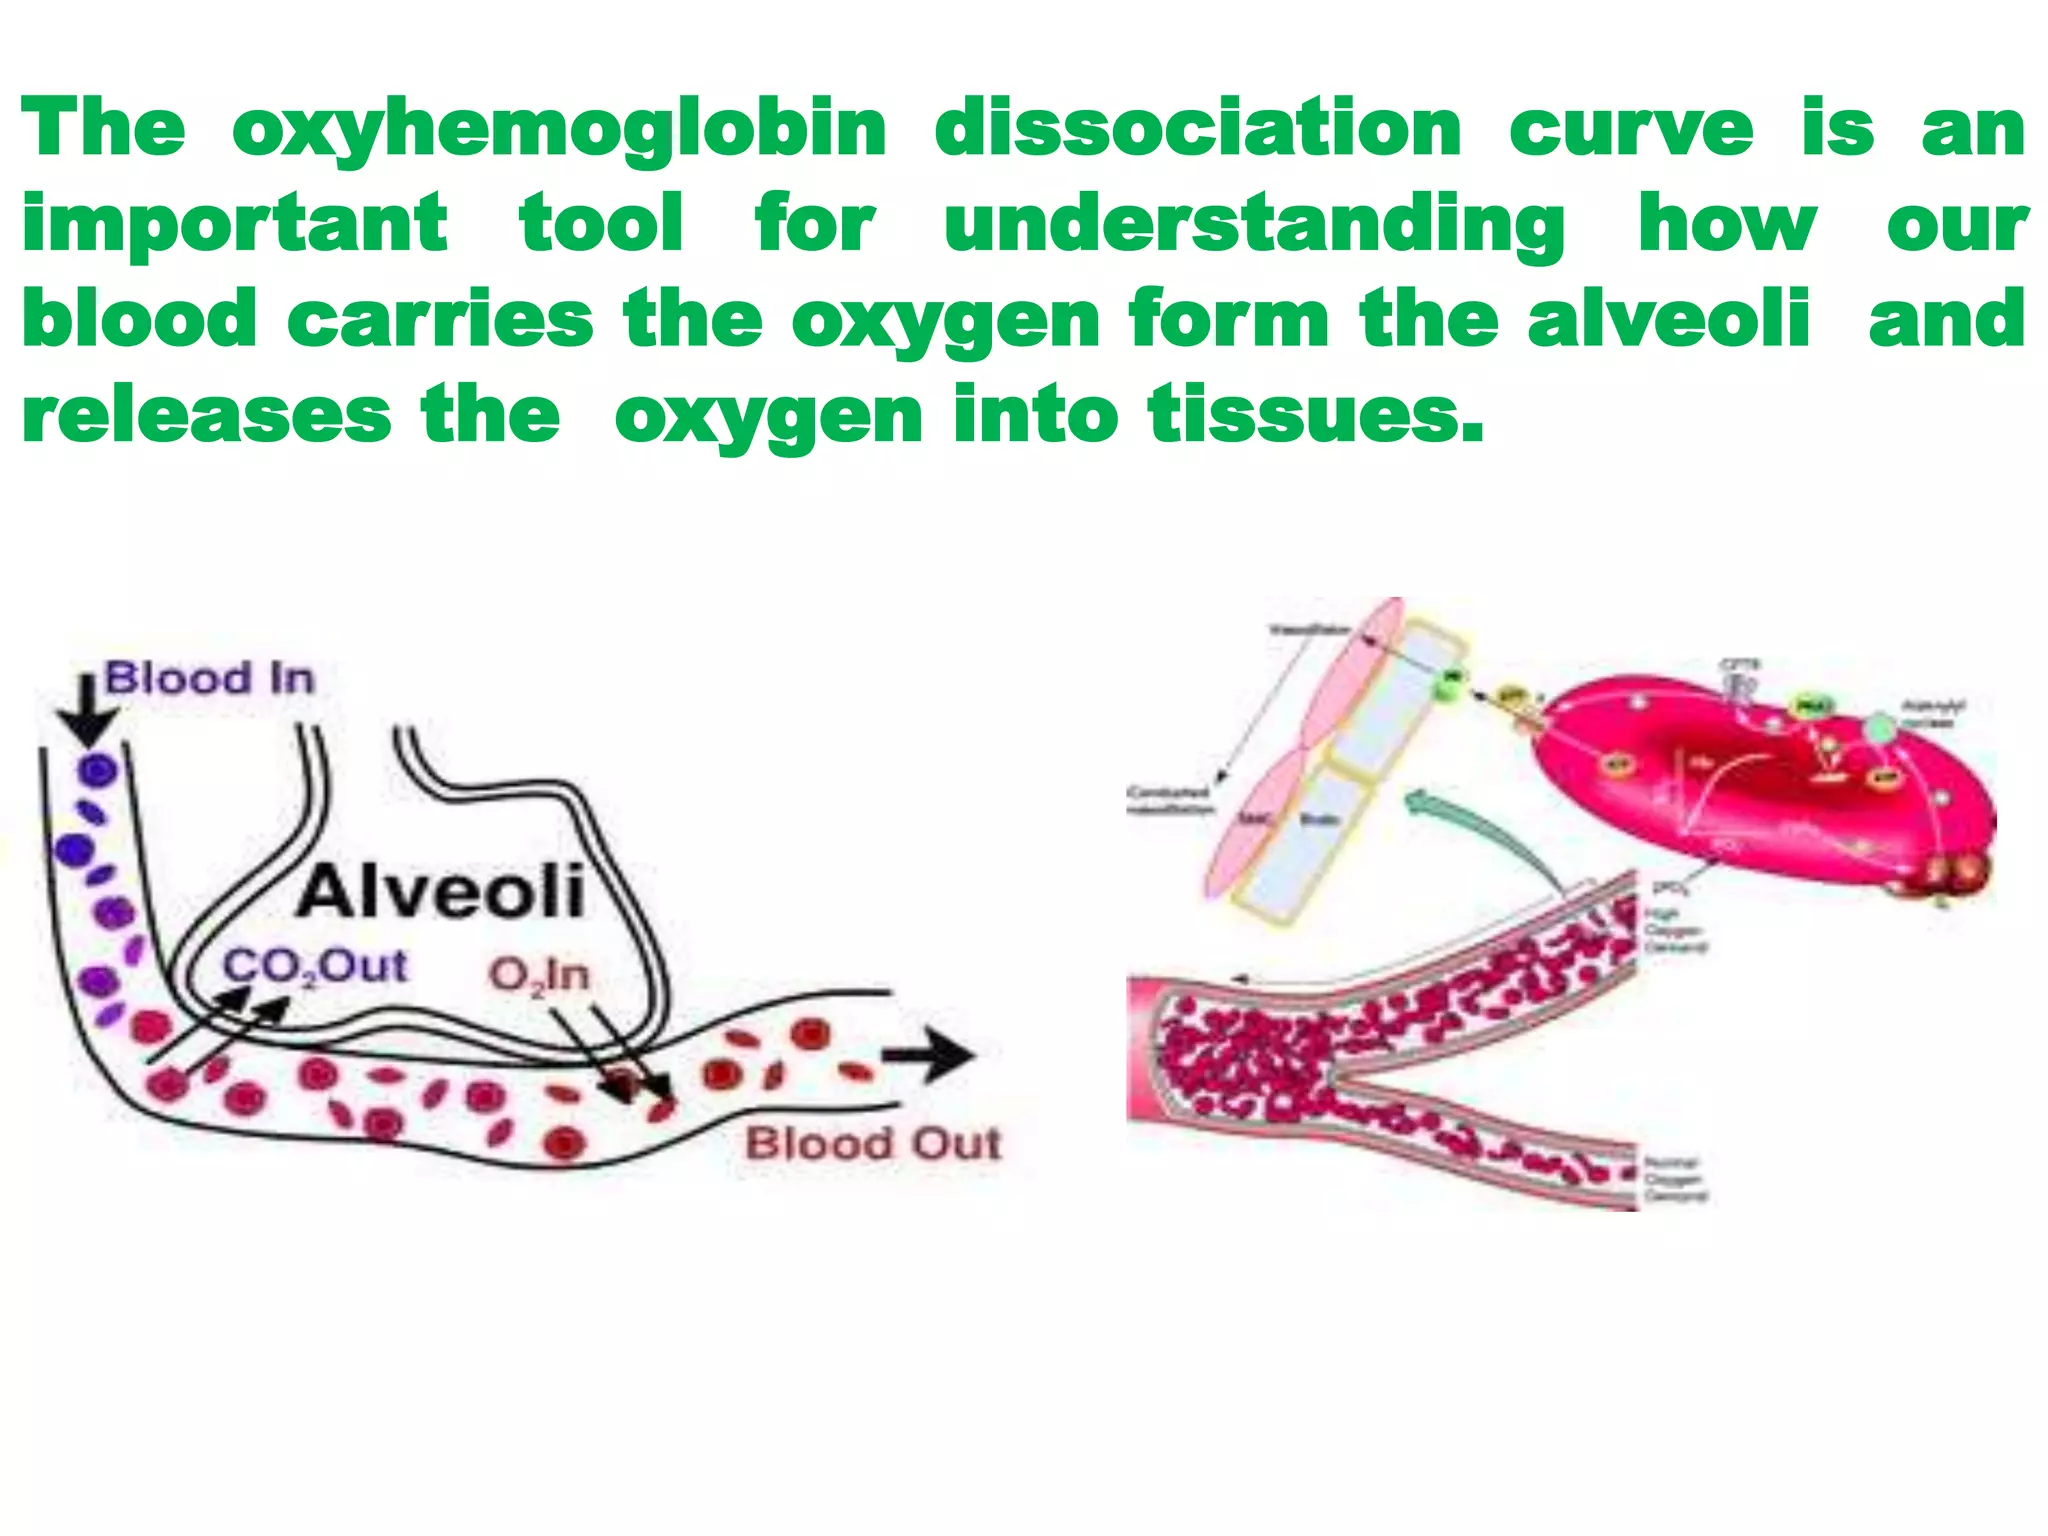
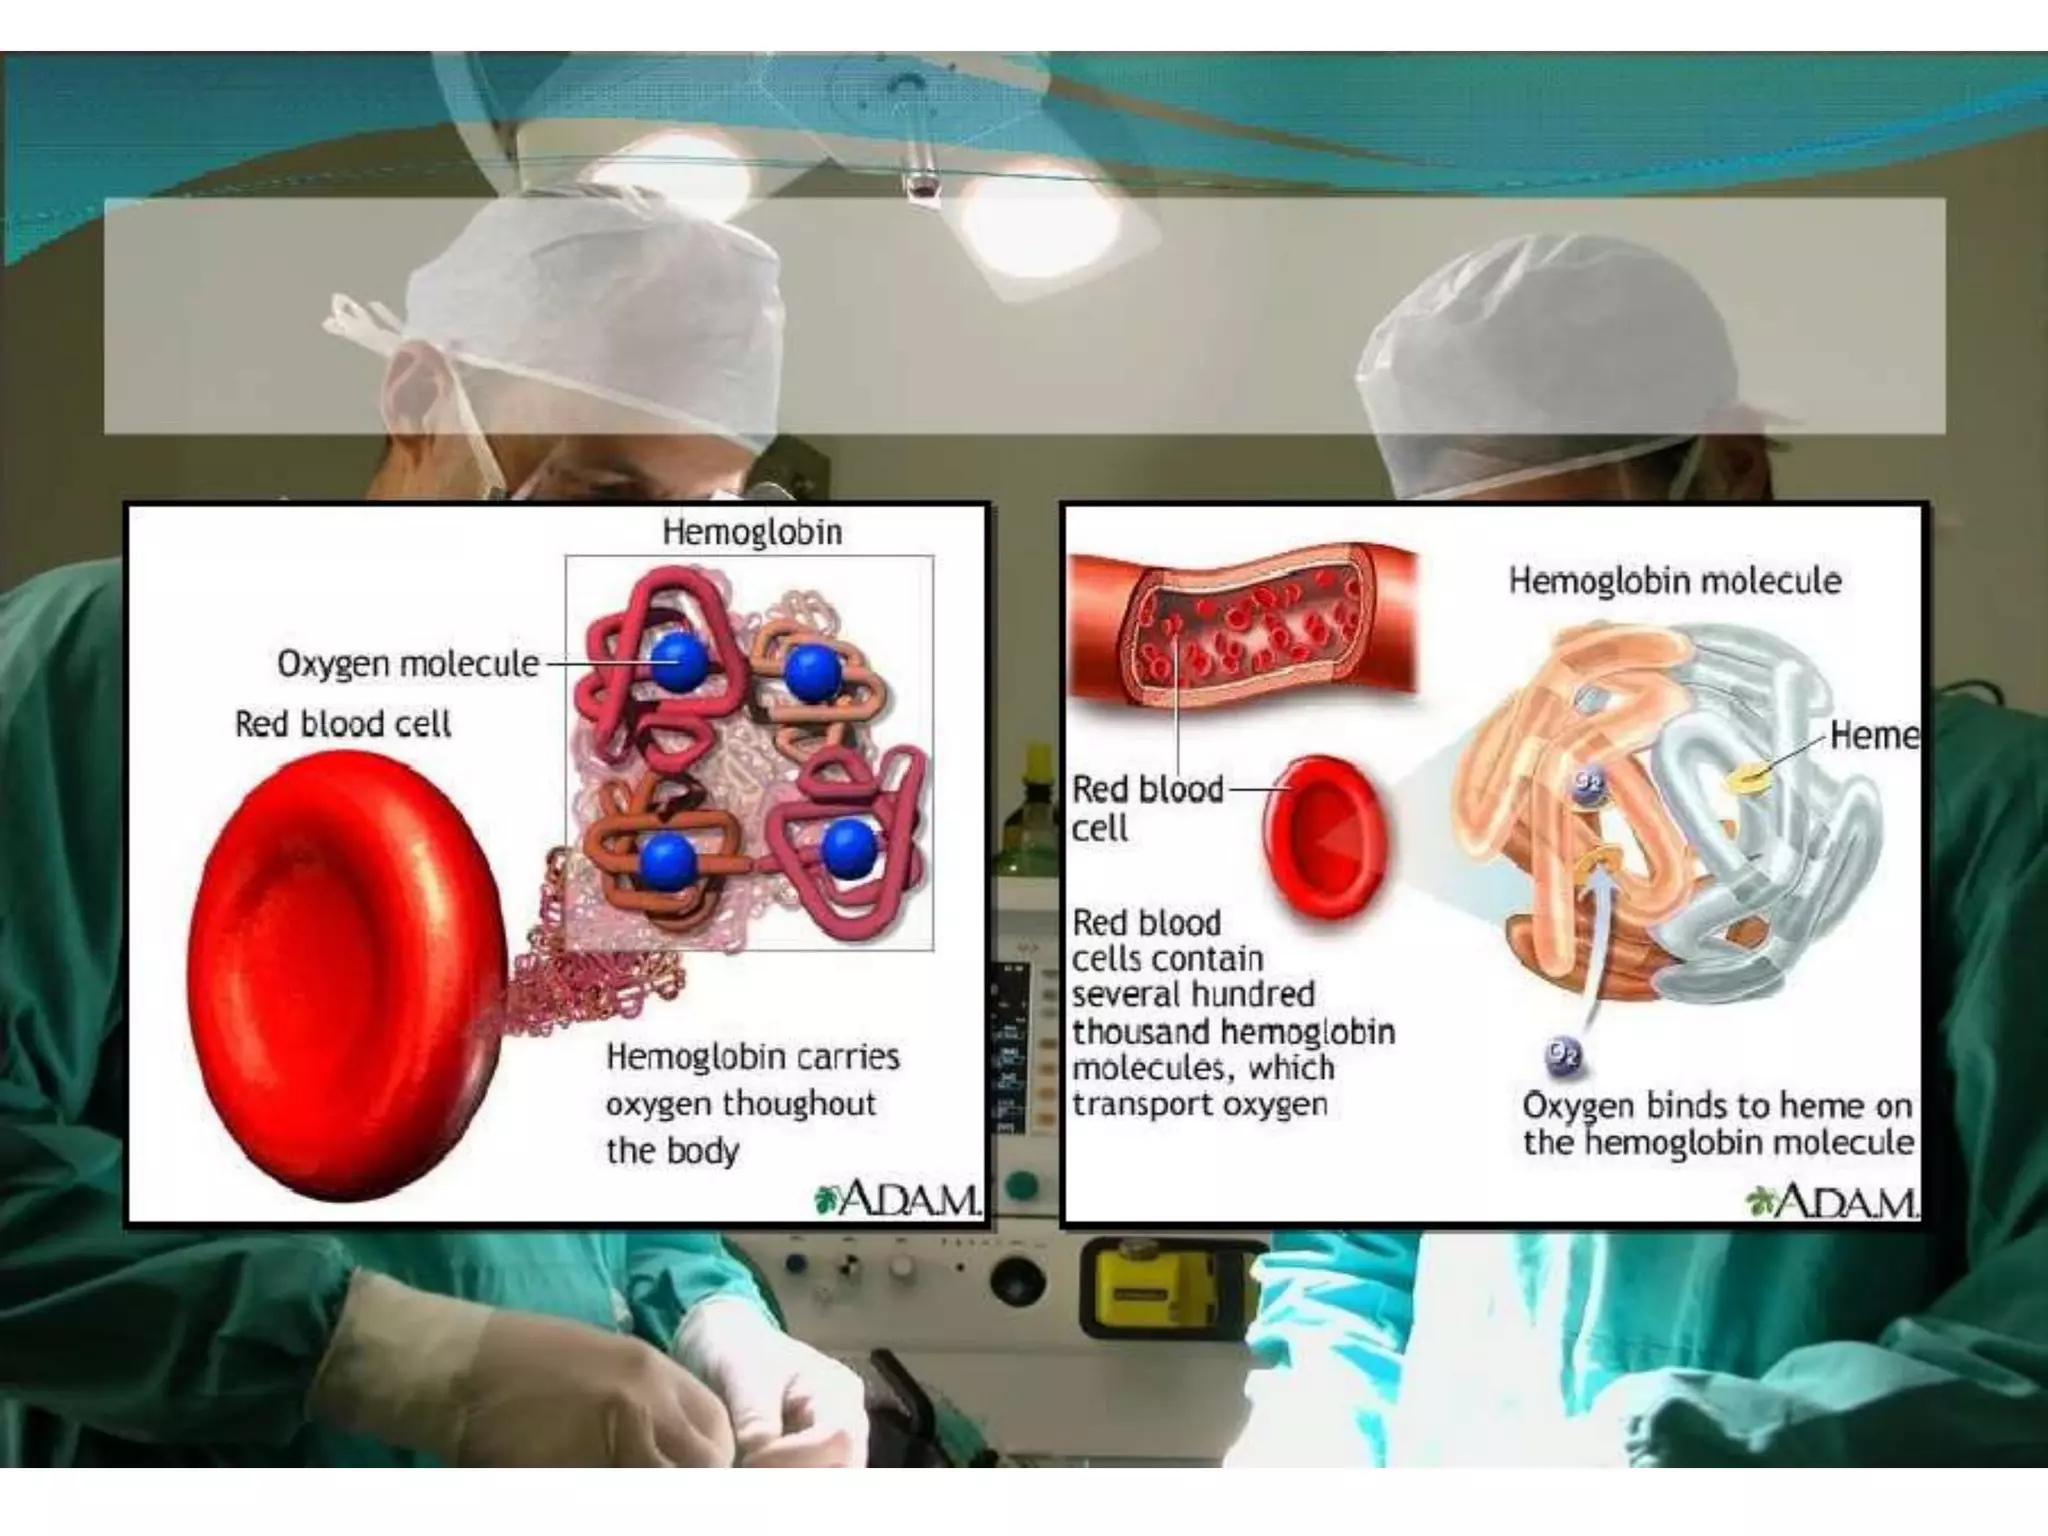
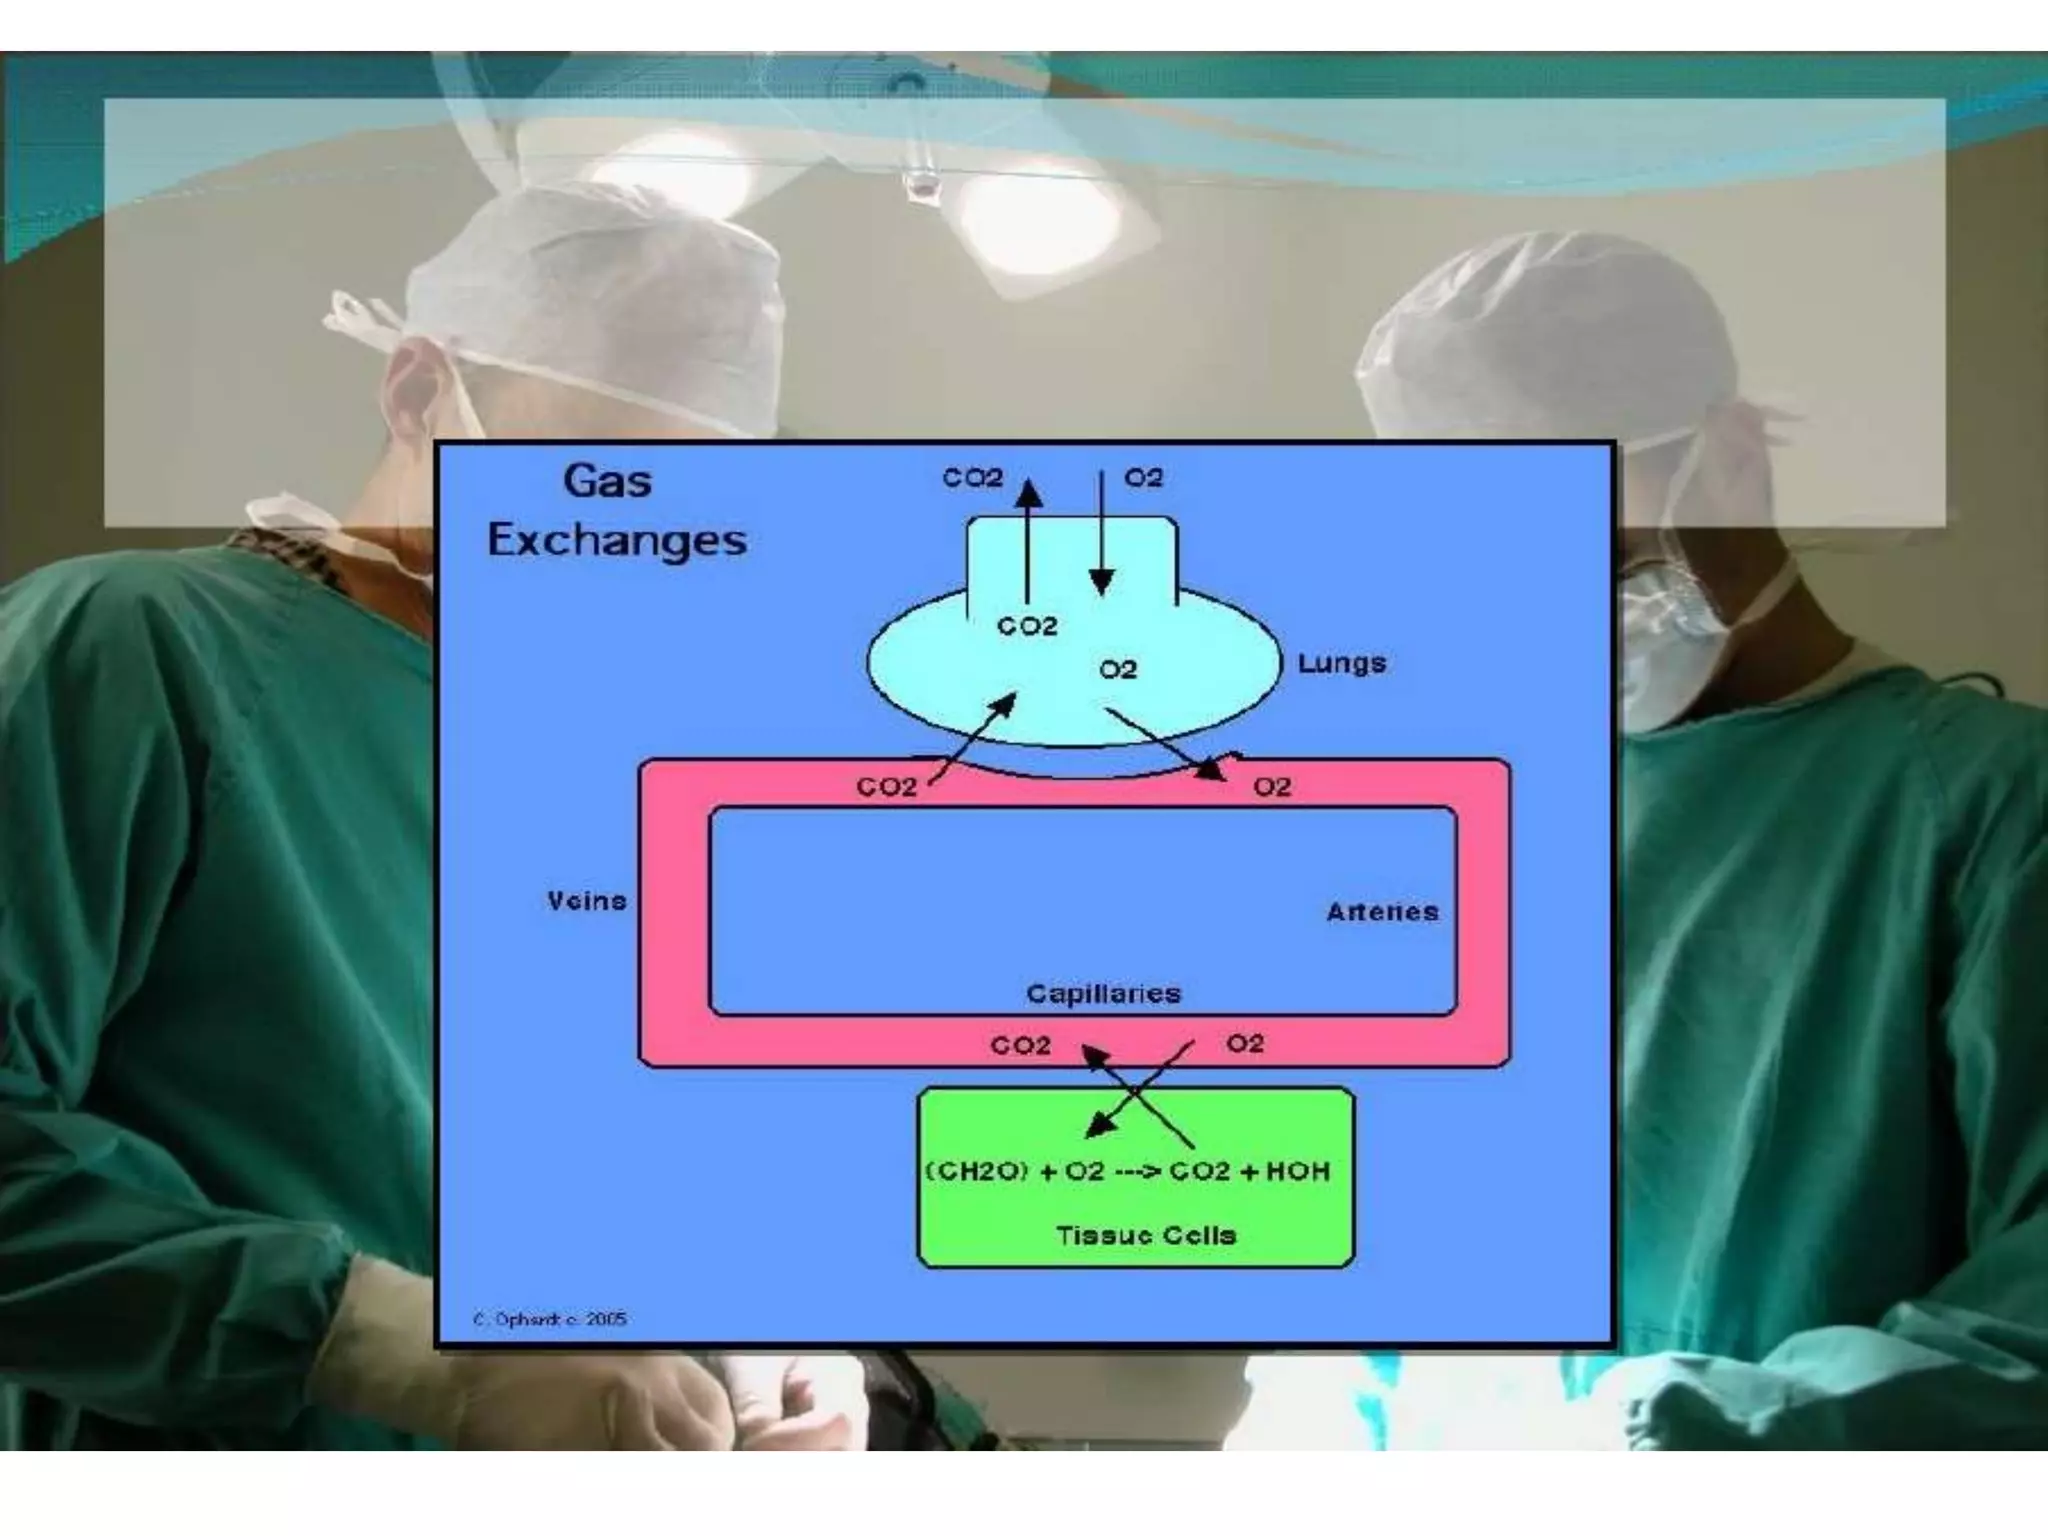
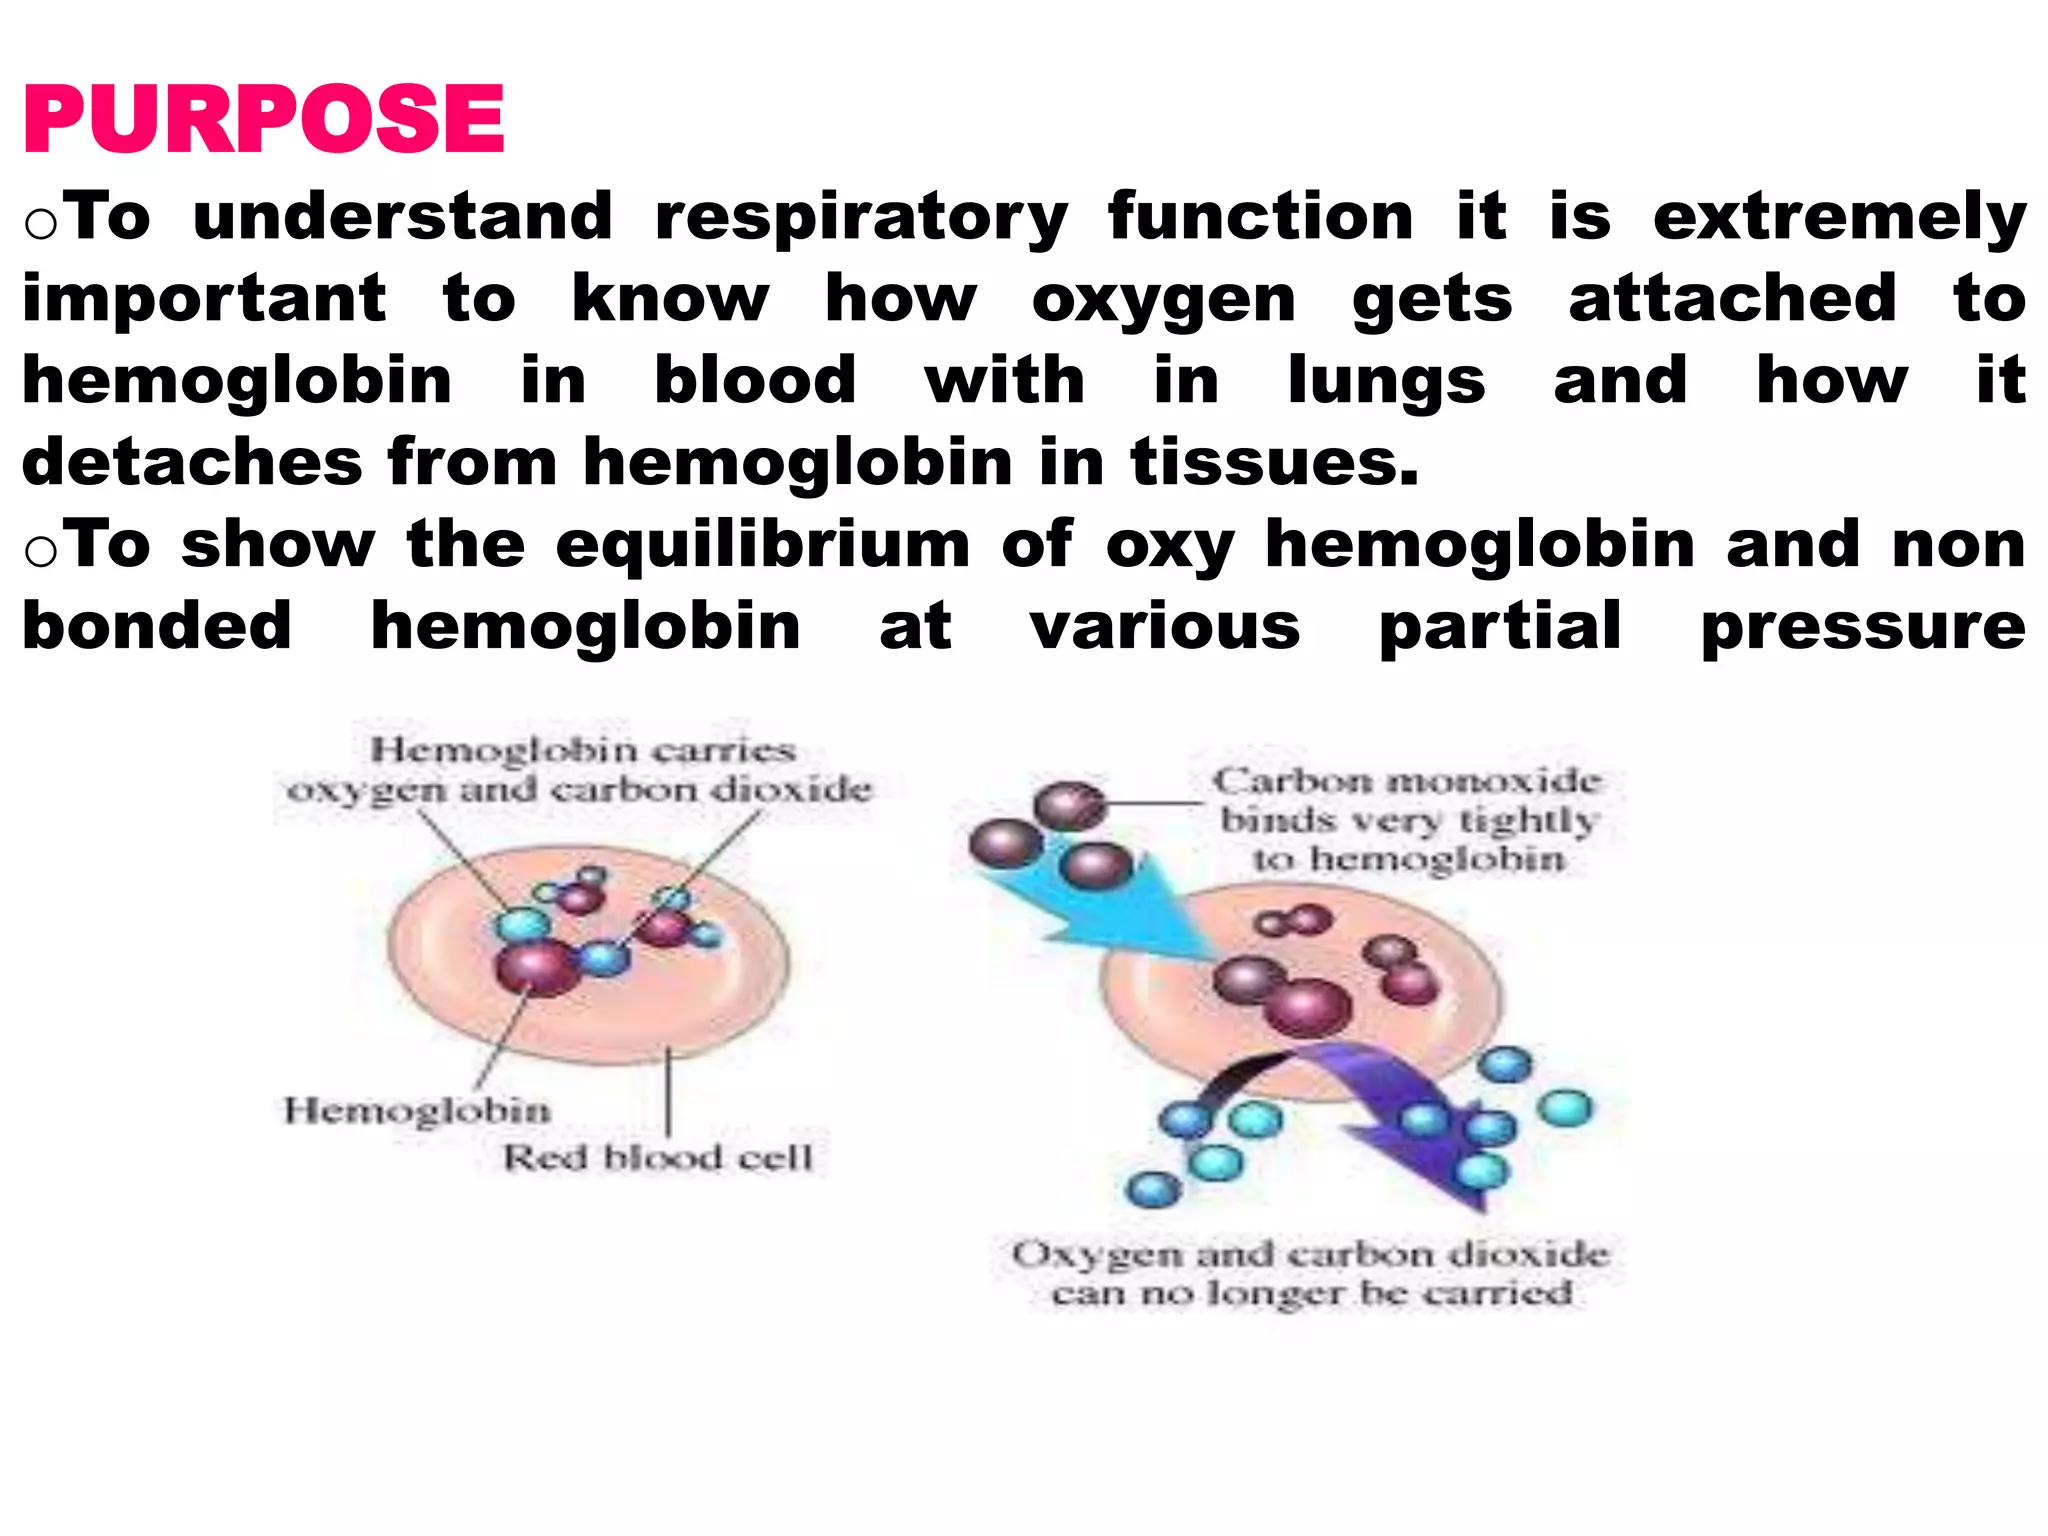
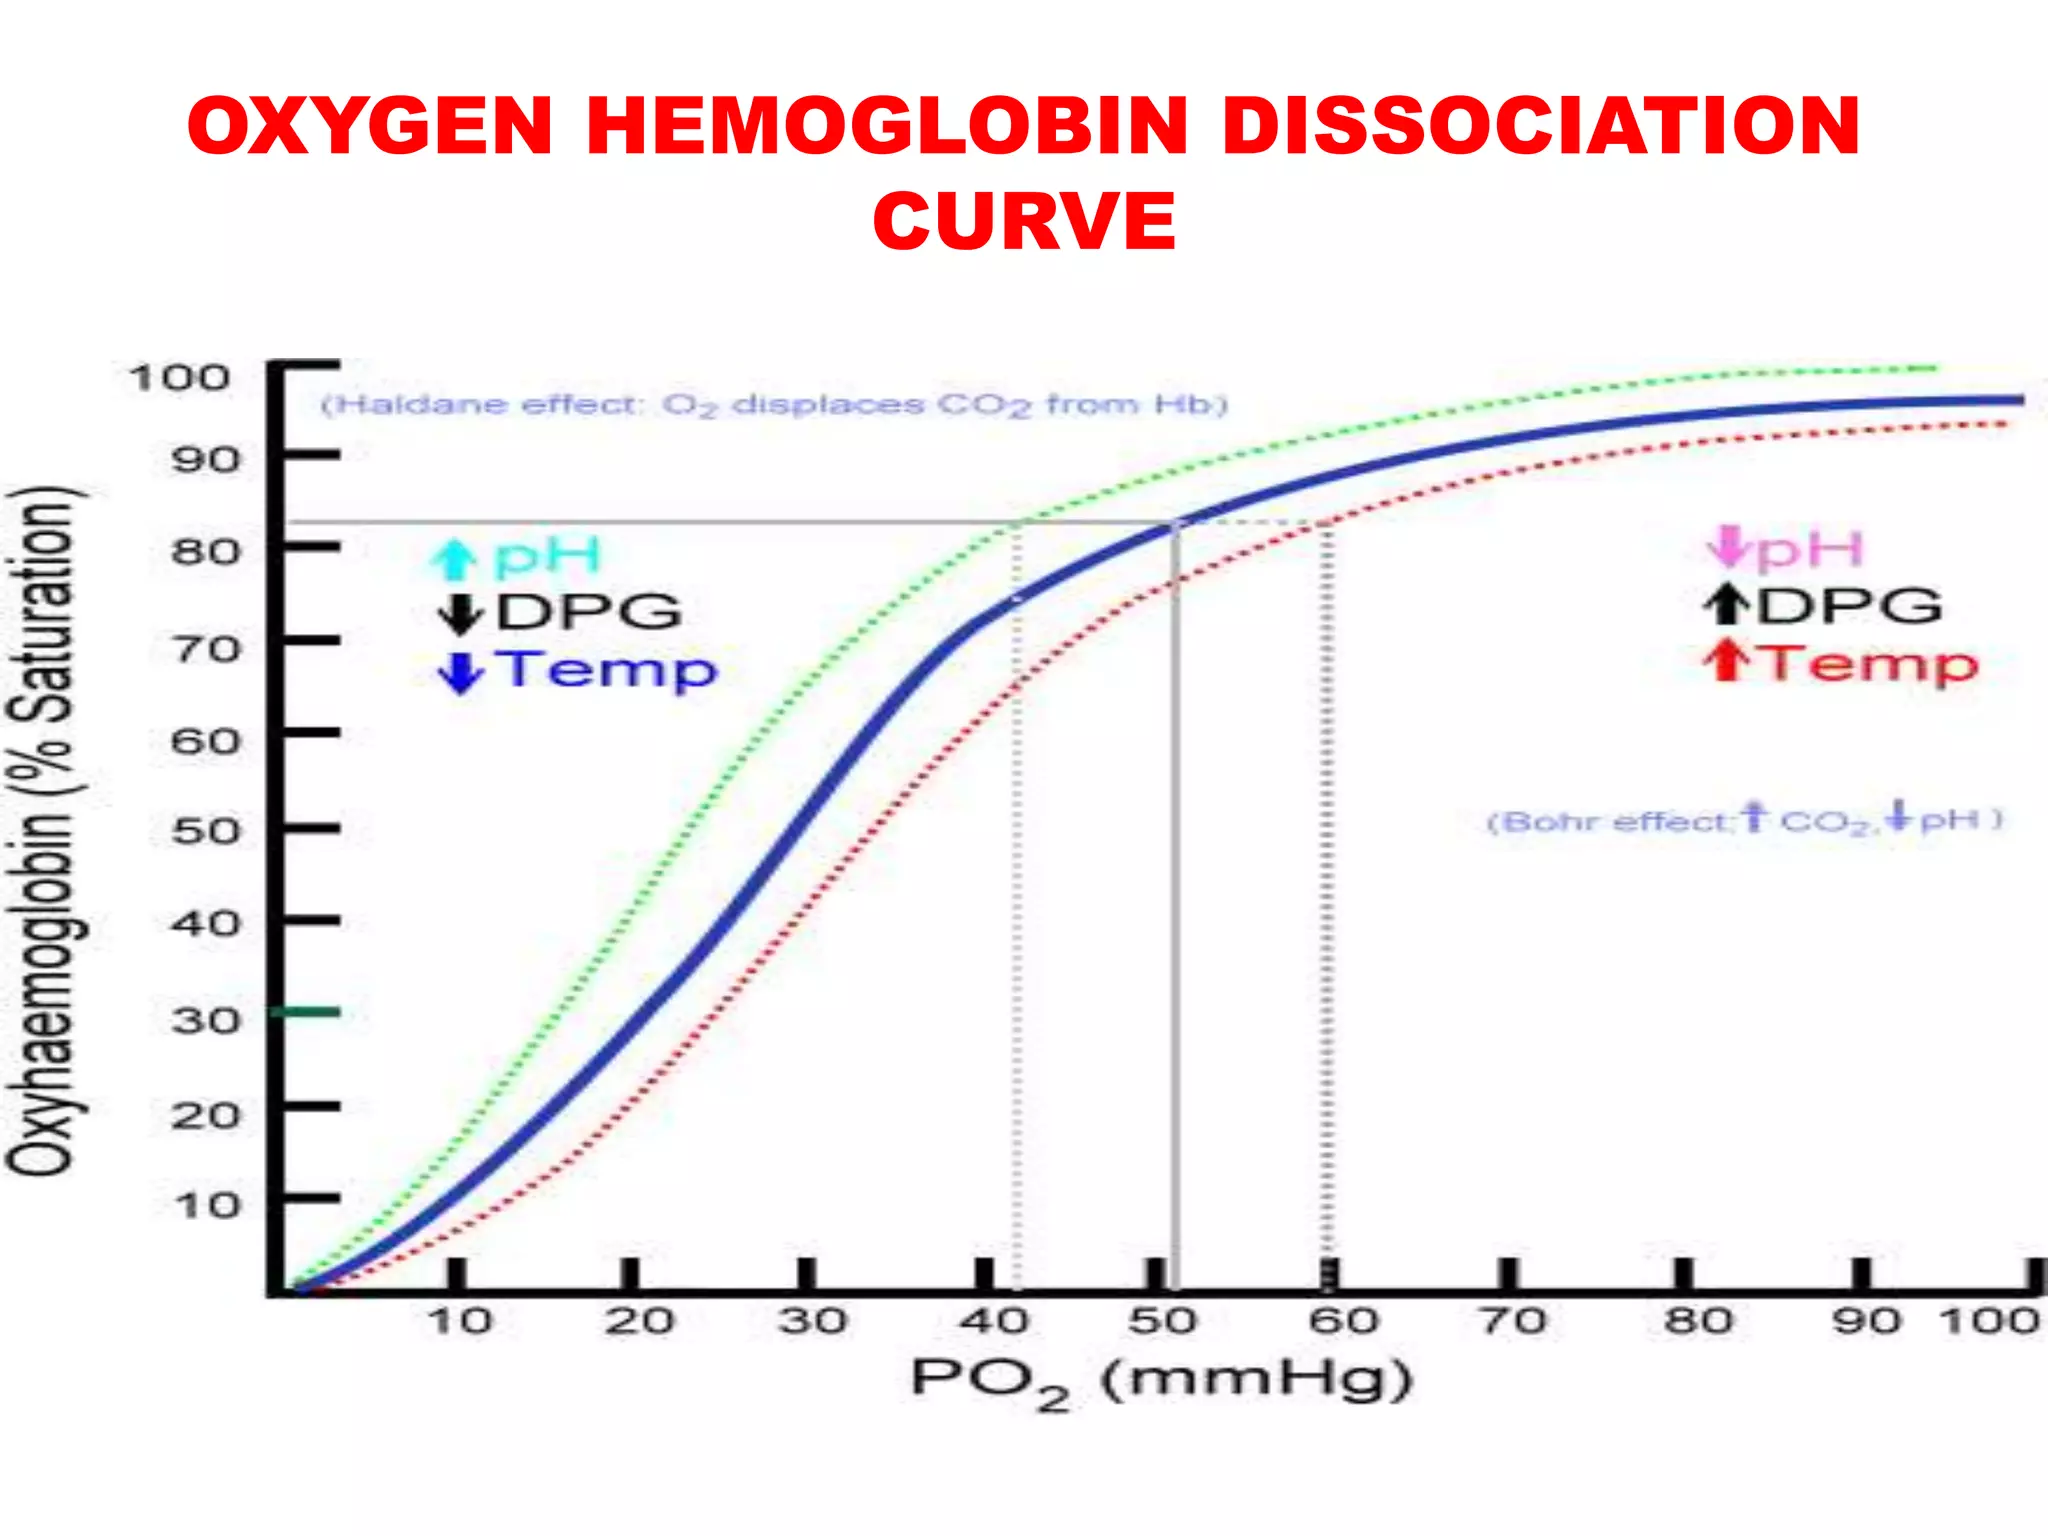
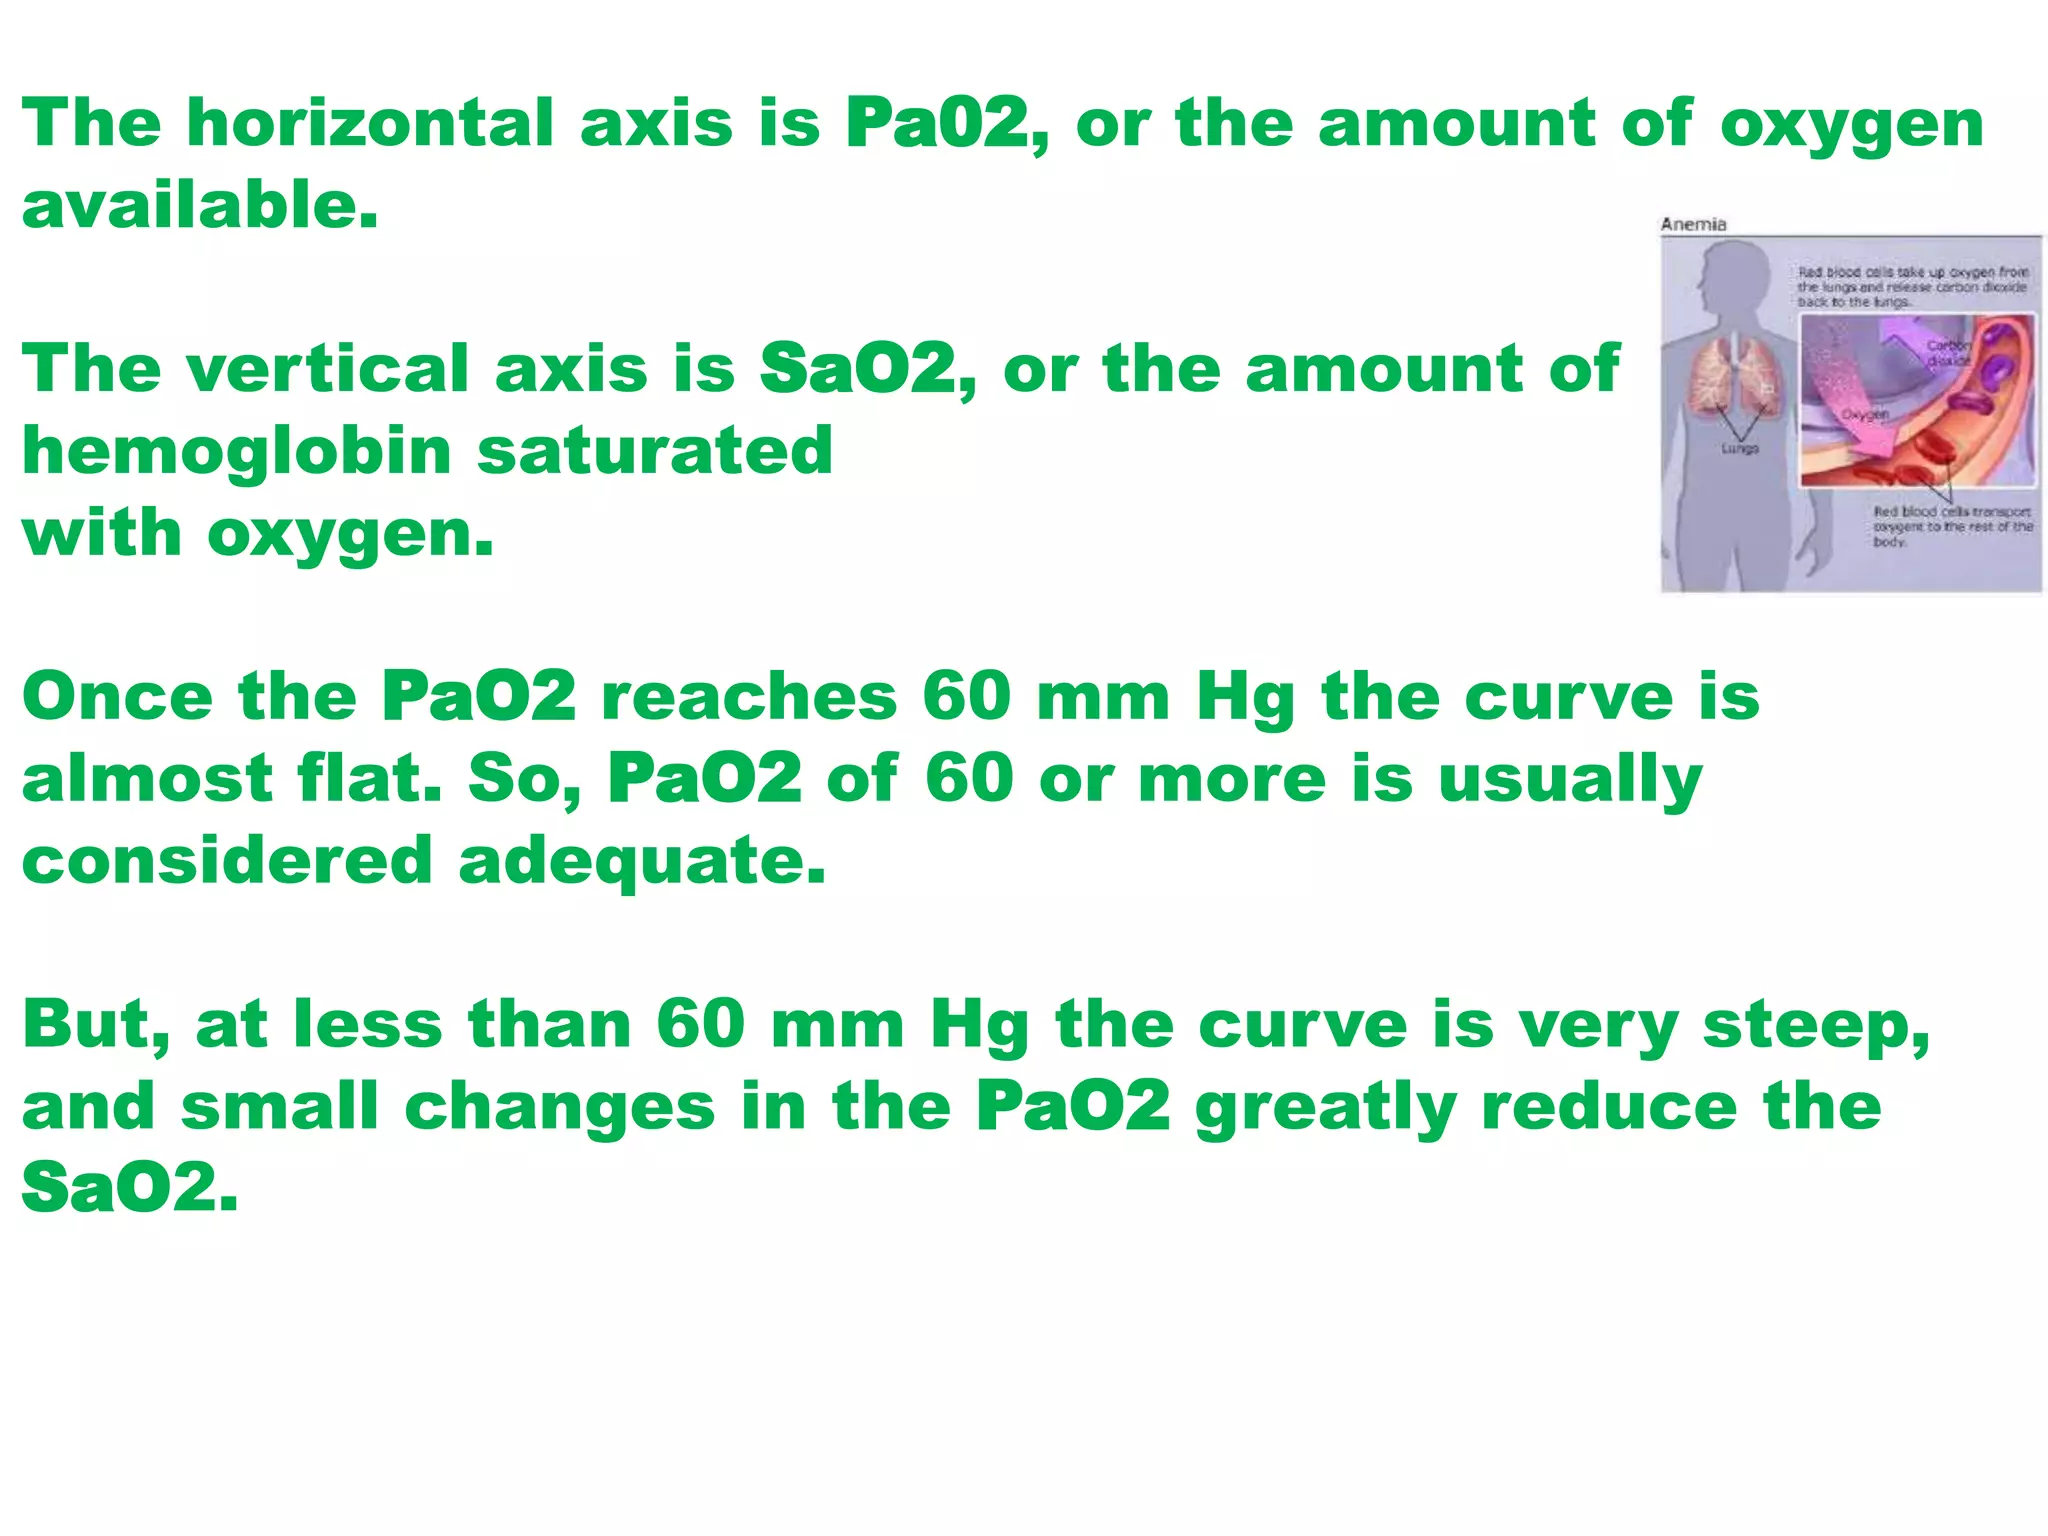
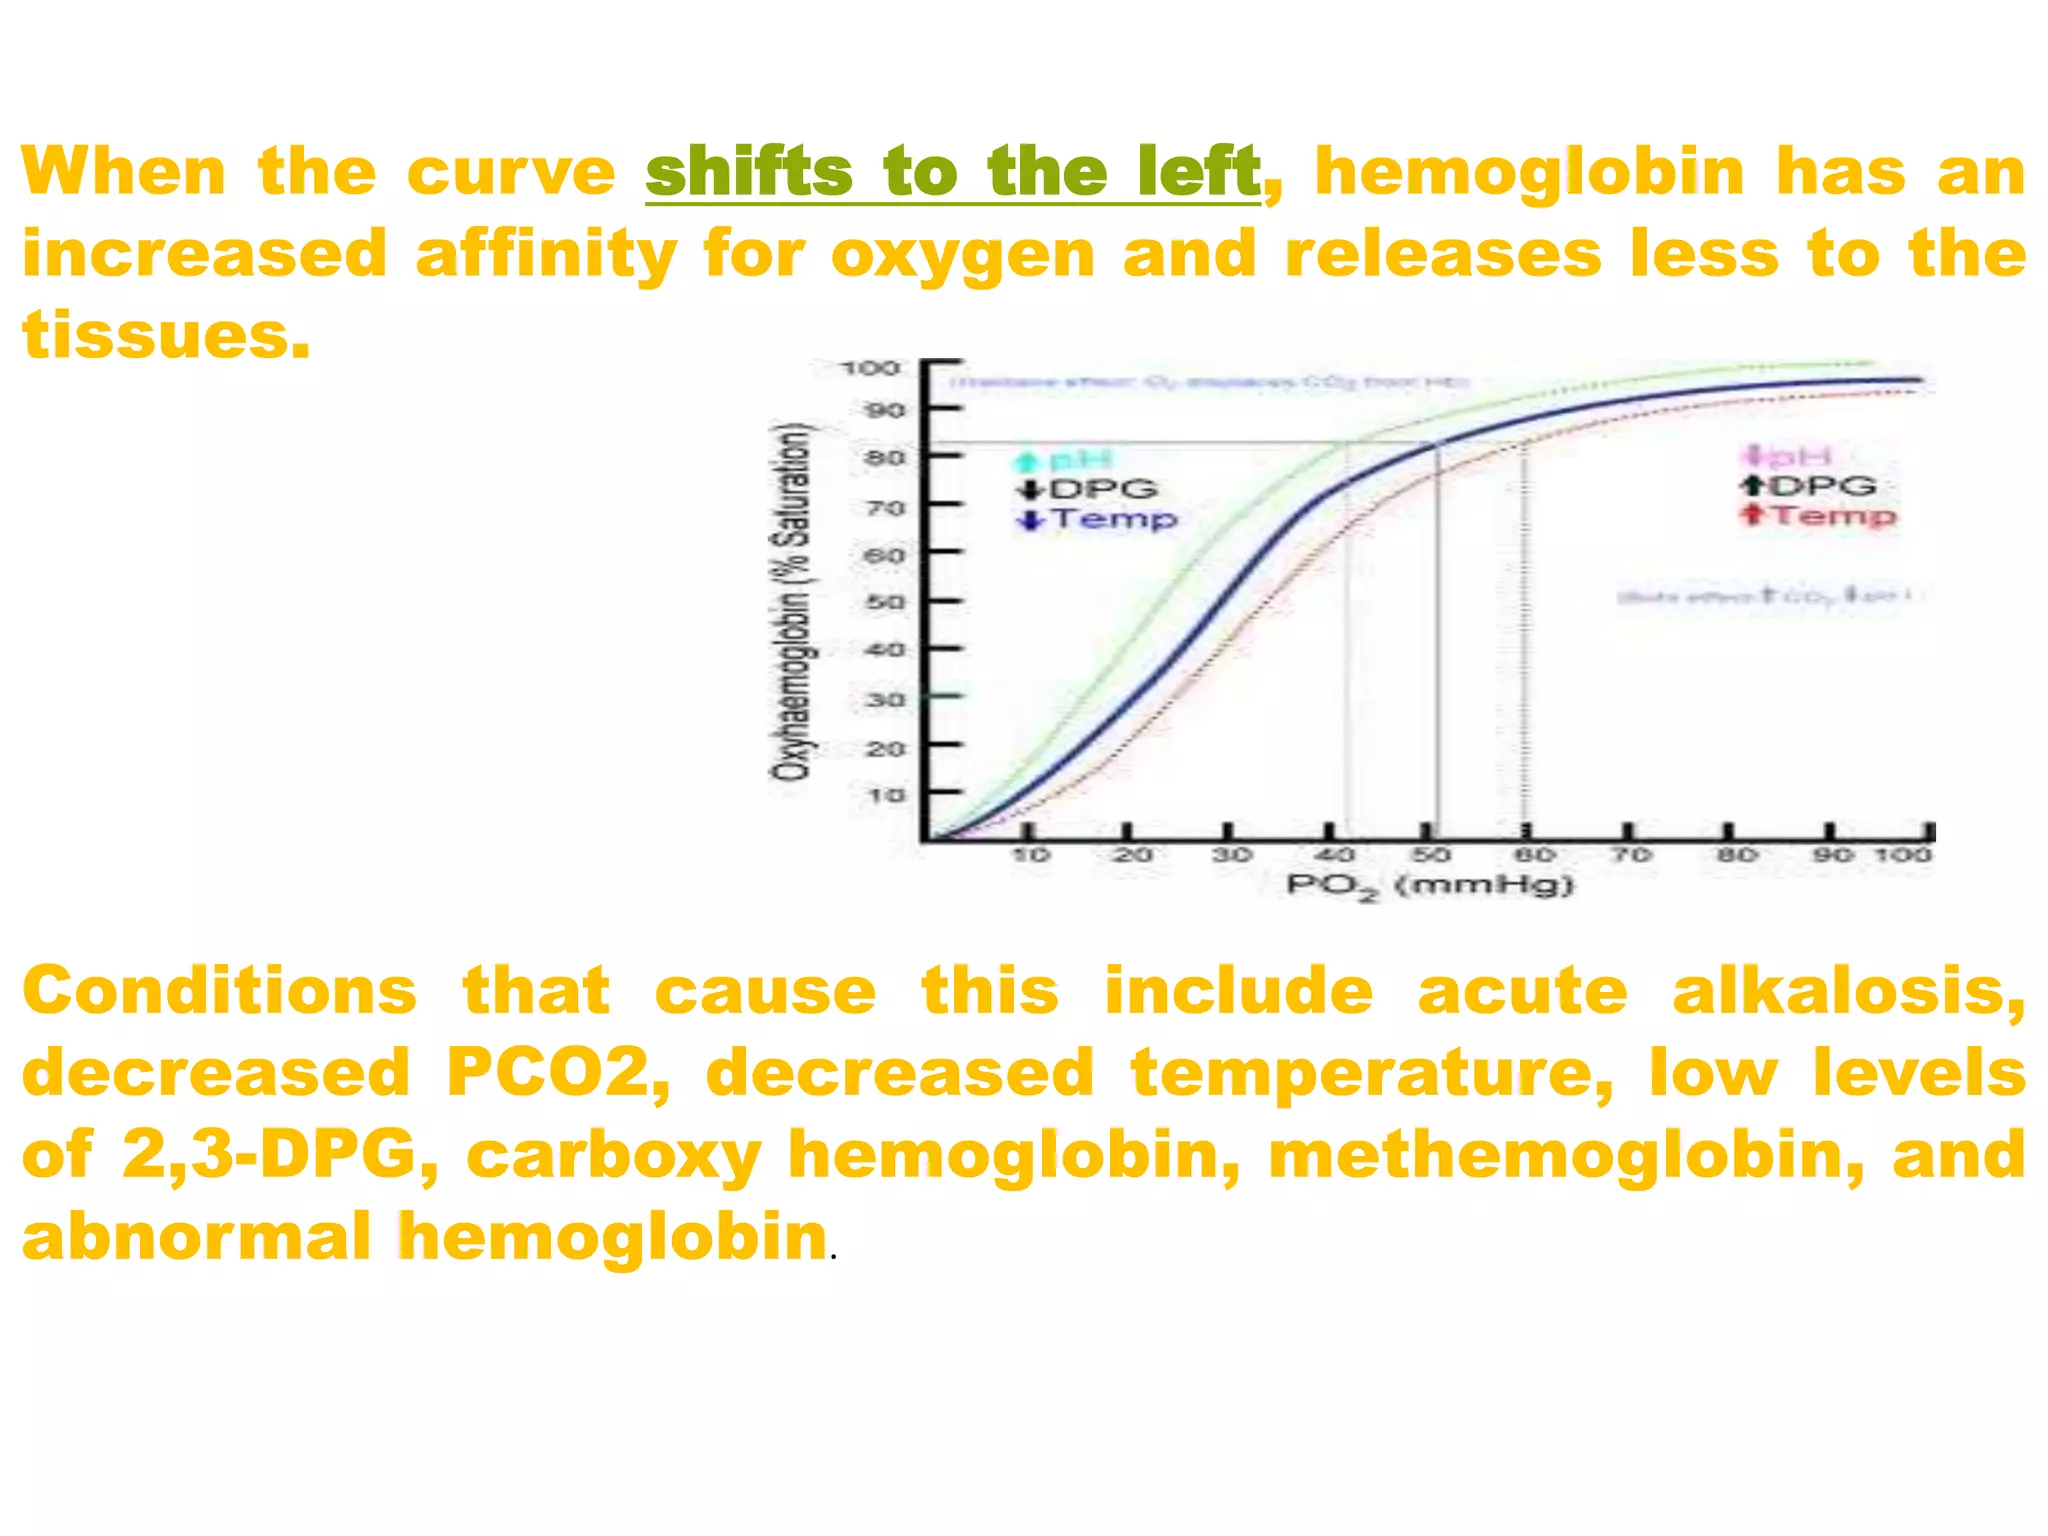
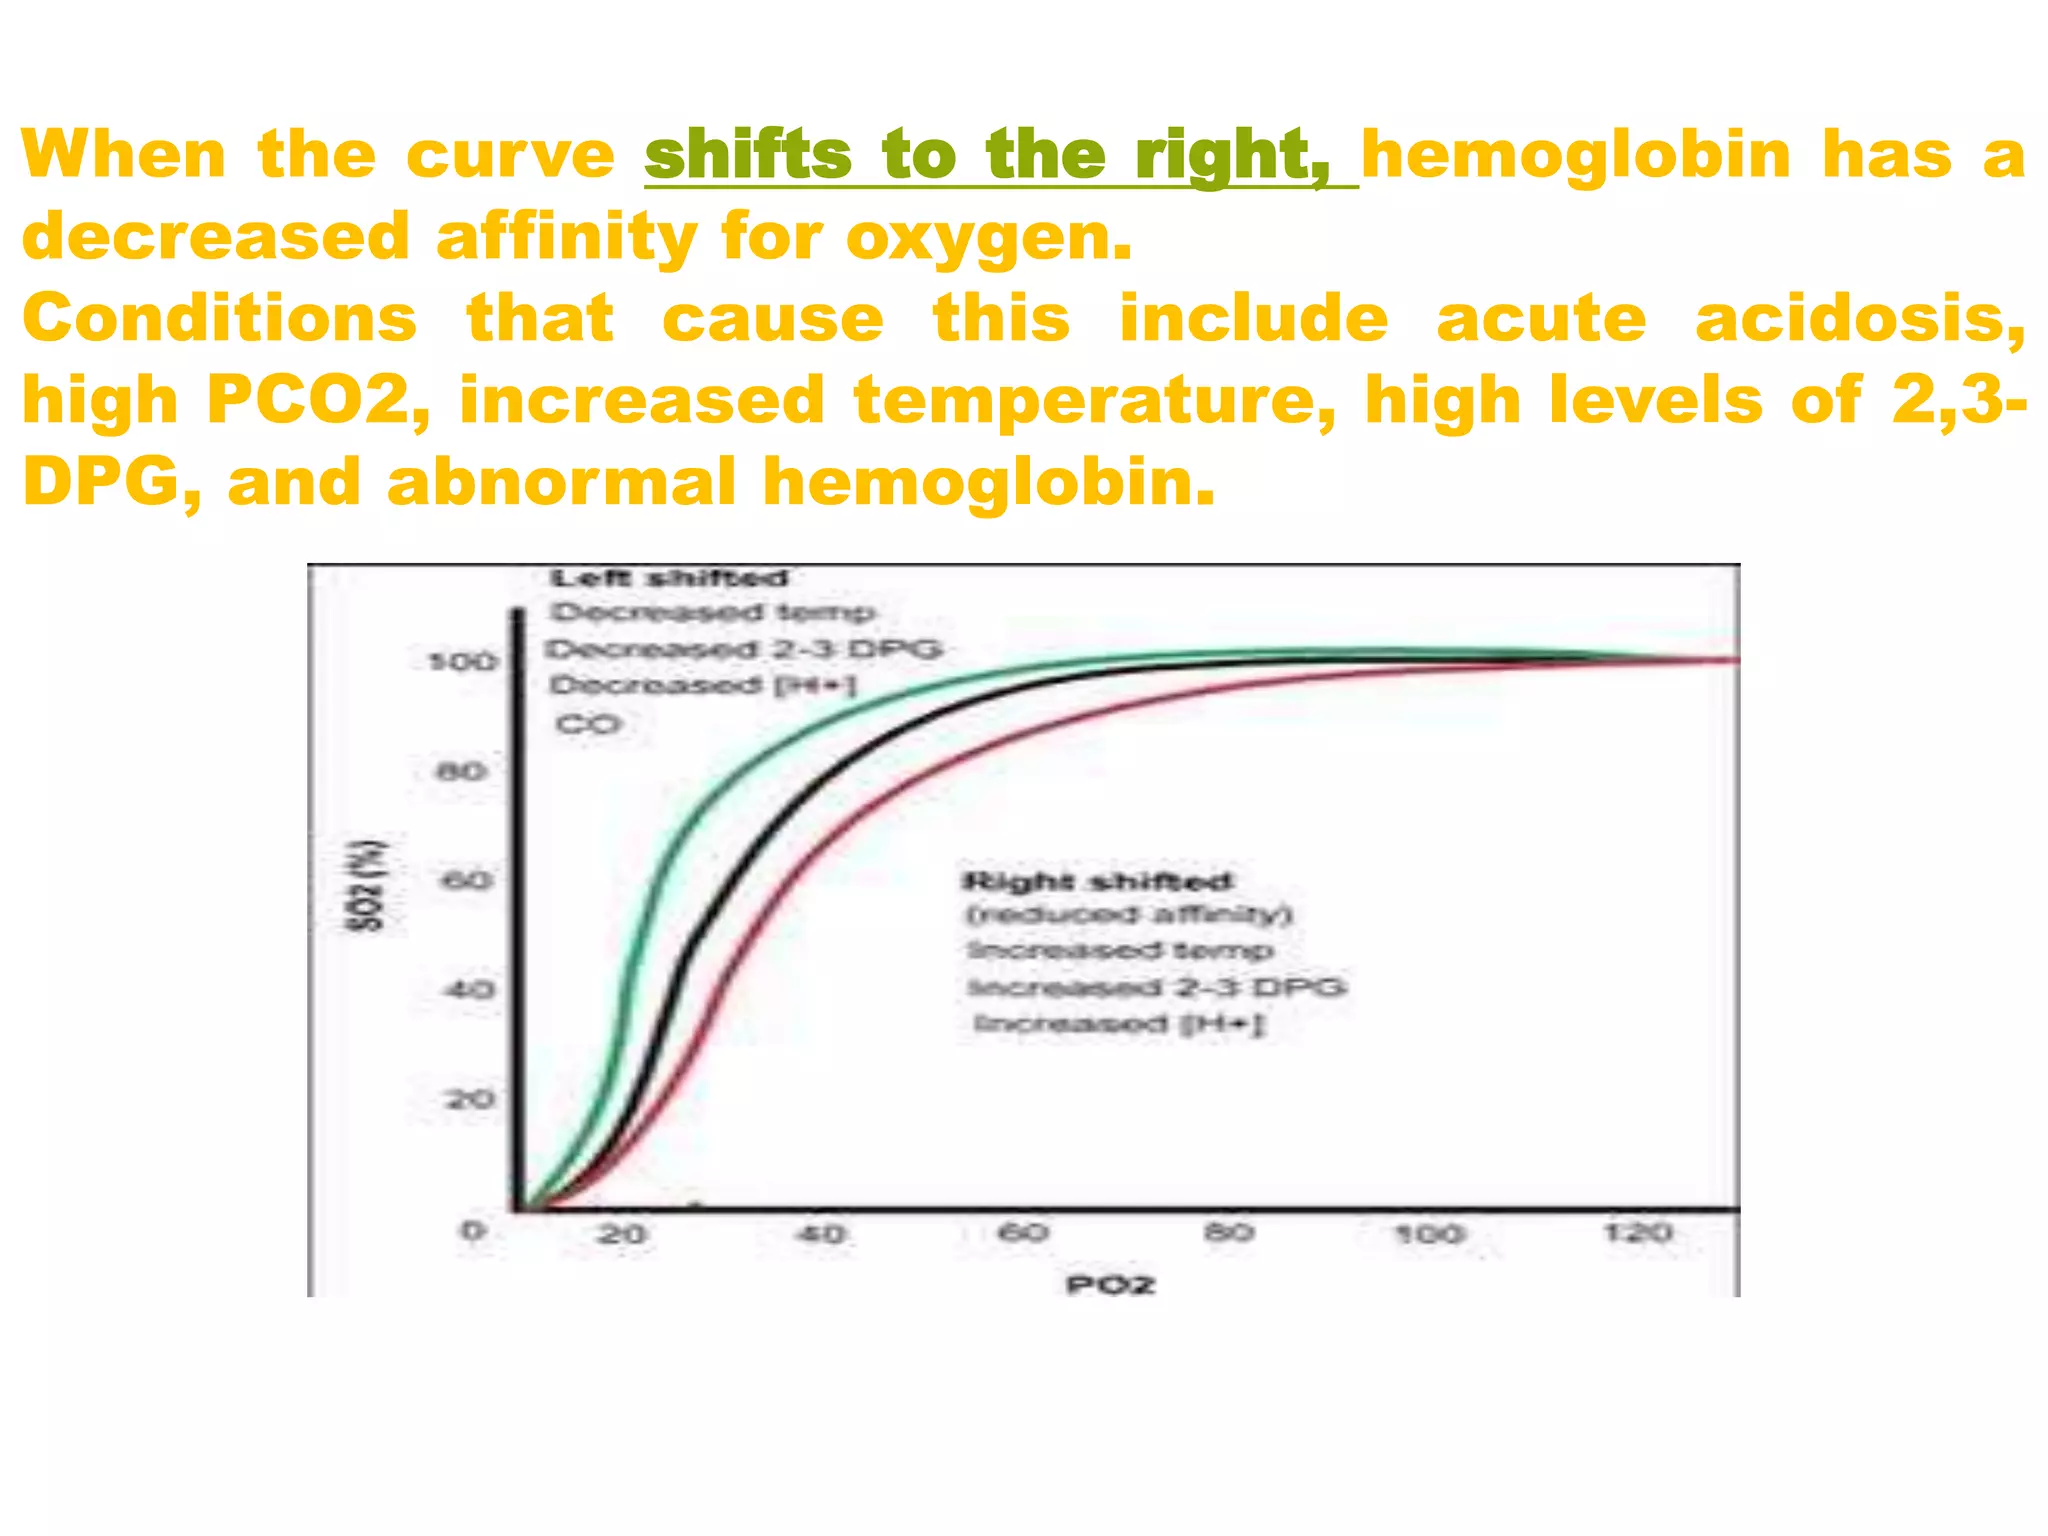
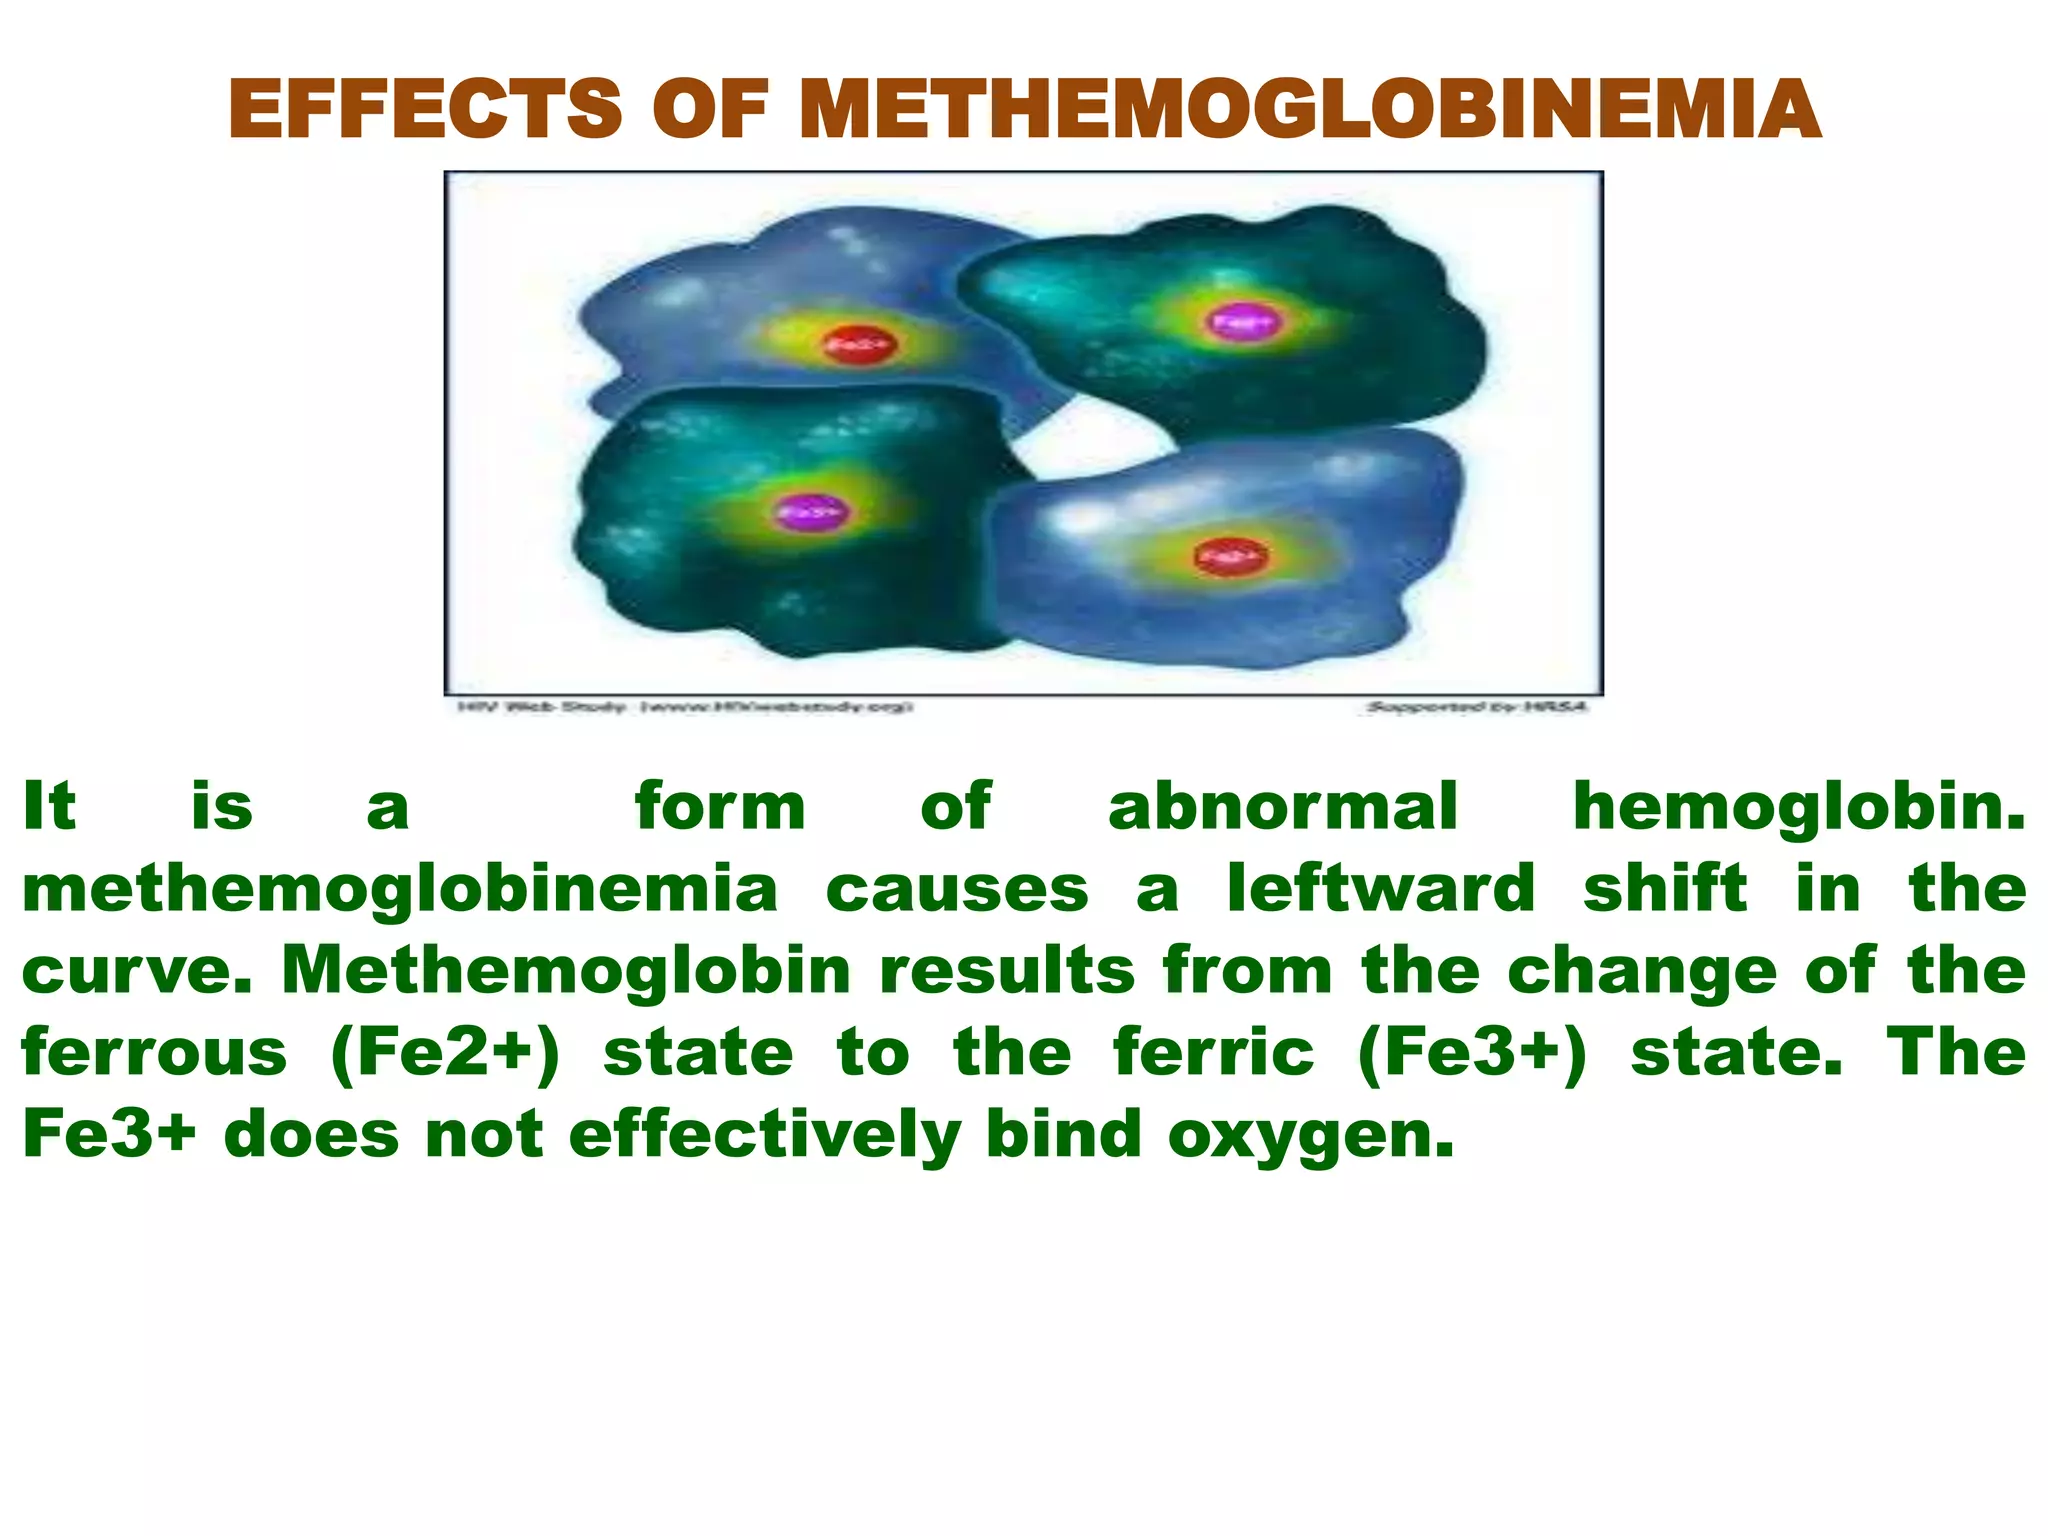
OXYGEN HEMOGLOBIN DISSOCIATION
CURVE
A.SWAROOPA
MSC(NURSING)
The oxyhemoglobin dissociation curve is an
important tool for understanding how our
blood carries the oxygen form the alveoli and
releases the oxygen into tissues.
PURPOSE
oTo understand respiratory function it is extremely
important to know how oxygen gets attached to
hemoglobin in blood with in lungs and how it
detaches from hemoglobin in tissues.
oTo show the equilibrium of oxy hemoglobin and non
bonded hemoglobin at various partial pressure
OXYGEN HEMOGLOBIN DISSOCIATION
CURVE
The O2-Hb dissociation curve is a sigmoid (s-
shaped) curve.
It represents the relationship between O2
concentration and the percentage saturation of Hb.
This curve describes the relationship between
available oxygen and amount of oxygen carried by
hemoglobin.
In this the partial pressure of oxygen is on (x axis)
and the oxygen saturation is on (y axis).
The horizontal axis is Pa02, or the amount of oxygen
available.
The vertical axis is SaO2, or the amount of
hemoglobin saturated
with oxygen.
Once the PaO2 reaches 60 mm Hg the curve is
almost flat. So, PaO2 of 60 or more is usually
considered adequate.
But, at less than 60 mm Hg the curve is very steep,
and small changes in the PaO2 greatly reduce the
SaO2.
♦Traditionally the curve starts with:
opH at 7.4,
otemperature at 37 Centigrade, and
oPaCO2 at 40.
♦Changes from these values are called "shifts".
♦The term "affinity" is used to describe oxygen's
attraction to hemoglobin binding sites. Affinity
changes with:
ovariation in pH,
otemperature,
oCO2 and,
o2,3,-DPG
When the curve shifts to the left, hemoglobin has an
increased affinity for oxygen and releases less to the
tissues.
Conditions that cause this include acute alkalosis,
decreased PCO2, decreased temperature, low levels
of 2,3-DPG, carboxy hemoglobin, methemoglobin, and
abnormal hemoglobin.
When the curve shifts to the right, hemoglobin has a
decreased affinity for oxygen.
Conditions that cause this include acute acidosis,
high PCO2, increased temperature, high levels of 2,3-
DPG, and abnormal hemoglobin.
Left Shift - shows an increased
hemoglobin affinity to oxygen. It is
easier to load oxygen but difficult to
unload it.
Right Shift - shows a decreased
hemoglobin affinity to oxygen. It
is difficult to load the oxygen,
but easy to unload the oxygen.
FACTORS AND HOW THE CURVE IS
AFFECTED
VARIATION OF THE HYDROGEN ION CONCENTRATION.
EFFECTS OF CORBONDIOXIDE.
EFFECTS OF 2,3 DPG (Di phospho glycerate).
TEMPERATURE.
CORBON MONOXIDE.
EFFECTS OF METHEMO GLOBUNEMIA.
FETAL HEMOGLOBIN.
VARIATION OF THE HYDROGEN ION
CONCENTRATION:
This changes the blood's PH. A decrease in pH shifts
the standard curve to the right, while an increase
shifts it to the left. This is known as the Bohr effect.
EFFECTS OF CARBON DIOXIDE:
Carbon dioxide affects the curve in two ways: first, it
influences intracellular pH (the Bohr effect), and
second, CO2 accumulation causes carbamino
compounds to be generated through chemical
interactions. Low levels of carbamino compounds
have the effect of shifting the curve to the left, while
higher levels cause a right ward shift.
EFFECTS OF 2,3-DPG:
2,3-diphosphoglycerate are created in erythrocytes
during glycolysis.
The production increases several conditions in the
presence of diminished peripheral tissue O2
availability, such as hypoxemia, chronic lung disease,
anemia, and congestive heart failure.
High levels of 2,3-DPG shift the curve to the right,
while low levels of 2,3-DPG cause a leftward shift
seen in septic shock and hypo phosphatemia.
TEMPERATURE:
Temperature does not have so dramatic effect as the
previous factors, but hyperthermia causes a
rightward shift, while hypothermia causes a leftward
shift.
EFFECTS OF METHEMOGLOBINEMIA
It is a form of abnormal hemoglobin.
methemoglobinemia causes a leftward shift in the
curve. Methemoglobin results from the change of the
ferrous (Fe2+) state to the ferric (Fe3+) state. The
Fe3+ does not effectively bind oxygen.
CARBON MONOXIDE:
carbon monoxide also has the effect of shifting the
curve to the left. With an increased level of carbon
monoxide, a person can suffer from severe
hypoxemia while maintaining a normal PO2.
FETAL HEMOGLOBIN:
Fetal hemoglobin (HbF) is structurally different from
normal hemoglobin (Hb). The fetal dissociation curve
is shifted to the left because of low fetal arterial
oxygen pressures.
Oxygen hemoglobin dissociation curve

Oxygen hemoglobin dissociation curve

  • 1.
  • 2.
    The oxyhemoglobin dissociationcurve is an important tool for understanding how our blood carries the oxygen form the alveoli and releases the oxygen into tissues.
  • 5.
    PURPOSE oTo understand respiratoryfunction it is extremely important to know how oxygen gets attached to hemoglobin in blood with in lungs and how it detaches from hemoglobin in tissues. oTo show the equilibrium of oxy hemoglobin and non bonded hemoglobin at various partial pressure
  • 6.
  • 7.
    The O2-Hb dissociationcurve is a sigmoid (s- shaped) curve. It represents the relationship between O2 concentration and the percentage saturation of Hb. This curve describes the relationship between available oxygen and amount of oxygen carried by hemoglobin. In this the partial pressure of oxygen is on (x axis) and the oxygen saturation is on (y axis).
  • 8.
    The horizontal axisis Pa02, or the amount of oxygen available. The vertical axis is SaO2, or the amount of hemoglobin saturated with oxygen. Once the PaO2 reaches 60 mm Hg the curve is almost flat. So, PaO2 of 60 or more is usually considered adequate. But, at less than 60 mm Hg the curve is very steep, and small changes in the PaO2 greatly reduce the SaO2.
  • 9.
    ♦Traditionally the curvestarts with: opH at 7.4, otemperature at 37 Centigrade, and oPaCO2 at 40. ♦Changes from these values are called "shifts". ♦The term "affinity" is used to describe oxygen's attraction to hemoglobin binding sites. Affinity changes with: ovariation in pH, otemperature, oCO2 and, o2,3,-DPG
  • 10.
    When the curveshifts to the left, hemoglobin has an increased affinity for oxygen and releases less to the tissues. Conditions that cause this include acute alkalosis, decreased PCO2, decreased temperature, low levels of 2,3-DPG, carboxy hemoglobin, methemoglobin, and abnormal hemoglobin.
  • 11.
    When the curveshifts to the right, hemoglobin has a decreased affinity for oxygen. Conditions that cause this include acute acidosis, high PCO2, increased temperature, high levels of 2,3- DPG, and abnormal hemoglobin.
  • 12.
    Left Shift -shows an increased hemoglobin affinity to oxygen. It is easier to load oxygen but difficult to unload it. Right Shift - shows a decreased hemoglobin affinity to oxygen. It is difficult to load the oxygen, but easy to unload the oxygen.
  • 13.
    FACTORS AND HOWTHE CURVE IS AFFECTED VARIATION OF THE HYDROGEN ION CONCENTRATION. EFFECTS OF CORBONDIOXIDE. EFFECTS OF 2,3 DPG (Di phospho glycerate). TEMPERATURE. CORBON MONOXIDE. EFFECTS OF METHEMO GLOBUNEMIA. FETAL HEMOGLOBIN.
  • 14.
    VARIATION OF THEHYDROGEN ION CONCENTRATION: This changes the blood's PH. A decrease in pH shifts the standard curve to the right, while an increase shifts it to the left. This is known as the Bohr effect.
  • 15.
    EFFECTS OF CARBONDIOXIDE: Carbon dioxide affects the curve in two ways: first, it influences intracellular pH (the Bohr effect), and second, CO2 accumulation causes carbamino compounds to be generated through chemical interactions. Low levels of carbamino compounds have the effect of shifting the curve to the left, while higher levels cause a right ward shift.
  • 16.
    EFFECTS OF 2,3-DPG: 2,3-diphosphoglycerateare created in erythrocytes during glycolysis. The production increases several conditions in the presence of diminished peripheral tissue O2 availability, such as hypoxemia, chronic lung disease, anemia, and congestive heart failure. High levels of 2,3-DPG shift the curve to the right, while low levels of 2,3-DPG cause a leftward shift seen in septic shock and hypo phosphatemia.
  • 17.
    TEMPERATURE: Temperature does nothave so dramatic effect as the previous factors, but hyperthermia causes a rightward shift, while hypothermia causes a leftward shift.
  • 18.
    EFFECTS OF METHEMOGLOBINEMIA Itis a form of abnormal hemoglobin. methemoglobinemia causes a leftward shift in the curve. Methemoglobin results from the change of the ferrous (Fe2+) state to the ferric (Fe3+) state. The Fe3+ does not effectively bind oxygen.
  • 19.
    CARBON MONOXIDE: carbon monoxidealso has the effect of shifting the curve to the left. With an increased level of carbon monoxide, a person can suffer from severe hypoxemia while maintaining a normal PO2.
  • 20.
    FETAL HEMOGLOBIN: Fetal hemoglobin(HbF) is structurally different from normal hemoglobin (Hb). The fetal dissociation curve is shifted to the left because of low fetal arterial oxygen pressures.