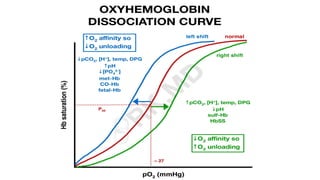
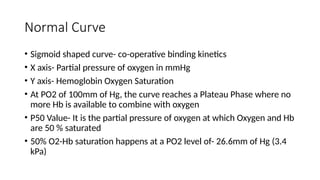
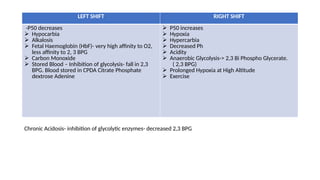
Oxygen Dissociation Curve
Dr. Riya Sahebrao Divekar
Introduction
OXYGEN TRANSPORT:
• Oxygen diffuses into the plasma of the Pulmonary capillary blood
driven by its concentration gradient from the alveolus
• Major form for transport of O2 is by combining with Haemoglobin
• The relationship between these two can be studied with the help of
Oxygen Dissociation curve
• It is an important tool for understanding how Blood carries and
releases oxygen
• Major form(97%)- Oxygen combined with Hb –O2 transport
• Minor form (3%) - Dissolved form-
• The quantity of O2 dissolved in plasma is directly proportional to its
partial pressure (Henrys Law) PO2
• Gas conc= Solubility coefficient X Partial Pressure
• 0.003ml/mmHg/100 ml blood (solubility coefficient)
• For PO2 of 100 mm Hg- 0.3 mL of dissolved O2 in 100 ml of blood
-Dissolved form – 0.3ml/100ml of blood
• 1gm Hb- 1.34ml of O2
• Hb Increases transport of O2 by 70 times
Hemoglobin
• Heme + Globin: Quaternary
• Heme- Present as 4 subunits connected by polypeptide globin chains
as 2 Alpha and 2 Beta subunits(Adult)
• Each Heme contains one atom of Ferrous +2 ion
• Each Ferrous ion has the ability to bind to one Oxygen molecule
reversibly
Oxygen Cascade-
• The process of declining oxygen tension from atmosphere to
mitochondria
Atmospheric air (dry air) (159 mm Hg)
Lower Respiratory Tract (moist) (150 mm Hg)
Alveoli PaO2 (104 mm Hg)
Arterial Blood PaO2 (100 mm Hg)
Venous Blood PaO2 (40 mm Hg)
Mitochondria PO2 (7-37 mm Hg)
(Humidification)
O2 Uptake+ Co2 addition + alveolar
ventilation)
Venous Admixture
Tissue extraction
Normal Curve
• Sigmoid shaped curve- co-operative binding kinetics
• X axis- Partial pressure of oxygen in mmHg
• Y axis- Hemoglobin Oxygen Saturation
• At PO2 of 100mm of Hg, the curve reaches a Plateau Phase where no
more Hb is available to combine with oxygen
• P50 Value- It is the partial pressure of oxygen at which Oxygen and Hb
are 50 % saturated
• 50% O2-Hb saturation happens at a PO2 level of- 26.6mm of Hg (3.4
kPa)
• A rightward shift in the curve lowers O2 affinity, displaces O2 from
Hemoglobin, and makes more O2 available to tissues
• A leftward shift increases hemoglobin’s affinity for O2, reducing its
availability to tissues
LEFT SHIFT RIGHT SHIFT
-P50 decreases
 Hypocarbia
 Alkalosis
 Fetal Haemoglobin (HbF)- very high affinity to O2,
less affinity to 2, 3 BPG
 Carbon Monoxide
 Stored Blood – Inhibition of glycolysis- fall in 2,3
BPG. Blood stored in CPDA Citrate Phosphate
dextrose Adenine
 P50 increases
 Hypoxia
 Hypercarbia
 Decreased Ph
 Acidity
 Anaerobic Glycolysis-> 2,3 Bi Phospho Glycerate.
( 2,3 BPG)
 Prolonged Hypoxia at High Altitude
 Exercise
Chronic Acidosis- inhibition of glycolytic enzymes- decreased 2,3 BPG
• Haldane effect- Loading of O2 by Hb and release of CO2- Lungs-Left
shift
• Bohr’s effect- An increase in Blood Hydrogen ion concentration
reduces O2 binding to Hemoglobin i.e. Unloading of O2- Right Shift-
Release of O2 at tissue level
Thank You

Oxygen Dissociation Curve.pptx a breif description

  • 1.
    Oxygen Dissociation Curve Dr.Riya Sahebrao Divekar
  • 2.
    Introduction OXYGEN TRANSPORT: • Oxygendiffuses into the plasma of the Pulmonary capillary blood driven by its concentration gradient from the alveolus • Major form for transport of O2 is by combining with Haemoglobin • The relationship between these two can be studied with the help of Oxygen Dissociation curve • It is an important tool for understanding how Blood carries and releases oxygen
  • 3.
    • Major form(97%)-Oxygen combined with Hb –O2 transport • Minor form (3%) - Dissolved form- • The quantity of O2 dissolved in plasma is directly proportional to its partial pressure (Henrys Law) PO2 • Gas conc= Solubility coefficient X Partial Pressure • 0.003ml/mmHg/100 ml blood (solubility coefficient) • For PO2 of 100 mm Hg- 0.3 mL of dissolved O2 in 100 ml of blood -Dissolved form – 0.3ml/100ml of blood • 1gm Hb- 1.34ml of O2 • Hb Increases transport of O2 by 70 times
  • 4.
    Hemoglobin • Heme +Globin: Quaternary • Heme- Present as 4 subunits connected by polypeptide globin chains as 2 Alpha and 2 Beta subunits(Adult) • Each Heme contains one atom of Ferrous +2 ion • Each Ferrous ion has the ability to bind to one Oxygen molecule reversibly
  • 5.
    Oxygen Cascade- • Theprocess of declining oxygen tension from atmosphere to mitochondria Atmospheric air (dry air) (159 mm Hg) Lower Respiratory Tract (moist) (150 mm Hg) Alveoli PaO2 (104 mm Hg) Arterial Blood PaO2 (100 mm Hg) Venous Blood PaO2 (40 mm Hg) Mitochondria PO2 (7-37 mm Hg) (Humidification) O2 Uptake+ Co2 addition + alveolar ventilation) Venous Admixture Tissue extraction
  • 7.
    Normal Curve • Sigmoidshaped curve- co-operative binding kinetics • X axis- Partial pressure of oxygen in mmHg • Y axis- Hemoglobin Oxygen Saturation • At PO2 of 100mm of Hg, the curve reaches a Plateau Phase where no more Hb is available to combine with oxygen • P50 Value- It is the partial pressure of oxygen at which Oxygen and Hb are 50 % saturated • 50% O2-Hb saturation happens at a PO2 level of- 26.6mm of Hg (3.4 kPa)
  • 8.
    • A rightwardshift in the curve lowers O2 affinity, displaces O2 from Hemoglobin, and makes more O2 available to tissues • A leftward shift increases hemoglobin’s affinity for O2, reducing its availability to tissues
  • 9.
    LEFT SHIFT RIGHTSHIFT -P50 decreases  Hypocarbia  Alkalosis  Fetal Haemoglobin (HbF)- very high affinity to O2, less affinity to 2, 3 BPG  Carbon Monoxide  Stored Blood – Inhibition of glycolysis- fall in 2,3 BPG. Blood stored in CPDA Citrate Phosphate dextrose Adenine  P50 increases  Hypoxia  Hypercarbia  Decreased Ph  Acidity  Anaerobic Glycolysis-> 2,3 Bi Phospho Glycerate. ( 2,3 BPG)  Prolonged Hypoxia at High Altitude  Exercise Chronic Acidosis- inhibition of glycolytic enzymes- decreased 2,3 BPG
  • 10.
    • Haldane effect-Loading of O2 by Hb and release of CO2- Lungs-Left shift • Bohr’s effect- An increase in Blood Hydrogen ion concentration reduces O2 binding to Hemoglobin i.e. Unloading of O2- Right Shift- Release of O2 at tissue level
  • 11.