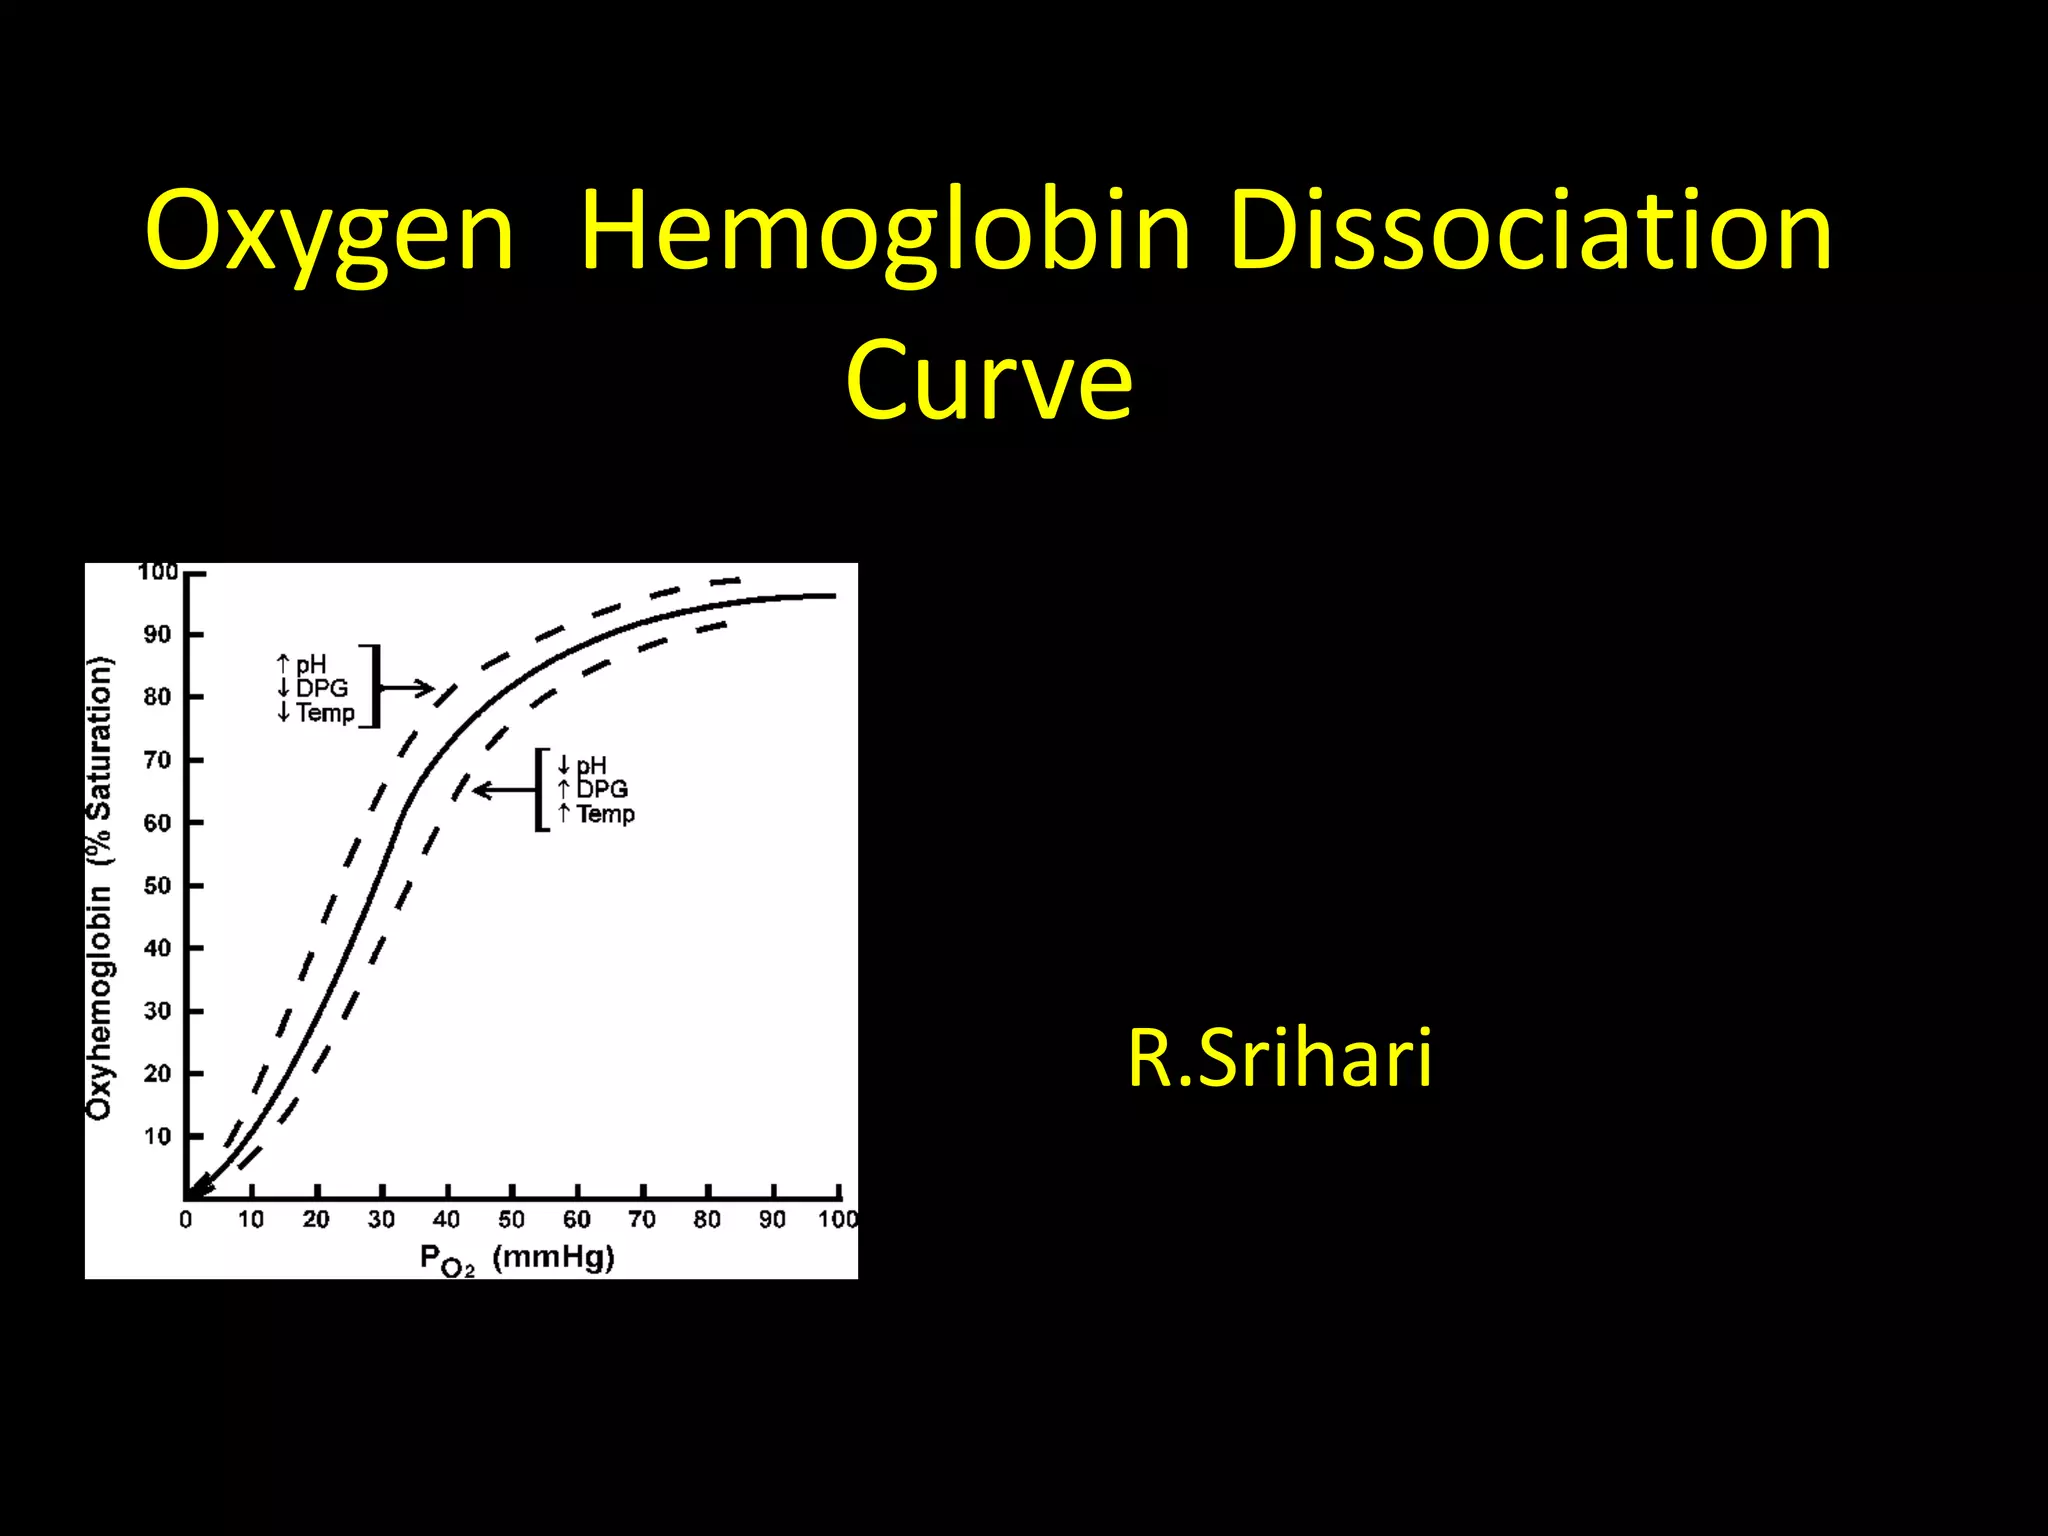
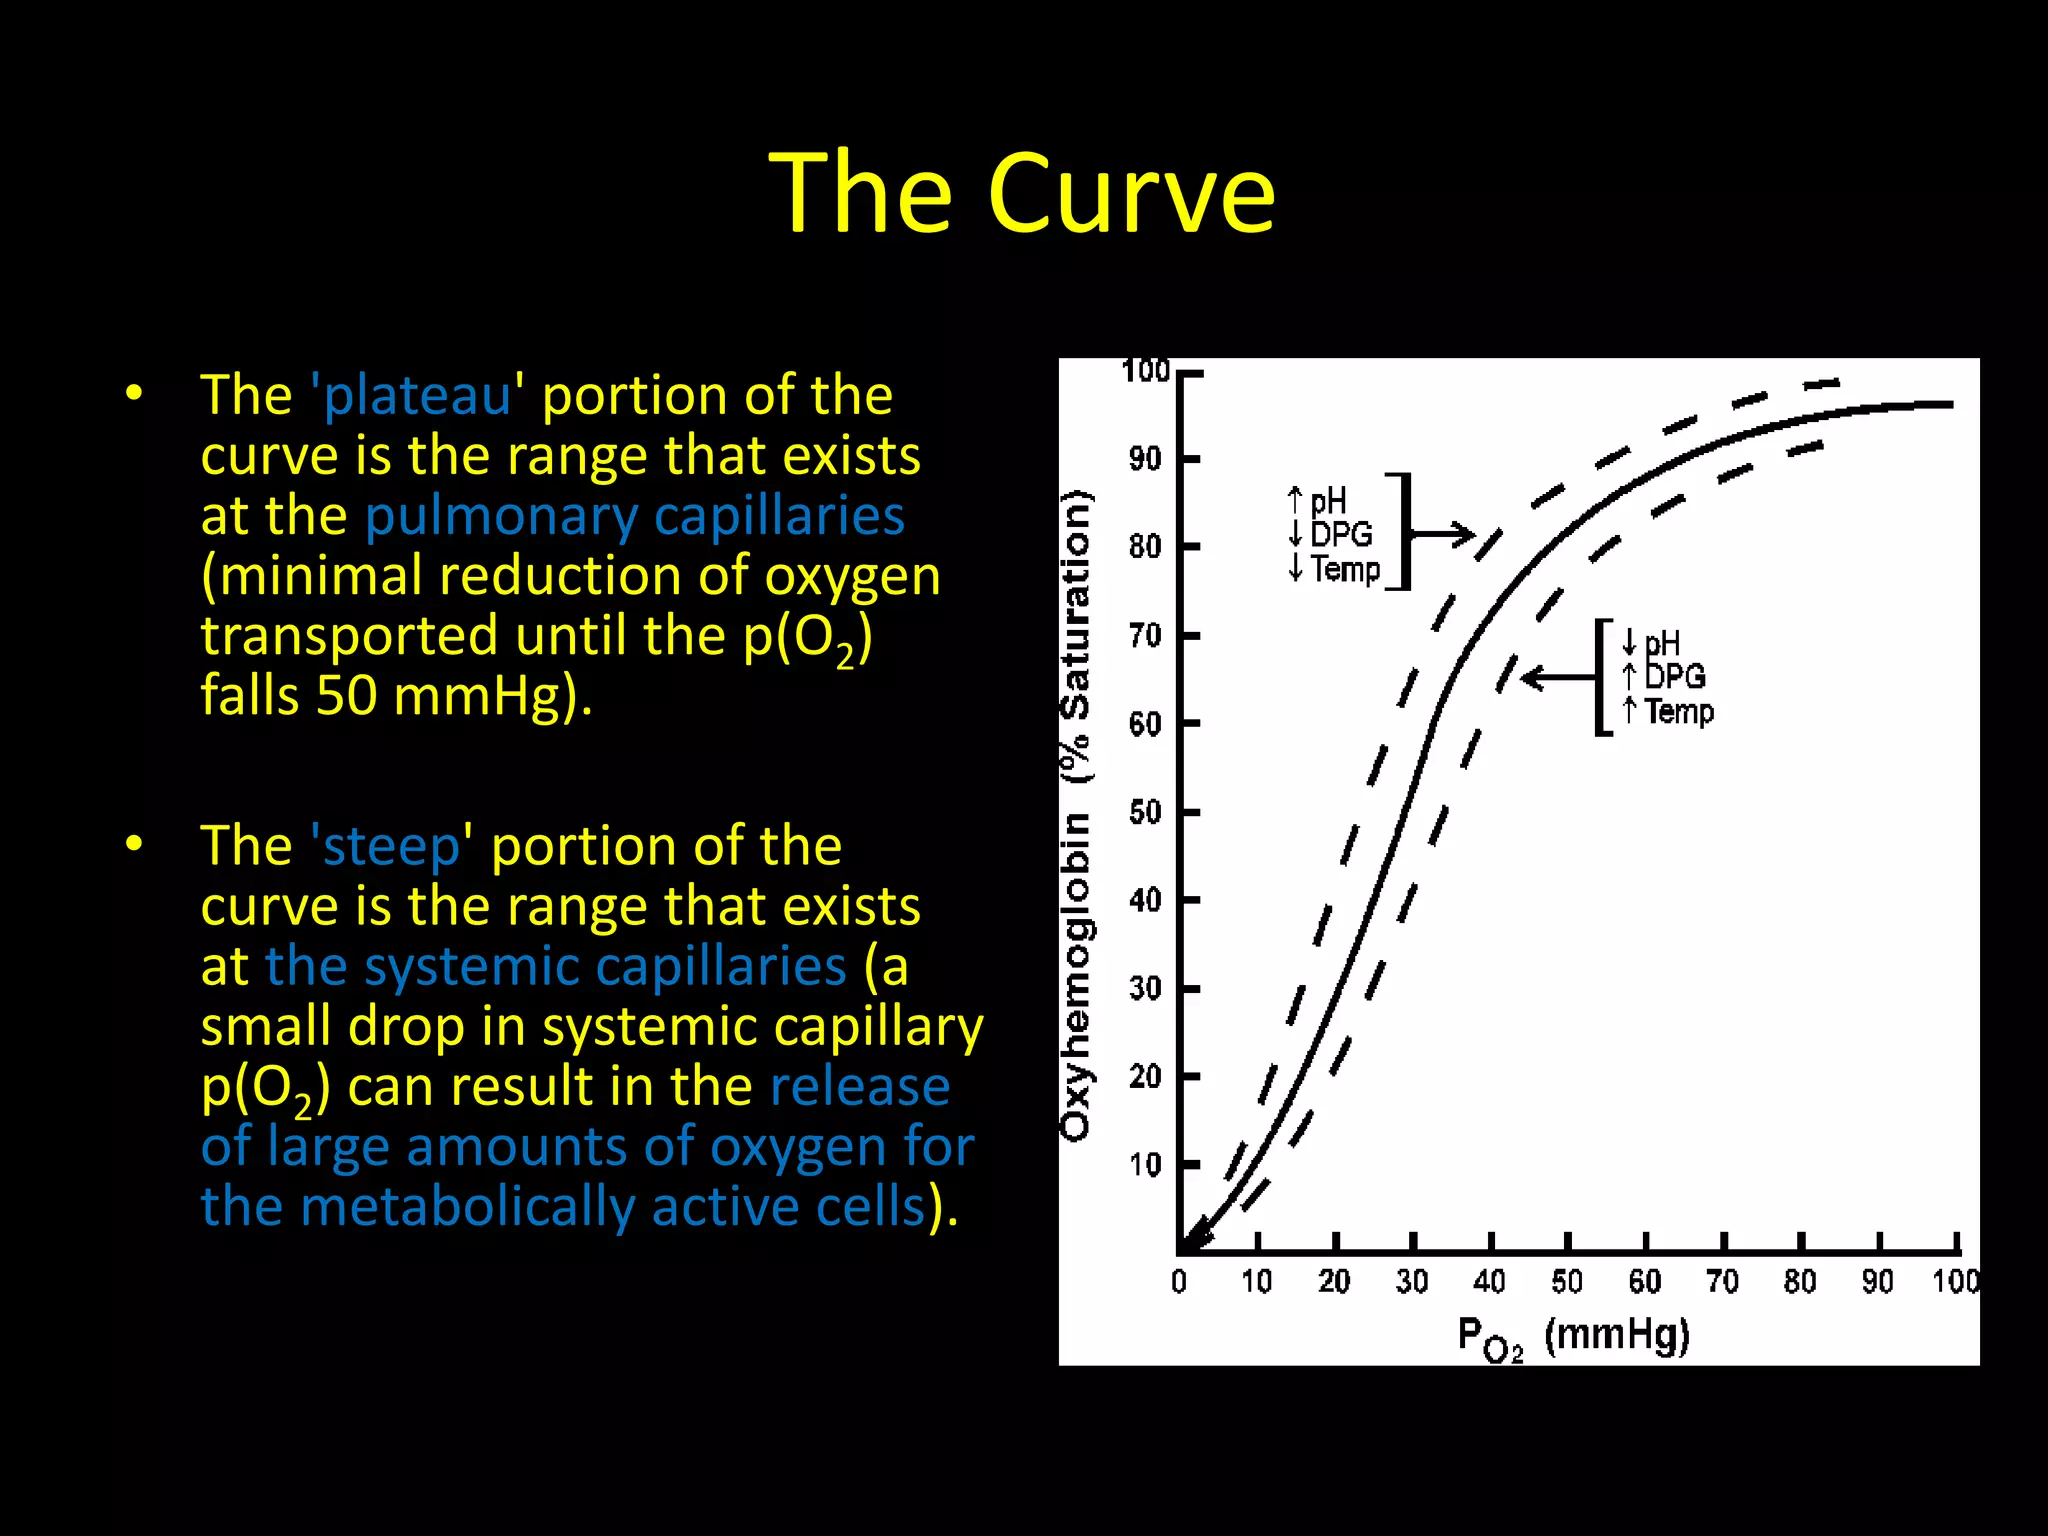
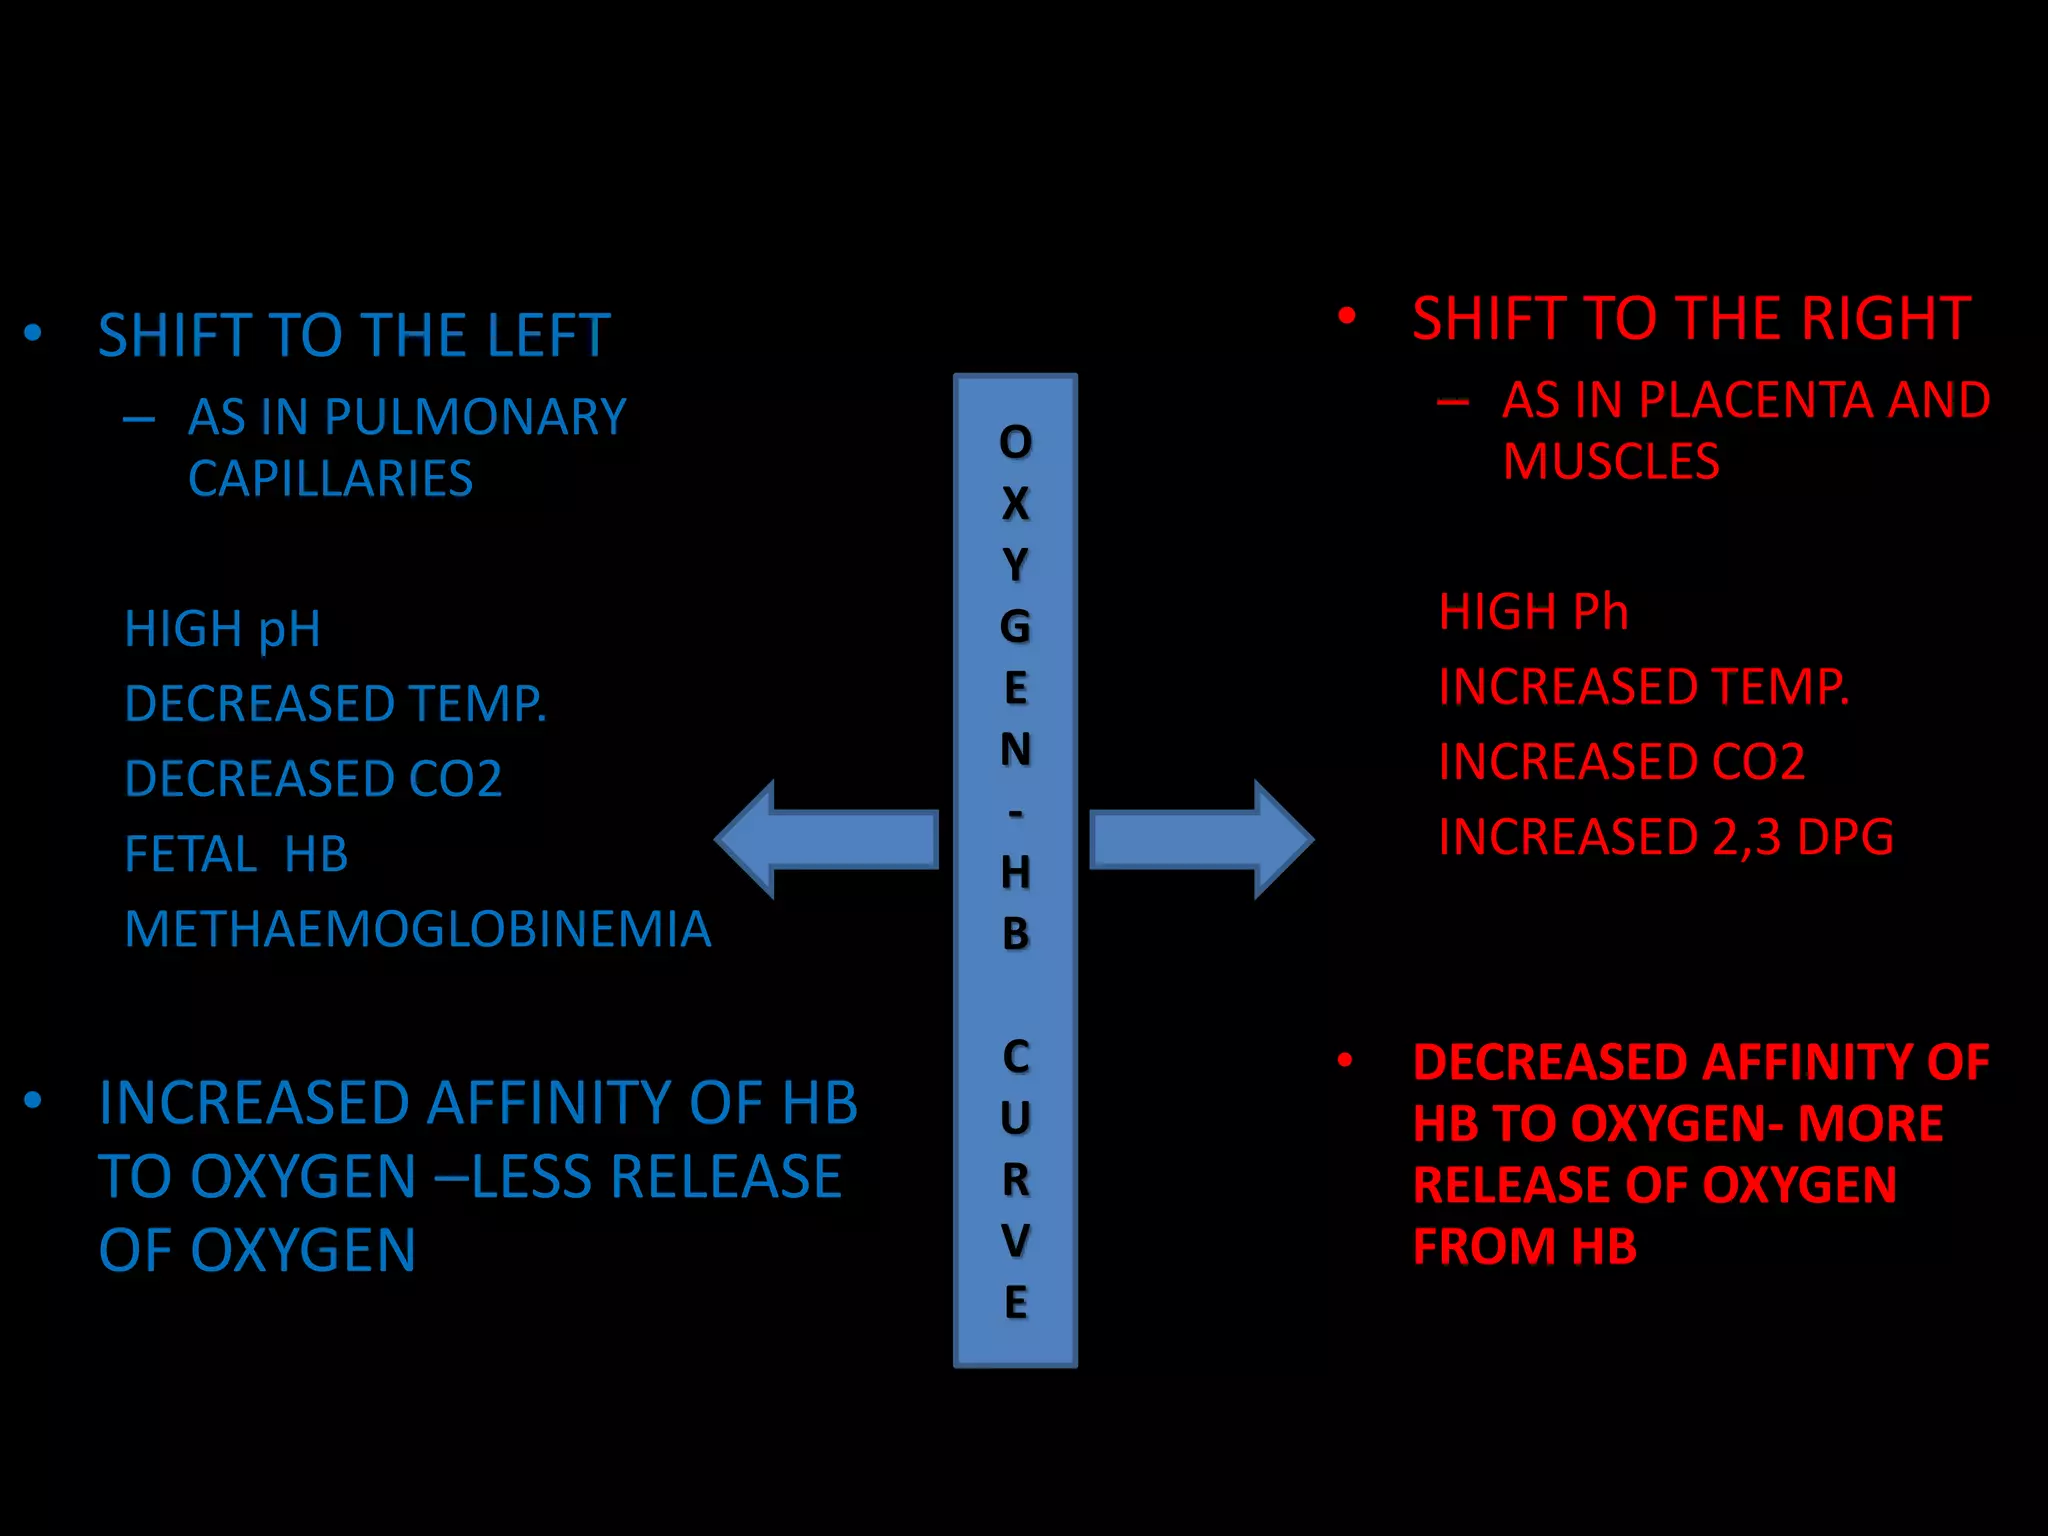
The document discusses the oxygen-hemoglobin dissociation curve, which plots the percentage of hemoglobin in its oxygen-saturated form against the partial pressure of oxygen. It shows how hemoglobin binds to oxygen in the lungs and releases it in tissues. The curve has a plateau section in the lungs where oxygen binding is not greatly affected by changes in pressure, and a steep section in tissues where small pressure drops release large amounts of oxygen. The P50 value indicates the partial pressure at which hemoglobin is 50% saturated and can shift based on conditions affecting hemoglobin's oxygen affinity.