AST SpaceMobile Inc (ASTS) Stock Analysis Report

AST SpaceMobile, Inc. operates space-based cellular broadband network for mobile phones. Its SpaceMobile service provides mobile broadband services for users traveling in and out of areas without terrestrial mobile services on land, at sea, or in flight. Based on the AST SpaceMobile Inc stock forecasts from 1 analysts, the average analyst target price for AST SpaceMobile Inc is USD 31.50 over the next 12 months. AST SpaceMobile Inc’s average analyst rating is Strong Buy. Stock Target Advisor’s own stock analysis of AST SpaceMobile Inc is Neutral, which is based on 4 positive signals and 4 negative signals. At the last closing, AST SpaceMobile Inc’s stock price was USD 7.13. AST SpaceMobile Inc’s stock price has changed by -4.30% over the past week, -3.91% over the past month and -5.44% over the last year.

Recommended
More Related Content
Similar to AST SpaceMobile Inc (ASTS) Stock Analysis Report
Similar to AST SpaceMobile Inc (ASTS) Stock Analysis Report (20)
More from Stock Target Advisor
More from Stock Target Advisor (20)
Recently uploaded
Recently uploaded (20)
AST SpaceMobile Inc (ASTS) Stock Analysis Report
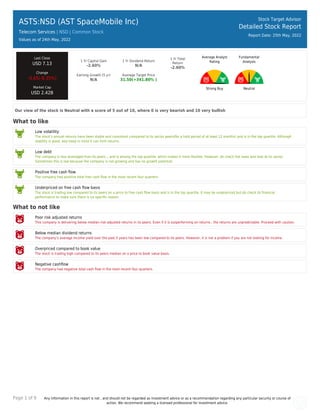
- 1. Page 1 of 9 Any information in this report is not , and should not be regarded as investment advice or as a recommendation regarding any particular security or course of action. We recommend seeking a licensed professional for investment advice. ASTS:NSD (AST SpaceMobile Inc) Telecom Services | NSD | Common Stock Values as of 24th May, 2022 Stock Target Advisor Detailed Stock Report Report Date: 25th May, 2022 Last Close USD 7.13 Change -0.65(-8.35%) Market Cap USD 2.42B 1 Yr Capital Gain -2.60% 1 Yr Dividend Return N/A 1 Yr Total Return -2.60% Earning Growth (5 yr) N/A Average Target Price 31.50(+341.80% ) Average Analyst Rating Strong Buy Fundamental Analysis Neutral Our view of the stock is Neutral with a score of 5 out of 10, where 0 is very bearish and 10 very bullish What to like Low volatility The stock’s annual returns have been stable and consistent compared to its sector peers(for a hold period of at least 12 months) and is in the top quartile. Although stability is good, also keep in mind it can limit returns. Low debt The company is less leveraged than its peers ,, and is among the top quartile, which makes it more flexible. However, do check the news and look at its sector. Sometimes this is low because the company is not growing and has no growth potential. Positive free cash flow The company had positive total free cash flow in the most recent four quarters. Underpriced on free cash flow basis The stock is trading low compared to its peers on a price to free cash flow basis and is in the top quartile. It may be underpriced but do check its financial performance to make sure there is no specific reason. What to not like Poor risk adjusted returns This company is delivering below median risk adjusted returns in its peers. Even if it is outperforming on returns , the returns are unpredictable. Proceed with caution. Below median dividend returns The company’s average income yield over the past 5 years has been low compared to its peers. However, it is not a problem if you are not looking for income. Overpriced compared to book value The stock is trading high compared to its peers median on a price to book value basis. Negative cashflow The company had negative total cash flow in the most recent four quarters.
- 2. Page 2 of 9 Any information in this report is not , and should not be regarded as investment advice or as a recommendation regarding any particular security or course of action. We recommend seeking a licensed professional for investment advice. ASTS:NSD (AST SpaceMobile Inc) Telecom Services | | Common Stock Stock Target Advisor Detailed Stock Report Report Date: 25th May, 2022 Adjusted Closing Share Volume Relative Returns Relative Performance (Total Returns) Security Capital Gain Dividend Return Total Return ASTS AST SpaceMobile Inc -5.4% 0 -5.4% QQQ Invesco QQQ Trust Series 1 -13.6% +0.4% -13.2% Company Overview AST SpaceMobile, Inc. operates space-based cellular broadband network for mobile phones. Its SpaceMobile service provides mobile broadband services for users traveling in and out of areas without terrestrial mobile services on land, at sea, or in flight. The company is headquartered in Midland, Texas. Address: Midland Intl. Air & Space Port, Midland, TX, United States, 79706
- 3. Page 3 of 9 Any information in this report is not , and should not be regarded as investment advice or as a recommendation regarding any particular security or course of action. We recommend seeking a licensed professional for investment advice. Company Website https://ast-science.com Address Midland Intl. Air & Space Port, Midland, TX, United States, 79706 Fiscal Year End December Employees 386 Technical Indicators Value Value Beta 0.63 52 Week High 15.48 Short Ratio 10.52 52 Week Low 4.84 Shorted Shares 7,995,068 200 Day Moving Average 9.15 Shorted Shares Previous Month 7,541,129 50 Day Moving Average 8.84 Shares Held By Insiders 2,480.80% Short Percentage 11.00% Shares Held by Institutions 26.57 Dividend Yield N/A
- 4. Page 4 of 9 Any information in this report is not , and should not be regarded as investment advice or as a recommendation regarding any particular security or course of action. We recommend seeking a licensed professional for investment advice. ASTS:NSD (AST SpaceMobile Inc) Telecom Services | | Common Stock Stock Target Advisor Detailed Stock Report Report Date: 25th May, 2022 Market Performance Market Performance vs. Industry / Classification (Telecom Services) Market Performance vs. Exchange (Nasdaq Global Select) Value Sector Median Percentile Rank Grade Market Median Percentile Rank Grade YTD Capital Gain -10.20% -20.7% 78% -21.2% 64% Dividend Return N/A 1.0% N/A 0.9% N/A Total Return -10.20% -17.1% 78% -20.6% 63% Trailing 12 Months Capital Gain -2.60% -29.1% 85% -21.0% 73% Dividend Return N/A 4.5% N/A 2.3% N/A Total Return -2.60% -28.3% 85% -19.4% 70% Trailing 5 Years Capital Gain N/A 33.4% N/A 4.0% N/A Dividend Return N/A 21.5% N/A 11.0% N/A Total Return N/A 34.5% N/A 15.1% N/A Average Annual (5 Year Horizon) Capital Gain -0.15% 6.2% 42% 2.9% 37% Dividend Return N/A 4.3% N/A 1.8% N/A Total Return -0.15% 9.9% 31% 4.8% 34% Risk Return Profile Volatility (Standard Deviation) 3.72% 32.9% 100% 32.2% 89% Risk Adjusted Return -4.00% N/A 31% 21.1% 34% Market Capitalization 2.42B 1.30B 73% 0.38B 81%
- 5. Page 5 of 9 Any information in this report is not , and should not be regarded as investment advice or as a recommendation regarding any particular security or course of action. We recommend seeking a licensed professional for investment advice. Key Financial Ratios Ratios vs. Industry / Classification (Computer Hardware) Ratios vs. Exchange (Nasdaq Global Select) Value Sector Median Percentile Rank Grade Market Median Percentile Rank Grade Market Value peratio N/A 20.2 N/A 16.0 N/A pbratio 3.7 1.9 21% 1.6 23% pcfratio -30.3 8.4 96% -0.1 84% pfcfratio 0.4 9.6 95% 10.1 90% Management Effectiveness retequity -51.62% -5.8% 8% 0.7% 23% retinvcap -40.08% -0.9% 7% -0.5% 24% retass -26.29% 1.0% 7% 0.2% 15% debtequityratio 1.42% 59.4% 79% 31.8% 85% Technical Ratios yield N/A 6.1% N/A 2.6% N/A sratio 10.52 3.72 11% 3.10 9% spercent 16.91% 2.9% 8% 2.9% 10% beta 0.63 1.03 78% 1.09 80%
- 6. Page 6 of 9 Any information in this report is not , and should not be regarded as investment advice or as a recommendation regarding any particular security or course of action. We recommend seeking a licensed professional for investment advice. ASTS:NSD (AST SpaceMobile Inc) Telecom Services | | Common Stock Stock Target Advisor Detailed Stock Report Report Date: 25th May, 2022 Recent Analyst Ratings Price Action Rating Action Analyst Rating Price date Maintains Deutsche Bank Capital Buy USD 32 » USD 31 2022-05-24 Target Lowered by Deutsche Bank Capital USD 35 » USD 32 2022-04-01 Initiates Coverage On Barclays Overweight USD 29 2021-07-12 Initiates Coverage On Deutsche Bank Capital Buy USD 35 2021-06-30
- 7. Page 7 of 9 Any information in this report is not , and should not be regarded as investment advice or as a recommendation regarding any particular security or course of action. We recommend seeking a licensed professional for investment advice. ASTS:NSD (AST SpaceMobile Inc) Telecom Services | | Common Stock Stock Target Advisor Detailed Stock Report Report Date: 25th May, 2022 Annual Financial (USD)
- 8. Page 8 of 9 Any information in this report is not , and should not be regarded as investment advice or as a recommendation regarding any particular security or course of action. We recommend seeking a licensed professional for investment advice. ASTS:NSD (AST SpaceMobile Inc) Telecom Services | | Common Stock Stock Target Advisor Detailed Stock Report Report Date: 25th May, 2022 Quarterly Financial (USD)
- 9. Page 9 of 9 Any information in this report is not , and should not be regarded as investment advice or as a recommendation regarding any particular security or course of action. We recommend seeking a licensed professional for investment advice. ASTS:NSD (AST SpaceMobile Inc) Telecom Services | | Common Stock Stock Target Advisor Detailed Stock Report Report Date: 25th May, 2022 Largest Industry Peers for Telecom Services Symbol Company Name Price(Change) Market Cap TMUS T-Mobile US Inc -0.67 (-0.5%) USD 158.00B VOD Vodafone Group Plc +0.55 (+3.4%) USD 43.20B LBRDK Liberty Broadband Corporation +0.83 (+0.7%) USD 19.17B LBRDA Liberty Broadband Corporation +0.74 (+0.7%) USD 19.17B GLIBA GCI Liberty, Inc N/A USD 9.71B GLIBP GCI Liberty, Inc N/A USD 7.11B VG Vonage Holdings Corp +0.05 (+0.3%) USD 4.94B IRDM Iridium Communications Inc -0.63 (-1.7%) USD 4.59B CCOI Cogent Communications Holdings.. +1.70 (+3.0%) USD 2.76B TIGO Millicom International Cellula.. -0.34 (-1.9%) USD 2.23B The Stock Target Advisor platform run millions of calculations every day on over 30,000 Canadian and American stocks, comparing and ranking their financial and market performance against their sectors and exchange. We represent the percentile ranking using the following grading system. Letter Grade Percentage Letter Grade Percentage Letter Grade Percentage A+ 97%-100% A 93%-96% A- 90%-92% B+ 97%-89% B 83%-86% B- 80%-82% C+ 77%-79% C 73%-76% C- 70%-72% D+ 67%-69% D 63%-66% D- 60%-62% F 0%-59%