Workday Inc (WDAY) Stock Analysis

Workday, Inc. provides enterprise cloud applications worldwide. Its applications help its customers to plan, execute, analyze, and extend to other applications and environments, and to manage their business and operations. The company offers a suite of financial management applications, which enable chief financial officers to maintain accounting information in the general ledger. Based on the Workday Inc stock forecasts from 28 analysts, the average analyst target price for Workday Inc is USD 260.52 over the next 12 months. Workday Inc’s average analyst rating is Strong Buy. Stock Target Advisor’s own stock analysis of Workday Inc is Neutral, which is based on 4 positive signals and 4 negative signals. At the last closing, Workday Inc’s stock price was USD 158.79. Workday Inc’s stock price has changed by -4.22% over the past week, -23.18% over the past month and -30.57% over the last year.

Recommended
Recommended
More Related Content
Similar to Workday Inc (WDAY) Stock Analysis
Similar to Workday Inc (WDAY) Stock Analysis (20)
More from Stock Target Advisor
More from Stock Target Advisor (20)
Recently uploaded
Recently uploaded (20)
Workday Inc (WDAY) Stock Analysis
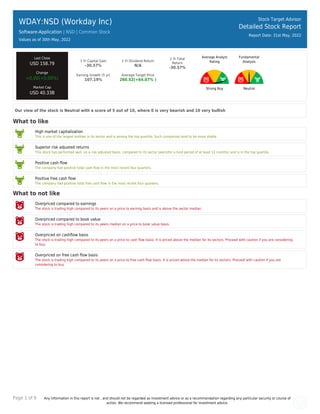
- 1. Page 1 of 9 Any information in this report is not , and should not be regarded as investment advice or as a recommendation regarding any particular security or course of action. We recommend seeking a licensed professional for investment advice. WDAY:NSD (Workday Inc) Software-Application | NSD | Common Stock Values as of 30th May, 2022 Stock Target Advisor Detailed Stock Report Report Date: 31st May, 2022 Last Close USD 158.79 Change +0.00(+0.00%) Market Cap USD 40.33B 1 Yr Capital Gain -30.57% 1 Yr Dividend Return N/A 1 Yr Total Return -30.57% Earning Growth (5 yr) 107.19% Average Target Price 260.52(+64.07% ) Average Analyst Rating Strong Buy Fundamental Analysis Neutral Our view of the stock is Neutral with a score of 5 out of 10, where 0 is very bearish and 10 very bullish What to like High market capitalization This is one of the largest entities in its sector and is among the top quartile. Such companies tend to be more stable. Superior risk adjusted returns This stock has performed well, on a risk adjusted basis, compared to its sector peers(for a hold period of at least 12 months) and is in the top quartile. Positive cash flow The company had positive total cash flow in the most recent four quarters. Positive free cash flow The company had positive total free cash flow in the most recent four quarters. What to not like Overpriced compared to earnings The stock is trading high compared to its peers on a price to earning basis and is above the sector median. Overpriced compared to book value The stock is trading high compared to its peers median on a price to book value basis. Overpriced on cashflow basis The stock is trading high compared to its peers on a price to cash flow basis. It is priced above the median for its sectors. Proceed with caution if you are considering to buy. Overpriced on free cash flow basis The stock is trading high compared to its peers on a price to free cash flow basis. It is priced above the median for its sectors. Proceed with caution if you are considering to buy.
- 2. Page 2 of 9 Any information in this report is not , and should not be regarded as investment advice or as a recommendation regarding any particular security or course of action. We recommend seeking a licensed professional for investment advice. WDAY:NSD (Workday Inc) Software-Application | | Common Stock Stock Target Advisor Detailed Stock Report Report Date: 31st May, 2022 Adjusted Closing Share Volume Relative Returns Relative Performance (Total Returns) Security Capital Gain Dividend Return Total Return WDAY Workday Inc -30.6% 0 -30.6% QQQ Invesco QQQ Trust Series 1 -7.4% +0.4% -7% Company Overview Workday, Inc. provides enterprise cloud applications worldwide. Its applications help its customers to plan, execute, analyze, and extend to other applications and environments, and to manage their business and operations. The company offers a suite of financial management applications, which enable chief financial officers to maintain accounting information in the general ledger; manage financial processes; identify real-time financial, operational, and management insights; enhance financial consolidation; reduce time-to-close; promote internal control and auditability; and achieve consistency across finance operations. It also provides cloud spend management solutions that helps organizations to streamline supplier selection and contracts, manage indirect spend, and build and execute sourcing events, such as requests for proposals; Human Capital Management (HCM) solution, a suite of human capital management applications that allows organizations to manage the entire employee lifecycle from recruitment to retirement, and enables HR teams to hire, onboard, pay, develop, reskill, and provide employee experiences; Workday applications for planning; and applications for analytics and reporting, including augmented analytics to surface insights to the line of business in simple-to-understand stories, machine learning to drive efficiency and automation, and benchmarks to compare performance against other companies. It serves professional and business services, financial services, healthcare, education, government, technology, media, retail, and hospitality industries. The company was formerly known as North Tahoe Power Tools, Inc. and changed its name to Workday, Inc. in July 2005. Workday, Inc. was incorporated in 2005 and is headquartered in Pleasanton, California.
- 3. Page 3 of 9 Any information in this report is not , and should not be regarded as investment advice or as a recommendation regarding any particular security or course of action. We recommend seeking a licensed professional for investment advice. Company Website https://www.workday.com Address 6110 Stoneridge Mall Road, Pleasanton, CA, United States, 94588 Fiscal Year End January Employees 15200 Technical Indicators Value Value Beta 1.38 52 Week High 307.81 Short Ratio 3.30 52 Week Low 149.06 Shorted Shares 8,409,741 200 Day Moving Average 246.73 Shorted Shares Previous Month 8,177,490 50 Day Moving Average 208.18 Shares Held By Insiders 85.40% Short Percentage 3.00% Shares Held by Institutions 91.93 Dividend Yield N/A
- 4. Page 4 of 9 Any information in this report is not , and should not be regarded as investment advice or as a recommendation regarding any particular security or course of action. We recommend seeking a licensed professional for investment advice. WDAY:NSD (Workday Inc) Software-Application | | Common Stock Stock Target Advisor Detailed Stock Report Report Date: 31st May, 2022 Market Performance Market Performance vs. Industry / Classification (Software-Application) Market Performance vs. Exchange (Nasdaq Global Select) Value Sector Median Percentile Rank Grade Market Median Percentile Rank Grade YTD Capital Gain -41.87% -35.5% 43% -16.9% 28% Dividend Return N/A 0.4% N/A 0.9% N/A Total Return -41.87% -35.5% 43% -16.3% 28% Trailing 12 Months Capital Gain -30.57% -39.8% 58% -18.7% 42% Dividend Return N/A 1.2% N/A 2.3% N/A Total Return -30.57% -39.8% 58% -17.2% 42% Trailing 5 Years Capital Gain 58.82% 20.3% 58% 8.7% 70% Dividend Return N/A 10.2% N/A 11.1% N/A Total Return 58.82% 22.3% 58% 19.5% 68% Average Annual (5 Year Horizon) Capital Gain 24.54% -6.1% 58% 2.6% 79% Dividend Return N/A 1.0% N/A 1.8% N/A Total Return 24.54% -6.1% 58% 4.5% 78% Risk Return Profile Volatility (Standard Deviation) 27.70% 34.0% 72% 32.2% 57% Risk Adjusted Return 88.60% N/A 88% 20.7% 95% Market Capitalization 40.33B 0.59B 97% 0.33B 98%
- 5. Page 5 of 9 Any information in this report is not , and should not be regarded as investment advice or as a recommendation regarding any particular security or course of action. We recommend seeking a licensed professional for investment advice. Key Financial Ratios Ratios vs. Industry / Classification (Computer Hardware) Ratios vs. Exchange (Nasdaq Global Select) Value Sector Median Percentile Rank Grade Market Median Percentile Rank Grade Market Value peratio 1,430.5 42.3 6% 16.6 1% pbratio 9.1 3.1 21% 1.6 9% pcfratio 24.4 12.1 37% 0.0 13% pfcfratio 105.7 18.5 11% 10.1 7% Management Effectiveness retequity -0.64% -9.8% 59% 0.6% 49% retinvcap -1.80% -4.6% 59% -0.5% 46% retass -0.88% -2.8% 57% 0.2% 45% debtequityratio 13.61% 44.6% 69% 31.8% 69% Technical Ratios yield N/A 1.5% N/A 2.6% N/A sratio 3.30 3.06 43% 3.07 47% spercent 4.26% 3.3% 37% 3.0% 40% beta 1.38 1.15 36% 1.09 31%
- 6. Page 6 of 9 Any information in this report is not , and should not be regarded as investment advice or as a recommendation regarding any particular security or course of action. We recommend seeking a licensed professional for investment advice. WDAY:NSD (Workday Inc) Software-Application | | Common Stock Stock Target Advisor Detailed Stock Report Report Date: 31st May, 2022 Recent Analyst Ratings Price Action Rating Action Analyst Rating Price date Maintains D.A. Davidson Buy USD 250 » USD 220 2022-05-27 Maintains BMO Financial Outperform USD 249 » USD 239 2022-05-27 Target Down Morgan Stanley USD 310 2022-05-27 Maintains Stifel Nicolaus Research Buy USD 275 » USD 220 2022-05-27 Maintains Piper Sandler Overweight USD 360 » USD 230 2022-05-27 Target Down Oppenheimer Holdings USD 190 2022-05-27 Target Lowered by Canaccord Capital Buy » Buy USD 325 » USD 200 2022-05-27 Maintains Mizuho Securities Buy USD 300 » USD 200 2022-05-27 Maintains Barclays Overweight USD 238 » USD 208 2022-05-27 Maintains JP Morgan & Company Overweight USD 280 » USD 235 2022-05-27 Maintains Wells Fargo Overweight USD 300 » USD 240 2022-05-27 Maintains KeyBanc Overweight USD 229 » USD 207 2022-05-27 Maintains Deutsche Bank Capital Buy USD 340 » USD 225 2022-05-27 Target Down Jefferies Financial LLC USD 200 2022-05-27 Target Lowered by Monness Crespi USD 200 2022-05-27 Maintains Robert W Baird Outperform USD 290 » USD 235 2022-05-27 Maintains UBS Neutral USD 185 » USD 170 2022-05-27 Maintains Credit Suisse Neutral USD 300 » USD 230 2022-05-27 Maintains Needham & Company LLC Buy USD 300 » USD 200 2022-05-27 Assigns STA Research Buy USD 205 2022-05-20 Target Down Monness Crespi NA USD 230 2022-05-18 Target Down Wells Fargo Overweight USD 300 2022-05-18 Target Down UBS NA USD 185 2022-05-17 Target Down BMO Financial NA USD 249 2022-05-17 Maintains Morgan Stanley Overweight USD 340 » USD 320 2022-05-16
- 7. Page 7 of 9 Any information in this report is not , and should not be regarded as investment advice or as a recommendation regarding any particular security or course of action. We recommend seeking a licensed professional for investment advice. WDAY:NSD (Workday Inc) Software-Application | | Common Stock Stock Target Advisor Detailed Stock Report Report Date: 31st May, 2022 Annual Financial (USD)
- 8. Page 8 of 9 Any information in this report is not , and should not be regarded as investment advice or as a recommendation regarding any particular security or course of action. We recommend seeking a licensed professional for investment advice. WDAY:NSD (Workday Inc) Software-Application | | Common Stock Stock Target Advisor Detailed Stock Report Report Date: 31st May, 2022 Quarterly Financial (USD)
- 9. Page 9 of 9 Any information in this report is not , and should not be regarded as investment advice or as a recommendation regarding any particular security or course of action. We recommend seeking a licensed professional for investment advice. WDAY:NSD (Workday Inc) Software-Application | | Common Stock Stock Target Advisor Detailed Stock Report Report Date: 31st May, 2022 Largest Industry Peers for Software-Application Symbol Company Name Price(Change) Market Cap INTU Intuit Inc N/A USD 105.03B ADSK Autodesk Inc N/A USD 45.98B TEAM Atlassian Corporation Plc N/A USD 43.28B CDNS Cadence Design Systems Inc N/A USD 43.08B ZM Zoom Video Communications Inc N/A USD 31.51B DDOG Datadog Inc N/A USD 27.95B ANSS ANSYS Inc N/A USD 23.02B TTD The Trade Desk Inc N/A USD 19.90B COIN Coinbase Global Inc N/A USD 19.73B NUAN Nuance Communications Inc N/A USD 17.88B ETFs Containing WDAY Symbol Company Name Weight Mer Price(Change) Market Cap VXF Vanguard Extended Market Index.. 0.64 % 0.07 % N/A USD 87.68B FDN First Trust Exchange-Traded Fu.. 0.00 % 0.52 % N/A USD 5.06B IGV 0.00 % 0.46 % N/A N/A CLOU Global X Funds - Global X Clou.. 0.00 % 0.00 % N/A USD 0.79B FDN:LSE First Trust Global Funds Plc -.. 0.00 % 0.00 % +36.40 (+0.0%) USD 0.03B FDNU:LSE First Trust Dow Jones Internet.. 0.00 % 0.00 % +0.54 (+0.0%) USD 0.03B CLDL Direxion Daily Cloud Computing.. 0.00 % 0.00 % N/A N/A WFH Direxion Work From Home ETF 0.00 % 0.00 % N/A N/A WCLD:LSE WisdomTree Cloud Computing UCI.. 0.00 % 0.00 % +1.09 (+0.0%) N/A KLWD:LSE WisdomTree Cloud Computing UCI.. 0.00 % 0.00 % N/A N/A The Stock Target Advisor platform run millions of calculations every day on over 30,000 Canadian and American stocks, comparing and ranking their financial and market performance against their sectors and exchange. We represent the percentile ranking using the following grading system. Letter Grade Percentage Letter Grade Percentage Letter Grade Percentage A+ 97%-100% A 93%-96% A- 90%-92% B+ 97%-89% B 83%-86% B- 80%-82% C+ 77%-79% C 73%-76% C- 70%-72% D+ 67%-69% D 63%-66% D- 60%-62% F 0%-59%