Rigel Pharmaceuticals Inc (RIGL) Stock Analysis Report

Rigel Pharmaceuticals, Inc., a biotechnology company, discovers and develops small molecule drugs to treat hematologic disorders, cancer, and rare immune diseases. Based on the Rigel Pharmaceuticals Inc stock forecasts from 5 analysts, the average analyst target price for Rigel Pharmaceuticals Inc is USD 3.25 over the next 12 months. Rigel Pharmaceuticals Inc’s average analyst rating is Buy . Stock Target Advisor’s own stock analysis of Rigel Pharmaceuticals Inc is Neutral, which is based on 3 positive signals and 3 negative signals. At the last closing, Rigel Pharmaceuticals Inc’s stock price was USD 0.70. Rigel Pharmaceuticals Inc’s stock price has changed by -59.77% over the past week, -68.47% over the past month and -82.46% over the last year.

Recommended
Recommended
More Related Content
Similar to Rigel Pharmaceuticals Inc (RIGL) Stock Analysis Report
Similar to Rigel Pharmaceuticals Inc (RIGL) Stock Analysis Report (20)
More from Stock Target Advisor
More from Stock Target Advisor (20)
Recently uploaded
Recently uploaded (20)
Rigel Pharmaceuticals Inc (RIGL) Stock Analysis Report
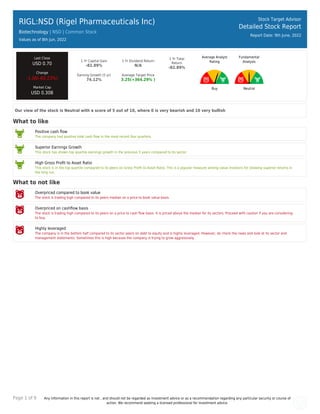
- 1. Page 1 of 9 Any information in this report is not , and should not be regarded as investment advice or as a recommendation regarding any particular security or course of action. We recommend seeking a licensed professional for investment advice. RIGL:NSD (Rigel Pharmaceuticals Inc) Biotechnology | NSD | Common Stock Values as of 8th Jun, 2022 Stock Target Advisor Detailed Stock Report Report Date: 9th June, 2022 Last Close USD 0.70 Change -1.06(-60.23%) Market Cap USD 0.30B 1 Yr Capital Gain -82.89% 1 Yr Dividend Return N/A 1 Yr Total Return -82.89% Earning Growth (5 yr) 74.12% Average Target Price 3.25(+364.29% ) Average Analyst Rating Buy Fundamental Analysis Neutral Our view of the stock is Neutral with a score of 5 out of 10, where 0 is very bearish and 10 very bullish What to like Positive cash flow The company had positive total cash flow in the most recent four quarters. Superior Earnings Growth This stock has shown top quartile earnings growth in the previous 5 years compared to its sector. High Gross Profit to Asset Ratio This stock is in the top quartile compared to its peers on Gross Profit to Asset Ratio. This is a popular measure among value investors for showing superior returns in the long run. What to not like Overpriced compared to book value The stock is trading high compared to its peers median on a price to book value basis. Overpriced on cashflow basis The stock is trading high compared to its peers on a price to cash flow basis. It is priced above the median for its sectors. Proceed with caution if you are considering to buy. Highly leveraged The company is in the bottom half compared to its sector peers on debt to equity and is highly leveraged. However, do check the news and look at its sector and management statements. Sometimes this is high because the company is trying to grow aggressively.
- 2. Page 2 of 9 Any information in this report is not , and should not be regarded as investment advice or as a recommendation regarding any particular security or course of action. We recommend seeking a licensed professional for investment advice. RIGL:NSD (Rigel Pharmaceuticals Inc) Biotechnology | | Common Stock Stock Target Advisor Detailed Stock Report Report Date: 9th June, 2022 Adjusted Closing Share Volume Relative Returns Relative Performance (Total Returns) Security Capital Gain Dividend Return Total Return RIGL Rigel Pharmaceuticals Inc -82.5% 0 -82.5% QQQ Invesco QQQ Trust -8.6% +0.4% -8.3% Company Overview Rigel Pharmaceuticals, Inc., a biotechnology company, discovers and develops small molecule drugs to treat hematologic disorders, cancer, and rare immune diseases. The company offers Tavalisse, an oral spleen tyrosine kinase inhibitor for the treatment of adult patients with chronic immune thrombocytopenia. It also develops Fostamatinib that is in phase III clinical trial for the treatment of warm autoimmune hemolytic anemia; phase III clinical trial for the treatment of hospitalized COVID-19 patients; and phase III clinical trial for the treatment of COVID-19. In addition, the company is developing R289, an oral interleukin receptor associated kinase 1/4 inhibitor, which is in phase I clinical trial for autoimmune, inflammatory, and hematology-oncology diseases; and R552, a receptor-interacting serine/threonine-protein kinase 1 inhibitor that has completed phase I clinical trial for autoimmune and inflammatory diseases. It has research and license agreements with AstraZeneca AB for the development and commercialization of R256, an inhaled JAK inhibitor; BerGenBio AS for the development and commercialization of AXL inhibitors in oncology; and Daiichi Sankyo to develop murine double minute 2 inhibitors for solid and hematological malignancies, as well as license and supply agreement with Kissei Pharmaceutical Co., Ltd. to develop and commercialize Fostamatinib. The company also has a license agreement and strategic collaboration with Eli Lilly and Company to co-develop and commercialize R552 for various indications, including autoimmune and inflammatory diseases, as well as other non-central nervous system (non-CNS) disease development candidates. Rigel Pharmaceuticals, Inc. was incorporated in 1996 and is headquartered in South San Francisco, California.
- 3. Page 3 of 9 Any information in this report is not , and should not be regarded as investment advice or as a recommendation regarding any particular security or course of action. We recommend seeking a licensed professional for investment advice. Company Website https://www.rigel.com Address 1180 Veterans Boulevard, South San Francisco, CA, United States, 94080 Fiscal Year End December Employees 165 Technical Indicators Value Value Beta 1.48 52 Week High 4.62 Short Ratio 3.88 52 Week Low 0.69 Shorted Shares 6,689,236 200 Day Moving Average 2.87 Shorted Shares Previous Month 6,630,152 50 Day Moving Average 2.38 Shares Held By Insiders 62.30% Short Percentage 10.00% Shares Held by Institutions 83.43 Dividend Yield N/A
- 4. Page 4 of 9 Any information in this report is not , and should not be regarded as investment advice or as a recommendation regarding any particular security or course of action. We recommend seeking a licensed professional for investment advice. RIGL:NSD (Rigel Pharmaceuticals Inc) Biotechnology | | Common Stock Stock Target Advisor Detailed Stock Report Report Date: 9th June, 2022 Market Performance Market Performance vs. Industry / Classification (Biotechnology) Market Performance vs. Exchange (Nasdaq Global Select) Value Sector Median Percentile Rank Grade Market Median Percentile Rank Grade YTD Capital Gain -73.58% -42.9% 9% -16.9% 7% Dividend Return N/A 1.0% N/A 1.0% N/A Total Return -73.58% -42.9% 9% -16.4% 7% Trailing 12 Months Capital Gain -82.89% -65.7% 18% -20.3% 10% Dividend Return N/A 1.6% N/A 2.3% N/A Total Return -82.89% -65.7% 18% -18.6% 10% Trailing 5 Years Capital Gain -70.46% -57.8% 40% 6.3% 13% Dividend Return N/A 13.9% N/A 10.9% N/A Total Return -70.46% -55.3% 40% 16.9% 12% Average Annual (5 Year Horizon) Capital Gain 8.23% 2.9% 56% 2.3% 61% Dividend Return N/A 9.4% N/A 1.8% N/A Total Return 8.23% 3.9% 55% 4.2% 58% Risk Return Profile Volatility (Standard Deviation) 50.77% 58.3% 57% 32.2% 29% Risk Adjusted Return 16.21% N/A 58% 20.5% 46% Market Capitalization 0.30B 0.12B 67% 0.33B 49%
- 5. Page 5 of 9 Any information in this report is not , and should not be regarded as investment advice or as a recommendation regarding any particular security or course of action. We recommend seeking a licensed professional for investment advice. Key Financial Ratios Ratios vs. Industry / Classification (Computer Hardware) Ratios vs. Exchange (Nasdaq Global Select) Value Sector Median Percentile Rank Grade Market Median Percentile Rank Grade Market Value peratio N/A 7.9 N/A 16.7 N/A pbratio 50.9 1.8 3% 1.6 2% pcfratio 51.5 -2.5 1% -0.1 6% pfcfratio N/A 0.6 N/A 10.1 N/A Management Effectiveness retequity -199.44% -57.0% 14% 0.4% 6% retinvcap -25.16% -54.2% 79% -0.5% 30% retass -28.93% -26.2% 42% 0.2% 13% debtequityratio 65.56% 20.7% 26% 31.7% 30% Technical Ratios yield N/A 1.9% N/A 2.6% N/A sratio 3.88 4.81 57% 3.05 40% spercent 4.56% 5.0% 55% 2.9% 38% beta 1.48 1.40 45% 1.09 27%
- 6. Page 6 of 9 Any information in this report is not , and should not be regarded as investment advice or as a recommendation regarding any particular security or course of action. We recommend seeking a licensed professional for investment advice. RIGL:NSD (Rigel Pharmaceuticals Inc) Biotechnology | | Common Stock Stock Target Advisor Detailed Stock Report Report Date: 9th June, 2022 Recent Analyst Ratings Price Action Rating Action Analyst Rating Price date Maintains HC Wainwright Buy USD 11 » USD 7 2022-06-08 Downgraded by Jefferies Financial LLC Buy » Hold 2022-06-08 Downgrade Cantor Fitzgerald Securities Overweight » Neutral USD 6 » USD 1 2022-06-08 Downgrade Piper Sandler Overweight » Neutral USD 7 » USD 1 2022-06-08 Initiated by B. Riley Neutral USD 4 2022-03-23 Reiterated by BMO Financial Buy USD 8 2021-11-08 Reiterated by HC Wainwright Buy USD 11 2021-06-29 Target Raised by HC Wainwright Buy USD 8 » USD 11 2021-02-18 Downgrades JP Morgan & Company Neutral 2020-11-09 Target Raised by Citigroup Buy USD 7 » USD 8 2020-08-06 Target Lowered by JP Morgan & Company Overweight USD 7 » USD 6 2020-05-27 Lowers Target Cantor Fitzgerald Securities Overweight USD 7 » USD 5 2019-11-16 Maintains Cantor Fitzgerald Securities Overweight USD 7 » USD 5 2019-11-15 Assumes JP Morgan & Company Overweight USD 7 2019-09-26 Reiterated Cantor Fitzgerald Securities Overweight USD 9 2019-03-01 Set Price Target Cantor Fitzgerald Securities Buy USD 7 2019-02-28 Set Price Target HC Wainwright Buy USD 8 2019-01-11 Reiterates Cantor Fitzgerald Securities Buy USD 9 2019-01-08 Set Price Target HC Wainwright Buy USD 8 2018-11-07 Set Price Target HC Wainwright Buy USD 8 2018-10-05 Set Price Target Cantor Fitzgerald Securities Buy USD 9 2018-10-03 Reiterates JP Morgan & Company Overweight USD 7 2018-09-04 Initiates Coverage On Citigroup Buy USD 8.5 2018-08-27 Set Price Target HC Wainwright Buy USD 8 2018-08-09 Reiterates Cantor Fitzgerald Securities Buy USD 9 2018-08-08
- 7. Page 7 of 9 Any information in this report is not , and should not be regarded as investment advice or as a recommendation regarding any particular security or course of action. We recommend seeking a licensed professional for investment advice. RIGL:NSD (Rigel Pharmaceuticals Inc) Biotechnology | | Common Stock Stock Target Advisor Detailed Stock Report Report Date: 9th June, 2022 Annual Financial (USD)
- 8. Page 8 of 9 Any information in this report is not , and should not be regarded as investment advice or as a recommendation regarding any particular security or course of action. We recommend seeking a licensed professional for investment advice. RIGL:NSD (Rigel Pharmaceuticals Inc) Biotechnology | | Common Stock Stock Target Advisor Detailed Stock Report Report Date: 9th June, 2022 Quarterly Financial (USD)
- 9. Page 9 of 9 Any information in this report is not , and should not be regarded as investment advice or as a recommendation regarding any particular security or course of action. We recommend seeking a licensed professional for investment advice. RIGL:NSD (Rigel Pharmaceuticals Inc) Biotechnology | | Common Stock Stock Target Advisor Detailed Stock Report Report Date: 9th June, 2022 Largest Industry Peers for Biotechnology Symbol Company Name Price(Change) Market Cap VRTX Vertex Pharmaceuticals Inc +2.68 (+1.0%) USD 69.53B REGN Regeneron Pharmaceuticals Inc -6.22 (-1.0%) USD 67.44B MRNA Moderna Inc +3.19 (+2.2%) USD 57.81B ALXN Alexion Pharmaceuticals Inc N/A USD 40.34B BNTX BioNTech SE +1.61 (+1.0%) USD 38.32B RPRX Royalty Pharma plc +0.17 (+0.4%) USD 27.86B SGEN Seagen Inc -0.07 (0.0%) USD 26.57B IMMU Immunomedics, Inc N/A USD 20.31B GMAB Genmab AS +0.30 (+1.0%) USD 19.73B ARGX argenx NV ADR +6.51 (+2.0%) USD 18.26B The Stock Target Advisor platform run millions of calculations every day on over 30,000 Canadian and American stocks, comparing and ranking their financial and market performance against their sectors and exchange. We represent the percentile ranking using the following grading system. Letter Grade Percentage Letter Grade Percentage Letter Grade Percentage A+ 97%-100% A 93%-96% A- 90%-92% B+ 97%-89% B 83%-86% B- 80%-82% C+ 77%-79% C 73%-76% C- 70%-72% D+ 67%-69% D 63%-66% D- 60%-62% F 0%-59%