Analyst ratings for ProShares Short Real Estate
•
0 likes•3 views

The fund invests in financial instruments that ProShare Advisors believes, in combination, should produce daily returns consistent with the fund's investment objective. Stock Target Advisor’s own stock analysis of ProShares Short Real Estate is Bearish, which is based on 1 positive signals and 3 negative signals. At the last closing, ProShares Short Real Estate’s stock price was USD 20.28. ProShares Short Real Estate’s stock price has changed by +5.02% over the past week, +6.23% over the past month and +8.23% over the last year.

Recommended
More Related Content
Similar to Analyst ratings for ProShares Short Real Estate
Similar to Analyst ratings for ProShares Short Real Estate (20)
More from Stock Target Advisor
More from Stock Target Advisor (20)
Recently uploaded
Recently uploaded (20)
Analyst ratings for ProShares Short Real Estate
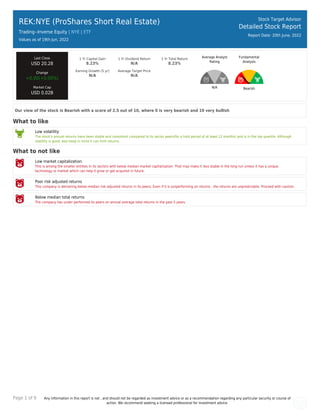
- 1. Page 1 of 9 Any information in this report is not , and should not be regarded as investment advice or as a recommendation regarding any particular security or course of action. We recommend seeking a licensed professional for investment advice. REK:NYE (ProShares Short Real Estate) Trading--Inverse Equity | NYE | ETF Values as of 19th Jun, 2022 Stock Target Advisor Detailed Stock Report Report Date: 20th June, 2022 Last Close USD 20.28 Change +0.00(+0.00%) Market Cap USD 0.02B 1 Yr Capital Gain 8.23% 1 Yr Dividend Return N/A 1 Yr Total Return 8.23% Earning Growth (5 yr) N/A Average Target Price N/A Average Analyst Rating N/A Fundamental Analysis Bearish Our view of the stock is Bearish with a score of 2.5 out of 10, where 0 is very bearish and 10 very bullish What to like Low volatility The stock’s annual returns have been stable and consistent compared to its sector peers(for a hold period of at least 12 months) and is in the top quartile. Although stability is good, also keep in mind it can limit returns. What to not like Low market capitalization This is among the smaller entities in its sectors with below median market capitalization. That may make it less stable in the long run unless it has a unique technology or market which can help it grow or get acquired in future. Poor risk adjusted returns This company is delivering below median risk adjusted returns in its peers. Even if it is outperforming on returns , the returns are unpredictable. Proceed with caution. Below median total returns The company has under performed its peers on annual average total returns in the past 5 years.
- 2. Page 2 of 9 Any information in this report is not , and should not be regarded as investment advice or as a recommendation regarding any particular security or course of action. We recommend seeking a licensed professional for investment advice. REK:NYE (ProShares Short Real Estate) Trading--Inverse Equity | | ETF Stock Target Advisor Detailed Stock Report Report Date: 20th June, 2022 Adjusted Closing Share Volume Relative Returns Relative Performance (Total Returns) Security Capital Gain Dividend Return Total Return REK ProShares Short Real Estate +8.2% 0 +8.2% VTI Vanguard Total Stock Market Index Fund ETF Shares -15.2% +1.4% -13.9% Company Overview The fund invests in financial instruments that ProShare Advisors believes, in combination, should produce daily returns consistent with the fund's investment objective. The index is designed to track the performance of REITs and other companies that invest directly or indirectly in real estate through development, management, or ownership, including property agencies. The fund is non-diversified.
- 3. Page 3 of 9 Any information in this report is not , and should not be regarded as investment advice or as a recommendation regarding any particular security or course of action. We recommend seeking a licensed professional for investment advice. Company Website http://www.proshares.com Technical Indicators Value Value Beta -0.84 52 Week High 20.55 Short Ratio 0.21 52 Week Low 15.78 Shorted Shares 2,592 200 Day Moving Average 17.46 Shorted Shares Previous Month N/A 50 Day Moving Average 18.06 Shares Held By Insiders N/A Short Percentage N/A Shares Held by Institutions N/A Dividend Yield N/A
- 4. Page 4 of 9 Any information in this report is not , and should not be regarded as investment advice or as a recommendation regarding any particular security or course of action. We recommend seeking a licensed professional for investment advice. REK:NYE (ProShares Short Real Estate) Trading--Inverse Equity | | ETF Stock Target Advisor Detailed Stock Report Report Date: 20th June, 2022 Market Performance Market Performance vs. Industry / Classification (Trading--Inverse Equity) Market Performance vs. Exchange (Nasdaq Global Select) Value Sector Median Percentile Rank Grade Market Median Percentile Rank Grade YTD Capital Gain 28.05% 37.7% 41% -18.4% 95% Dividend Return N/A N/A N/A 1.4% N/A Total Return 28.05% 37.7% 41% -17.2% 95% Trailing 12 Months Capital Gain 8.23% 11.5% 40% -16.0% 89% Dividend Return N/A N/A N/A 2.8% N/A Total Return 8.23% 11.5% 40% -13.2% 87% Trailing 5 Years Capital Gain -38.07% -75.7% 95% -0.8% 17% Dividend Return N/A 1.2% N/A 12.9% N/A Total Return -38.07% -74.5% 95% 14.5% 12% Average Annual (5 Year Horizon) Capital Gain -13.82% -25.2% 74% 4.5% 5% Dividend Return 0.39% 0.4% 45% 2.1% 9% Total Return -13.44% -24.6% 72% 7.7% 4% Risk Return Profile Volatility (Standard Deviation) 10.60% 24.4% 98% 22.9% 80% Risk Adjusted Return -126.83% N/A 36% 38.6% 1% Market Capitalization 0.02B 0.04B 40% 1.11B 5%
- 5. Page 5 of 9 Any information in this report is not , and should not be regarded as investment advice or as a recommendation regarding any particular security or course of action. We recommend seeking a licensed professional for investment advice. Key Financial Ratios Ratios vs. Industry / Classification (Computer Hardware) Ratios vs. Exchange (Nasdaq Global Select) Value Sector Median Percentile Rank Grade Market Median Percentile Rank Grade Market Value peratio N/A 17.6 N/A 15.7 N/A pbratio N/A 0.0 N/A 1.5 N/A pcfratio N/A 0.0 N/A 6.5 N/A pfcfratio N/A 0.0 N/A 10.7 N/A Management Effectiveness retequity N/A N/A N/A 9.9% N/A retinvcap N/A N/A N/A 5.6% N/A retass N/A N/A N/A 2.5% N/A debtequityratio N/A N/A N/A 68.6% N/A Technical Ratios yield N/A 0.0% N/A 3.2% N/A sratio 0.21 0.86 84% 2.07 88% spercent 30.00% 680.0% 90% 3.9% 20% beta -0.84 -1.60 14% 1.04 98%
- 6. Page 6 of 9 Any information in this report is not , and should not be regarded as investment advice or as a recommendation regarding any particular security or course of action. We recommend seeking a licensed professional for investment advice. REK:NYE (ProShares Short Real Estate) Trading--Inverse Equity | | ETF Stock Target Advisor Detailed Stock Report Report Date: 20th June, 2022 Recent Analyst Ratings No Analyst Data Available.
- 7. Page 7 of 9 Any information in this report is not , and should not be regarded as investment advice or as a recommendation regarding any particular security or course of action. We recommend seeking a licensed professional for investment advice. REK:NYE (ProShares Short Real Estate) Trading--Inverse Equity | | ETF Stock Target Advisor Detailed Stock Report Report Date: 20th June, 2022 Annual Financial (USD ) No record found.
- 8. Page 8 of 9 Any information in this report is not , and should not be regarded as investment advice or as a recommendation regarding any particular security or course of action. We recommend seeking a licensed professional for investment advice. REK:NYE (ProShares Short Real Estate) Trading--Inverse Equity | | ETF Stock Target Advisor Detailed Stock Report Report Date: 20th June, 2022 Quarterly Financial (USD ) No record found.
- 9. Page 9 of 9 Any information in this report is not , and should not be regarded as investment advice or as a recommendation regarding any particular security or course of action. We recommend seeking a licensed professional for investment advice. REK:NYE (ProShares Short Real Estate) Trading--Inverse Equity | | ETF Stock Target Advisor Detailed Stock Report Report Date: 20th June, 2022 Largest Industry Peers for Trading--Inverse Equity Symbol Company Name Price(Change) Market Cap SH ProShares Short S&P500 N/A USD 2.38B PSQ ProShares Short QQQ N/A USD 1.11B SDS ProShares UltraShort S&P500 N/A USD 0.80B SPXU ProShares UltraPro Short S&P50.. N/A USD 0.68B RWM ProShares Short Russell2000 N/A USD 0.48B SPXS Direxion Daily S&P 500® Bear .. N/A USD 0.42B TZA Direxion Daily Small Cap Bear .. N/A USD 0.38B QID ProShares UltraShort QQQ N/A USD 0.36B SPDN Direxion Daily S&P 500® Bear .. N/A USD 0.35B SDOW ProShares UltraPro Short Dow30 N/A USD 0.35B The Stock Target Advisor platform run millions of calculations every day on over 30,000 Canadian and American stocks, comparing and ranking their financial and market performance against their sectors and exchange. We represent the percentile ranking using the following grading system. Letter Grade Percentage Letter Grade Percentage Letter Grade Percentage A+ 97%-100% A 93%-96% A- 90%-92% B+ 97%-89% B 83%-86% B- 80%-82% C+ 77%-79% C 73%-76% C- 70%-72% D+ 67%-69% D 63%-66% D- 60%-62% F 0%-59%