ProShares Metaverse ETF
•
0 likes•3 views

Stock Target Advisor’s own stock analysis of ProShares Metaverse ETF is Very Bearish, which is based on 0 positive signals and 5 negative signals. At the last closing, ProShares Metaverse ETF’s stock price was USD 32.42. ProShares Metaverse ETF’s stock price has changed by -5.18% over the past week, -6.21% over the past month and +32,315.00% over the last year. Verseon Corporation, a pharmaceutical company, designs and develops novel therapeutics for various diseases in the United States.

Recommended
More Related Content
Similar to ProShares Metaverse ETF
Similar to ProShares Metaverse ETF (20)
More from Stock Target Advisor
More from Stock Target Advisor (20)
Recently uploaded
Recently uploaded (20)
ProShares Metaverse ETF
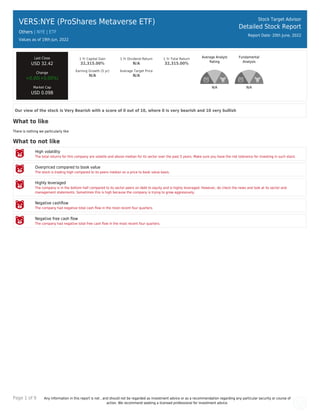
- 1. Page 1 of 9 Any information in this report is not , and should not be regarded as investment advice or as a recommendation regarding any particular security or course of action. We recommend seeking a licensed professional for investment advice. VERS:NYE (ProShares Metaverse ETF) Others | NYE | ETF Values as of 19th Jun, 2022 Stock Target Advisor Detailed Stock Report Report Date: 20th June, 2022 Last Close USD 32.42 Change +0.00(+0.00%) Market Cap USD 0.09B 1 Yr Capital Gain 32,315.00% 1 Yr Dividend Return N/A 1 Yr Total Return 32,315.00% Earning Growth (5 yr) N/A Average Target Price N/A Average Analyst Rating N/A Fundamental Analysis N/A Our view of the stock is Very Bearish with a score of 0 out of 10, where 0 is very bearish and 10 very bullish What to like There is nothing we particularly like What to not like High volatility The total returns for this company are volatile and above median for its sector over the past 5 years. Make sure you have the risk tolerance for investing in such stock. Overpriced compared to book value The stock is trading high compared to its peers median on a price to book value basis. Highly leveraged The company is in the bottom half compared to its sector peers on debt to equity and is highly leveraged. However, do check the news and look at its sector and management statements. Sometimes this is high because the company is trying to grow aggressively. Negative cashflow The company had negative total cash flow in the most recent four quarters. Negative free cash flow The company had negative total free cash flow in the most recent four quarters.
- 2. Page 2 of 9 Any information in this report is not , and should not be regarded as investment advice or as a recommendation regarding any particular security or course of action. We recommend seeking a licensed professional for investment advice. VERS:NYE (ProShares Metaverse ETF) Others | | ETF Stock Target Advisor Detailed Stock Report Report Date: 20th June, 2022 Adjusted Closing Share Volume Relative Returns Relative Performance (Total Returns) Security Capital Gain Dividend Return Total Return VERS ProShares Metaverse ETF +32315% 0 +32315% VTI Vanguard Total Stock Market Index Fund ETF Shares -15.2% +1.4% -13.9% Company Overview Verseon Corporation, a pharmaceutical company, designs and develops novel therapeutics for various diseases in the United States. The company is involved in developing oral anticoagulants for various cardiovascular indications with novel pharmacology; kallikrein inhibitors for the treatment of diabetic macular edema and hereditary angioedema; and novel angiogenesis inhibitors for the treatment of solid tumors, as well as metabolic disorders. Verseon Corporation was founded in 2002 and is headquartered in Fremont, California.
- 3. Page 3 of 9 Any information in this report is not , and should not be regarded as investment advice or as a recommendation regarding any particular security or course of action. We recommend seeking a licensed professional for investment advice. Technical Indicators Value Value Beta 0.19 52 Week High 1.22 Short Ratio N/A 52 Week Low 0.56 Shorted Shares N/A 200 Day Moving Average 0.93 Shorted Shares Previous Month N/A 50 Day Moving Average 0.77 Shares Held By Insiders N/A Short Percentage N/A Shares Held by Institutions N/A Dividend Yield 0.00%
- 4. Page 4 of 9 Any information in this report is not , and should not be regarded as investment advice or as a recommendation regarding any particular security or course of action. We recommend seeking a licensed professional for investment advice. VERS:NYE (ProShares Metaverse ETF) Others | | ETF Stock Target Advisor Detailed Stock Report Report Date: 20th June, 2022 Market Performance Market Performance vs. Industry / Classification (Others) Market Performance vs. Exchange (Nasdaq Global Select) Value Sector Median Percentile Rank Grade Market Median Percentile Rank Grade YTD Capital Gain 32,315.00% -20.7% 100% -18.4% 100% Dividend Return N/A 0.9% N/A 1.4% N/A Total Return 32,315.00% -20.1% 100% -17.2% 100% Trailing 12 Months Capital Gain 32,315.00% -17.2% 100% -16.0% 100% Dividend Return N/A 2.3% N/A 2.8% N/A Total Return 32,315.00% -15.0% 100% -13.2% 100% Trailing 5 Years Capital Gain N/A 379.9% N/A -0.8% N/A Dividend Return N/A 7.7% N/A 12.9% N/A Total Return N/A 379.9% N/A 14.5% N/A Average Annual (5 Year Horizon) Capital Gain 3,523.31% -0.1% 99% 4.5% 100% Dividend Return N/A 0.8% N/A 2.1% N/A Total Return 3,523.31% 0.1% 99% 7.7% 100% Risk Return Profile Volatility (Standard Deviation) 10,968.32% 10.4% 1% 22.9% 0% Risk Adjusted Return 32.12% N/A 63% 38.6% 42% Market Capitalization 0.09B 0.02B 66% 1.37B 16%
- 5. Page 5 of 9 Any information in this report is not , and should not be regarded as investment advice or as a recommendation regarding any particular security or course of action. We recommend seeking a licensed professional for investment advice. Key Financial Ratios Ratios vs. Industry / Classification (Computer Hardware) Ratios vs. Exchange (Nasdaq Global Select) Value Sector Median Percentile Rank Grade Market Median Percentile Rank Grade Market Value peratio N/A 25.5 N/A 15.7 N/A pbratio 3.9 3.1 46% 1.5 19% pcfratio -3.9 9.5 71% 6.5 85% pfcfratio -5.4 -5.2 67% 10.7 100% Management Effectiveness retequity -61.26% -31.1% 40% 9.9% 5% retinvcap -46.20% 5.1% 20% 5.6% 4% retass -24.69% -32.5% 71% 2.5% 2% debtequityratio 122.10% 122.1% 44% 68.6% 29% Technical Ratios yield N/A 2.0% N/A 3.2% N/A sratio N/A 2.40 N/A 2.07 N/A spercent N/A 120.0% N/A 3.9% N/A beta 0.19 0.96 87% 1.04 92%
- 6. Page 6 of 9 Any information in this report is not , and should not be regarded as investment advice or as a recommendation regarding any particular security or course of action. We recommend seeking a licensed professional for investment advice. VERS:NYE (ProShares Metaverse ETF) Others | | ETF Stock Target Advisor Detailed Stock Report Report Date: 20th June, 2022 Recent Analyst Ratings No Analyst Data Available.
- 7. Page 7 of 9 Any information in this report is not , and should not be regarded as investment advice or as a recommendation regarding any particular security or course of action. We recommend seeking a licensed professional for investment advice. VERS:NYE (ProShares Metaverse ETF) Others | | ETF Stock Target Advisor Detailed Stock Report Report Date: 20th June, 2022 Annual Financial (USD ) No record found.
- 8. Page 8 of 9 Any information in this report is not , and should not be regarded as investment advice or as a recommendation regarding any particular security or course of action. We recommend seeking a licensed professional for investment advice. VERS:NYE (ProShares Metaverse ETF) Others | | ETF Stock Target Advisor Detailed Stock Report Report Date: 20th June, 2022 Quarterly Financial (USD ) No record found.
- 9. Page 9 of 9 Any information in this report is not , and should not be regarded as investment advice or as a recommendation regarding any particular security or course of action. We recommend seeking a licensed professional for investment advice. VERS:NYE (ProShares Metaverse ETF) Others | | ETF Stock Target Advisor Detailed Stock Report Report Date: 20th June, 2022 Largest Industry Peers for Others Symbol Company Name Price(Change) Market Cap DTB DTB N/A USD 26.58B TIME Clockwise Capital Innovation E.. N/A USD 1.84B PFV Amplify YieldShares Senior Loa.. N/A USD 1.49B NRGU MicroSectors™ U.S. Big Oil I.. N/A USD 1.37B BWSN BWSN N/A USD 0.67B PTBD Pacer Trendpilot US Bond ETF N/A USD 0.67B SGL Strategic Global Income Fund I.. N/A USD 0.51B SCHJ Schwab 1-5 Year Corporate Bond.. N/A USD 0.36B OVL Overlay Shares Large Cap Equit.. N/A USD 0.23B DHG Deutsche High Income Opportuni.. N/A USD 0.23B The Stock Target Advisor platform run millions of calculations every day on over 30,000 Canadian and American stocks, comparing and ranking their financial and market performance against their sectors and exchange. We represent the percentile ranking using the following grading system. Letter Grade Percentage Letter Grade Percentage Letter Grade Percentage A+ 97%-100% A 93%-96% A- 90%-92% B+ 97%-89% B 83%-86% B- 80%-82% C+ 77%-79% C 73%-76% C- 70%-72% D+ 67%-69% D 63%-66% D- 60%-62% F 0%-59%