Microsoft Corporation

Microsoft Corporation develops, licenses, and supports software, services, devices, and solutions worldwide. Its Productivity and Business Processes segment offers Office, Exchange, SharePoint, Microsoft Teams, Office 365 Security and Compliance. Based on the Microsoft Corporation stock forecasts from 19 analysts, the average analyst target price for Microsoft Corporation is USD 346.94 over the next 12 months. Microsoft Corporation’s average analyst rating is Strong Buy. Stock Target Advisor’s own stock analysis of Microsoft Corporation is Slightly Bullish , which is based on 9 positive signals and 4 negative signals. At the last closing, Microsoft Corporation’s stock price was USD 247.65. Microsoft Corporation’s stock price has changed by -2.11% over the past week, -2.17% over the past month and -4.54% over the last year.

Recommended
Recommended
More Related Content
Similar to Microsoft Corporation
Similar to Microsoft Corporation (20)
More from Stock Target Advisor
More from Stock Target Advisor (20)
Recently uploaded
Recently uploaded (20)
Microsoft Corporation
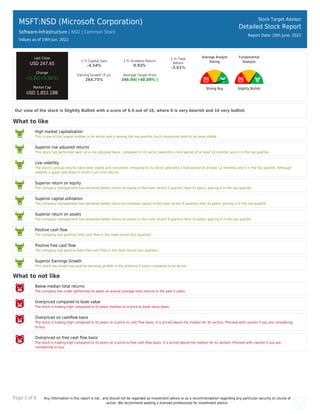
- 1. Page 1 of 9 Any information in this report is not , and should not be regarded as investment advice or as a recommendation regarding any particular security or course of action. We recommend seeking a licensed professional for investment advice. MSFT:NSD (Microsoft Corporation) Software-Infrastructure | NSD | Common Stock Values as of 19th Jun, 2022 Stock Target Advisor Detailed Stock Report Report Date: 20th June, 2022 Last Close USD 247.65 Change +0.00(+0.00%) Market Cap USD 1,852.18B 1 Yr Capital Gain -4.54% 1 Yr Dividend Return 0.93% 1 Yr Total Return -3.61% Earning Growth (5 yr) 264.75% Average Target Price 346.94(+40.09% ) Average Analyst Rating Strong Buy Fundamental Analysis Slightly Bullish Our view of the stock is Slightly Bullish with a score of 6.9 out of 10, where 0 is very bearish and 10 very bullish What to like High market capitalization This is one of the largest entities in its sector and is among the top quartile. Such companies tend to be more stable. Superior risk adjusted returns This stock has performed well, on a risk adjusted basis, compared to its sector peers(for a hold period of at least 12 months) and is in the top quartile. Low volatility The stock’s annual returns have been stable and consistent compared to its sector peers(for a hold period of at least 12 months) and is in the top quartile. Although stability is good, also keep in mind it can limit returns. Superior return on equity The company management has delivered better return on equity in the most recent 4 quarters than its peers, placing it in the top quartile. Superior capital utilization The company management has delivered better return on invested capital in the most recent 4 quarters than its peers, placing it in the top quartile. Superior return on assets The company management has delivered better return on assets in the most recent 4 quarters than its peers, placing it in the top quartile. Positive cash flow The company had positive total cash flow in the most recent four quarters. Positive free cash flow The company had positive total free cash flow in the most recent four quarters. Superior Earnings Growth This stock has shown top quartile earnings growth in the previous 5 years compared to its sector. What to not like Below median total returns The company has under performed its peers on annual average total returns in the past 5 years. Overpriced compared to book value The stock is trading high compared to its peers median on a price to book value basis. Overpriced on cashflow basis The stock is trading high compared to its peers on a price to cash flow basis. It is priced above the median for its sectors. Proceed with caution if you are considering to buy. Overpriced on free cash flow basis The stock is trading high compared to its peers on a price to free cash flow basis. It is priced above the median for its sectors. Proceed with caution if you are considering to buy.
- 2. Page 2 of 9 Any information in this report is not , and should not be regarded as investment advice or as a recommendation regarding any particular security or course of action. We recommend seeking a licensed professional for investment advice. MSFT:NSD (Microsoft Corporation) Software-Infrastructure | | Common Stock Stock Target Advisor Detailed Stock Report Report Date: 20th June, 2022 Adjusted Closing Share Volume Relative Returns Relative Performance (Total Returns) Security Capital Gain Dividend Return Total Return MSFT Microsoft Corporation -4.5% +0.9% -3.6% QQQ Invesco QQQ Trust -19.8% +0.4% -19.4% Company Overview Microsoft Corporation develops, licenses, and supports software, services, devices, and solutions worldwide. Its Productivity and Business Processes segment offers Office, Exchange, SharePoint, Microsoft Teams, Office 365 Security and Compliance, and Skype for Business, as well as related Client Access Licenses (CAL); Skype, Outlook.com, OneDrive, and LinkedIn; and Dynamics 365, a set of cloud-based and on- premises business solutions for organizations and enterprise divisions. Its Intelligent Cloud segment licenses SQL, Windows Servers, Visual Studio, System Center, and related CALs; GitHub that provides a collaboration platform and code hosting service for developers; and Azure, a cloud platform. It also offers support services and Microsoft consulting services to assist customers in developing, deploying, and managing Microsoft server and desktop solutions; and training and certification on Microsoft products. Its More Personal Computing segment provides Windows original equipment manufacturer (OEM) licensing and other non-volume licensing of the Windows operating system; Windows Commercial, such as volume licensing of the Windows operating system, Windows cloud services, and other Windows commercial offerings; patent licensing; Windows Internet of Things; and MSN advertising. It also offers Surface, PC accessories, PCs, tablets, gaming and entertainment consoles, and other devices; Gaming, including Xbox hardware, and Xbox content and services; video games and third-party video game royalties; and Search, including Bing and Microsoft advertising. It sells its products through OEMs, distributors, and resellers; and directly through digital marketplaces, online stores, and retail stores. It has collaborations with Dynatrace, Inc., Morgan Stanley, Micro Focus, WPP plc, ACI Worldwide, Inc., and iCIMS, Inc., as well as strategic relationships with Avaya Holdings Corp. and wejo Limited. Microsoft Corporation was founded in 1975 and is based in Redmond, Washington.
- 3. Page 3 of 9 Any information in this report is not , and should not be regarded as investment advice or as a recommendation regarding any particular security or course of action. We recommend seeking a licensed professional for investment advice. Company Website https://www.microsoft.com Address One Microsoft Way, Redmond, WA, United States, 98052-6399 Fiscal Year End June Employees 181000 Technical Indicators Value Value Beta 0.94 52 Week High 348.14 Short Ratio 1.30 52 Week Low 241.51 Shorted Shares 46,001,375 200 Day Moving Average 300.45 Shorted Shares Previous Month 38,428,490 50 Day Moving Average 270.41 Shares Held By Insiders 7.50% Short Percentage 1.00% Shares Held by Institutions 71.83 Dividend Yield 1.00%
- 4. Page 4 of 9 Any information in this report is not , and should not be regarded as investment advice or as a recommendation regarding any particular security or course of action. We recommend seeking a licensed professional for investment advice. MSFT:NSD (Microsoft Corporation) Software-Infrastructure | | Common Stock Stock Target Advisor Detailed Stock Report Report Date: 20th June, 2022 Market Performance Market Performance vs. Industry / Classification (Software-Infrastructure) Market Performance vs. Exchange (Nasdaq Global Select) Value Sector Median Percentile Rank Grade Market Median Percentile Rank Grade YTD Capital Gain -26.36% -36.8% 70% -24.9% 48% Dividend Return 0.37% 0.5% 25% 1.1% 17% Total Return -26.00% -36.8% 70% -24.2% 48% Trailing 12 Months Capital Gain -4.54% -36.0% 80% -26.5% 74% Dividend Return 0.93% 1.9% 20% 2.4% 19% Total Return -3.61% -36.0% 80% -25.0% 73% Trailing 5 Years Capital Gain 254.24% 13.5% 84% -0.5% 93% Dividend Return 14.38% 12.0% 100% 10.9% 68% Total Return 268.62% 13.5% 87% 10.2% 93% Average Annual (5 Year Horizon) Capital Gain 37.64% 16.1% 75% 1.9% 86% Dividend Return 1.52% 2.2% 17% 1.8% 43% Total Return 39.17% 16.1% 75% 3.7% 86% Risk Return Profile Volatility (Standard Deviation) 14.38% 37.8% 96% 32.1% 78% Risk Adjusted Return 272.30% N/A 100% 19.4% 100% Market Capitalization 1,852.18B 1.03B 100% 0.34B 100%
- 5. Page 5 of 9 Any information in this report is not , and should not be regarded as investment advice or as a recommendation regarding any particular security or course of action. We recommend seeking a licensed professional for investment advice. Key Financial Ratios Ratios vs. Industry / Classification (Computer Hardware) Ratios vs. Exchange (Nasdaq Global Select) Value Sector Median Percentile Rank Grade Market Median Percentile Rank Grade Market Value peratio 25.9 35.2 57% 15.8 32% pbratio 11.6 4.4 23% 1.6 6% pcfratio 24.1 12.9 32% 0.0 12% pfcfratio 18.7 24.8 58% 9.6 29% Management Effectiveness retequity 48.72% -17.7% 96% 0.5% 96% retinvcap 31.48% -4.7% 88% -0.5% 93% retass 15.67% -4.0% 99% 0.2% 97% debtequityratio 35.27% 51.3% 58% 32.2% 48% Technical Ratios yield 1.00% 1.9% 20% 2.7% 15% sratio 1.30 3.31 88% 3.04 74% spercent 0.62% 3.5% 94% 3.1% 80% beta 0.94 1.10 62% 1.09 62%
- 6. Page 6 of 9 Any information in this report is not , and should not be regarded as investment advice or as a recommendation regarding any particular security or course of action. We recommend seeking a licensed professional for investment advice. MSFT:NSD (Microsoft Corporation) Software-Infrastructure | | Common Stock Stock Target Advisor Detailed Stock Report Report Date: 20th June, 2022 Recent Analyst Ratings Price Action Rating Action Analyst Rating Price date Maintains Jefferies Financial LLC Buy USD 325 » USD 320 2022-06-13 Maintains Barclays Overweight USD 363 » USD 335 2022-06-10 Target Up STA Research Hold USD 300 2022-06-03 Target Lowered by Stifel Nicolaus Research USD 350 » USD 320 2022-06-02 Maintains Jefferies Financial LLC Buy USD 400 » USD 325 2022-05-23 Target Set by RBC Royalbank USD 380 2022-05-20 Adjusts STA Research Hold USD 282 2022-05-20 Target Down Fundamental Research Hold USD 299.93 » USD 298 2022-05-03 Target Set by JP Morgan & Company USD 320 2022-04-28 Target Set by Goldman Sachs USD 365 2022-04-28 Maintains STA Research Strong Buy USD 339 2022-04-27 Target Raised by Citigroup USD 355 » USD 364 2022-04-27 Target Lowered by Wedbush USD 375 » USD 340 2022-04-27 Target Raised by Wolfe Research USD 330 » USD 350 2022-04-27 Target Lowered by Evercore ISI Inline USD 370 » USD 330 2022-04-27 Target Lowered by Stifel Nicolaus Research USD 380 » USD 350 2022-04-27 Target Lowered by Deutsche Bank Capital USD 390 » USD 350 2022-04-27 Target Lowered by BMO Financial Outperform USD 355 » USD 340 2022-04-26 Maintains STA Research Strong Buy USD 339 2022-04-19 Target Lowered by Citigroup USD 386 » USD 355 2022-04-19 Upgrade STA Research Strong Buy USD 300 » USD 339 2022-03-09 Maintains Tigress Financial Buy USD 366 » USD 411 2022-02-04 Target Set by JP Morgan & Company USD 320 2022-01-26 Maintains Oppenheimer Holdings Outperform USD 330 » USD 340 2022-01-26 Target Raised by Citigroup Buy USD 376 » USD 386 2022-01-26
- 7. Page 7 of 9 Any information in this report is not , and should not be regarded as investment advice or as a recommendation regarding any particular security or course of action. We recommend seeking a licensed professional for investment advice. MSFT:NSD (Microsoft Corporation) Software-Infrastructure | | Common Stock Stock Target Advisor Detailed Stock Report Report Date: 20th June, 2022 Annual Financial (USD)
- 8. Page 8 of 9 Any information in this report is not , and should not be regarded as investment advice or as a recommendation regarding any particular security or course of action. We recommend seeking a licensed professional for investment advice. MSFT:NSD (Microsoft Corporation) Software-Infrastructure | | Common Stock Stock Target Advisor Detailed Stock Report Report Date: 20th June, 2022 Quarterly Financial (USD)
- 9. Page 9 of 9 Any information in this report is not , and should not be regarded as investment advice or as a recommendation regarding any particular security or course of action. We recommend seeking a licensed professional for investment advice. MSFT:NSD (Microsoft Corporation) Software-Infrastructure | | Common Stock Stock Target Advisor Detailed Stock Report Report Date: 20th June, 2022 Largest Industry Peers for Software-Infrastructure Symbol Company Name Price(Change) Market Cap ADBE Adobe Systems Incorporated N/A USD 170.47B PANW Palo Alto Networks Inc N/A USD 47.69B SNPS Synopsys Inc N/A USD 45.31B FTNT Fortinet Inc N/A USD 43.18B CRWD Crowdstrike Holdings Inc N/A USD 38.04B ZS Zscaler Inc N/A USD 20.46B VRSN VeriSign Inc N/A USD 17.26B MDB MongoDB N/A USD 17.01B CHKP Check Point Software Technolog.. N/A USD 15.30B AKAM Akamai Technologies Inc N/A USD 14.35B ETFs Containing MSFT Symbol Company Name Weight Mer Price(Change) Market Cap QQQ:PA Invesco EQQQ NASDAQ-100 UCITS .. 11.76 % 0.00 % N/A USD 5.41B VONE Vanguard Russell 1000 Index Fu.. 5.52 % 0.12 % N/A USD 4.99B RUD.U:CA 5.19 % 0.43 % N/A N/A VTHR Vanguard Russell 3000 Index Fu.. 5.19 % 0.15 % N/A USD 2.05B VTI Vanguard Total Stock Market In.. 5.09 % 0.03 % N/A USD 1,207.96B ZSP.U:CA 4.29 % 0.09 % N/A N/A KOKU Xtrackers MSCI Kokusai Equity .. 3.90 % 0.00 % N/A N/A XDEQ:XETRA Xtrackers (IE) Public Limited .. 3.53 % 0.00 % N/A USD 0.93B XDEQ:F Xtrackers (IE) Public Limited .. 3.53 % 0.00 % N/A USD 0.83B VIDG Defiance NextGen Video Gaming .. 3.32 % 0.52 % N/A USD 3.70M The Stock Target Advisor platform run millions of calculations every day on over 30,000 Canadian and American stocks, comparing and ranking their financial and market performance against their sectors and exchange. We represent the percentile ranking using the following grading system. Letter Grade Percentage Letter Grade Percentage Letter Grade Percentage A+ 97%-100% A 93%-96% A- 90%-92% B+ 97%-89% B 83%-86% B- 80%-82% C+ 77%-79% C 73%-76% C- 70%-72% D+ 67%-69% D 63%-66% D- 60%-62% F 0%-59%