TSLA Stock Report Summary
•
0 likes•26 views

This report provides a summary of key information about Tesla Inc. (TSLA) stock as of June 7th, 2022. It finds the stock slightly bullish overall with a score of 6/10. Positives include high market cap, superior returns and profitability ratios, and strong earnings growth. Negatives include high volatility, and the stock being overpriced on various valuation metrics. Analyst ratings are mostly positive with an average price target above the current price. Financial statements show rising revenue and shifting to profitability in recent years.

Recommended
More Related Content
Similar to TSLA Stock Report Summary
Similar to TSLA Stock Report Summary (20)
More from Stock Target Advisor
More from Stock Target Advisor (20)
Recently uploaded
Recently uploaded (20)
TSLA Stock Report Summary
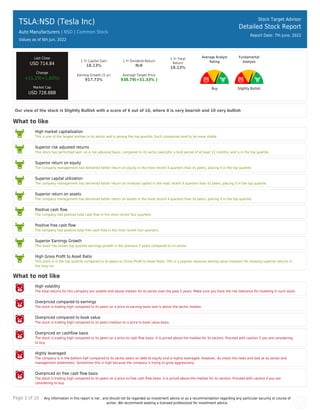
- 1. Page 1 of 10 Any information in this report is not , and should not be regarded as investment advice or as a recommendation regarding any particular security or course of action. We recommend seeking a licensed professional for investment advice. TSLA:NSD (Tesla Inc) Auto Manufacturers | NSD | Common Stock Values as of 6th Jun, 2022 Stock Target Advisor Detailed Stock Report Report Date: 7th June, 2022 Last Close USD 714.84 Change +11.29(+1.60%) Market Cap USD 728.88B 1 Yr Capital Gain 18.13% 1 Yr Dividend Return N/A 1 Yr Total Return 18.13% Earning Growth (5 yr) 917.73% Average Target Price 938.79(+31.33% ) Average Analyst Rating Buy Fundamental Analysis Slightly Bullish Our view of the stock is Slightly Bullish with a score of 6 out of 10, where 0 is very bearish and 10 very bullish What to like High market capitalization This is one of the largest entities in its sector and is among the top quartile. Such companies tend to be more stable. Superior risk adjusted returns This stock has performed well, on a risk adjusted basis, compared to its sector peers(for a hold period of at least 12 months) and is in the top quartile. Superior return on equity The company management has delivered better return on equity in the most recent 4 quarters than its peers, placing it in the top quartile. Superior capital utilization The company management has delivered better return on invested capital in the most recent 4 quarters than its peers, placing it in the top quartile. Superior return on assets The company management has delivered better return on assets in the most recent 4 quarters than its peers, placing it in the top quartile. Positive cash flow The company had positive total cash flow in the most recent four quarters. Positive free cash flow The company had positive total free cash flow in the most recent four quarters. Superior Earnings Growth This stock has shown top quartile earnings growth in the previous 5 years compared to its sector. High Gross Profit to Asset Ratio This stock is in the top quartile compared to its peers on Gross Profit to Asset Ratio. This is a popular measure among value investors for showing superior returns in the long run. What to not like High volatility The total returns for this company are volatile and above median for its sector over the past 5 years. Make sure you have the risk tolerance for investing in such stock. Overpriced compared to earnings The stock is trading high compared to its peers on a price to earning basis and is above the sector median. Overpriced compared to book value The stock is trading high compared to its peers median on a price to book value basis. Overpriced on cashflow basis The stock is trading high compared to its peers on a price to cash flow basis. It is priced above the median for its sectors. Proceed with caution if you are considering to buy. Highly leveraged The company is in the bottom half compared to its sector peers on debt to equity and is highly leveraged. However, do check the news and look at its sector and management statements. Sometimes this is high because the company is trying to grow aggressively. Overpriced on free cash flow basis The stock is trading high compared to its peers on a price to free cash flow basis. It is priced above the median for its sectors. Proceed with caution if you are considering to buy.
- 2. Page 2 of 10 Any information in this report is not , and should not be regarded as investment advice or as a recommendation regarding any particular security or course of action. We recommend seeking a licensed professional for investment advice.
- 3. Page 3 of 10 Any information in this report is not , and should not be regarded as investment advice or as a recommendation regarding any particular security or course of action. We recommend seeking a licensed professional for investment advice. TSLA:NSD (Tesla Inc) Auto Manufacturers | | Common Stock Stock Target Advisor Detailed Stock Report Report Date: 7th June, 2022 Adjusted Closing Share Volume Relative Returns Relative Performance (Total Returns) Security Capital Gain Dividend Return Total Return TSLA Tesla Inc +19.3% 0 +19.3% QQQ Invesco QQQ Trust -8.5% +0.4% -8.1% Company Overview Tesla, Inc. designs, develops, manufactures, leases, and sells electric vehicles, and energy generation and storage systems in the United States, China, and internationally. The company operates in two segments, Automotive, and Energy Generation and Storage. The Automotive segment offers electric vehicles, as well as sells automotive regulatory credits. It provides sedans and sport utility vehicles through direct and used vehicle sales, a network of Tesla Superchargers, and in-app upgrades; and purchase financing and leasing services. This segment is also involved in the provision of non-warranty after-sales vehicle services, sale of used vehicles, retail merchandise, and vehicle insurance, as well as sale of products to third party customers; services for electric vehicles through its company-owned service locations, and Tesla mobile service technicians; and vehicle limited warranties and extended service plans. The Energy Generation and Storage segment engages in the design, manufacture, installation, sale, and leasing of solar energy generation and energy storage products, and related services to residential, commercial, and industrial customers and utilities through its website, stores, and galleries, as well as through a network of channel partners. This segment also offers service and repairs to its energy product customers, including under warranty; and various financing options to its solar customers. The company was formerly known as Tesla Motors, Inc. and changed its name to Tesla, Inc. in February 2017. Tesla, Inc. was incorporated in 2003 and is headquartered in Austin, Texas.
- 4. Page 4 of 10 Any information in this report is not , and should not be regarded as investment advice or as a recommendation regarding any particular security or course of action. We recommend seeking a licensed professional for investment advice. Company Website https://www.tesla.com Address 13101 Tesla Road, Austin, TX, United States, 78725 Fiscal Year End December Employees 99290 Technical Indicators Value Value Beta 2.12 52 Week High 1,243.49 Short Ratio 0.92 52 Week Low 593.50 Shorted Shares 25,651,653 200 Day Moving Average 913.83 Shorted Shares Previous Month 23,732,107 50 Day Moving Average 892.67 Shares Held By Insiders 1,726.30% Short Percentage 3.00% Shares Held by Institutions 43.12 Dividend Yield N/A
- 5. Page 5 of 10 Any information in this report is not , and should not be regarded as investment advice or as a recommendation regarding any particular security or course of action. We recommend seeking a licensed professional for investment advice. TSLA:NSD (Tesla Inc) Auto Manufacturers | | Common Stock Stock Target Advisor Detailed Stock Report Report Date: 7th June, 2022 Market Performance Market Performance vs. Industry / Classification (Auto Manufacturers) Market Performance vs. Exchange (Nasdaq Global Select) Value Sector Median Percentile Rank Grade Market Median Percentile Rank Grade YTD Capital Gain -32.36% -50.7% 79% -17.0% 35% Dividend Return N/A N/A N/A 1.0% N/A Total Return -32.36% -50.7% 79% -16.5% 35% Trailing 12 Months Capital Gain 18.13% -75.3% 100% -20.1% 92% Dividend Return N/A N/A N/A 2.3% N/A Total Return 18.13% -75.3% 100% -18.3% 92% Trailing 5 Years Capital Gain 893.80% -31.1% 100% 8.0% 97% Dividend Return N/A N/A N/A 11.0% N/A Total Return 893.80% -31.1% 100% 18.4% 97% Average Annual (5 Year Horizon) Capital Gain 172.53% 7.1% 100% 2.3% 97% Dividend Return N/A N/A N/A 1.8% N/A Total Return 172.53% 7.1% 100% 4.2% 97% Risk Return Profile Volatility (Standard Deviation) 251.25% 43.6% 18% 32.2% 5% Risk Adjusted Return 68.67% N/A 100% 20.5% 90% Market Capitalization 728.88B 0.45B 100% 0.39B 100%
- 6. Page 6 of 10 Any information in this report is not , and should not be regarded as investment advice or as a recommendation regarding any particular security or course of action. We recommend seeking a licensed professional for investment advice. Key Financial Ratios Ratios vs. Industry / Classification (Computer Hardware) Ratios vs. Exchange (Nasdaq Global Select) Value Sector Median Percentile Rank Grade Market Median Percentile Rank Grade Market Value peratio 95.1 31.1 29% 16.7 10% pbratio 20.2 2.9 8% 1.6 4% pcfratio 63.4 -3.6 7% 0.0 4% pfcfratio 52.3 17.1 43% 10.1 12% Management Effectiveness retequity 28.26% -29.7% 100% 0.4% 91% retinvcap 16.76% -33.2% 100% -0.5% 85% retass 10.12% -15.8% 100% 0.2% 92% debtequityratio 14.09% 13.0% 40% 31.7% 68% Technical Ratios yield N/A N/A N/A 2.6% N/A sratio 0.92 6.74 93% 3.06 79% spercent 3.03% 5.8% 93% 3.0% 49% beta 2.12 2.12 55% 1.09 9%
- 7. Page 7 of 10 Any information in this report is not , and should not be regarded as investment advice or as a recommendation regarding any particular security or course of action. We recommend seeking a licensed professional for investment advice. TSLA:NSD (Tesla Inc) Auto Manufacturers | | Common Stock Stock Target Advisor Detailed Stock Report Report Date: 7th June, 2022 Recent Analyst Ratings Price Action Rating Action Analyst Rating Price date Maintains Cowen Market Perform USD 790 » USD 700 2022-06-03 Maintains Goldman Sachs Buy USD 1200 » USD 1000 2022-06-01 Target Lowered by Jefferies Financial LLC Buy » Buy USD 1250 » USD 1050 2022-05-26 Adjusts STA Research Buy USD 750 2022-05-26 Maintains Daiwa Securities Outperform USD 1150 » USD 800 2022-05-24 Maintains Wedbush Outperform USD 1400 » USD 1000 2022-05-19 Target Lowered by BNP Paribas Underperform » Underperform USD 700 » USD 600 2022-05-18 Target Down Piper Sandler Overweight USD 1035 2022-05-18 Upgrades Tudor Pickering Hold 2022-05-17 Adjusts STA Research Buy USD 1150 » USD 900 2022-05-16 Target Down Wells Fargo Equal Weight USD 960 » USD 900 2022-05-11 Initiated by Berenberg Capital Markets Hold USD 900 2022-05-10 Target Raised by Deutsche Bank Capital Buy USD 1200 » USD 1250 2022-04-22 Target Raised by JP Morgan & Company Underweight USD 335 » USD 395 2022-04-21 Target Raised by RBC Royalbank Sector Perform USD 1035 » USD 1175 2022-04-21 Target Raised by Oppenheimer Holdings Outperform USD 1103 » USD 1291 2022-04-21 Target Raised by Citigroup Sell USD 313 » USD 375 2022-04-21 Maintains STA Research Buy USD 1150 2022-04-21 Target Raised by Wells Fargo Equal Weight USD 910 » USD 960 2022-04-21 Target Up Credit Suisse Outperform USD 1025 » USD 1125 2022-04-19 Target Lowered by Piper Sandler Overweight USD 1350 » USD 1260 2022-04-18 Reiterates STA Research Buy USD 1150 2022-04-12 Maintains Morningstar Sell USD 700 2022-04-12 Target Raised by UBS Neutral USD 1000 » USD 1100 2022-04-04 Target Raised by JP Morgan & Company Underperform USD 325 » USD 335 2022-04-04
- 8. Page 8 of 10 Any information in this report is not , and should not be regarded as investment advice or as a recommendation regarding any particular security or course of action. We recommend seeking a licensed professional for investment advice. TSLA:NSD (Tesla Inc) Auto Manufacturers | | Common Stock Stock Target Advisor Detailed Stock Report Report Date: 7th June, 2022 Annual Financial (USD)
- 9. Page 9 of 10 Any information in this report is not , and should not be regarded as investment advice or as a recommendation regarding any particular security or course of action. We recommend seeking a licensed professional for investment advice. TSLA:NSD (Tesla Inc) Auto Manufacturers | | Common Stock Stock Target Advisor Detailed Stock Report Report Date: 7th June, 2022 Quarterly Financial (USD)
- 10. Page 10 of 10 Any information in this report is not , and should not be regarded as investment advice or as a recommendation regarding any particular security or course of action. We recommend seeking a licensed professional for investment advice. TSLA:NSD (Tesla Inc) Auto Manufacturers | | Common Stock Stock Target Advisor Detailed Stock Report Report Date: 7th June, 2022 Largest Industry Peers for Auto Manufacturers Symbol Company Name Price(Change) Market Cap LI Li Auto Inc +2.86 (+10.9%) USD 25.57B ARVL Arrival Vault USA Inc -0.01 (-0.6%) USD 1.10B FFIE Faraday Future Intelligent Ele.. -0.32 (-10.0%) USD 0.96B GOEV Canoo Inc -0.14 (-4.2%) USD 0.84B NIU Niu Technologies +0.43 (+5.7%) USD 0.58B WKHS Workhorse Group Inc -0.01 (-0.3%) USD 0.48B CENN Cenntro Electric Group Ltd +0.39 (+22.7%) USD 0.45B BLBD Blue Bird Corp +0.17 (+1.4%) USD 0.39B SEV Sono Group N.V. Common Shares +0.20 (+6.2%) USD 0.27B SOLO Electrameccanica Vehicles Corp +0.06 (+4.0%) USD 0.18B ETFs Containing TSLA Symbol Company Name Weight Mer Price(Change) Market Cap VONE Vanguard Russell 1000 Index Fu.. 1.78 % 0.12 % +0.65 (+0.4%) USD 5.06B VTHR Vanguard Russell 3000 Index Fu.. 1.68 % 0.15 % +0.65 (+0.4%) USD 1.19B VTI Vanguard Total Stock Market In.. 1.64 % 0.03 % +0.61 (+0.4%) USD 1,200.91B KOKU Xtrackers MSCI Kokusai Equity .. 1.38 % 0.00 % +0.25 (+0.4%) N/A ZPRC:XETRA SSgA SPDR ETFs Europe II plc -.. 1.26 % 0.00 % +0.32 (+0.4%) USD 0.65B ZPRC:F SSgA SPDR ETFs Europe II plc -.. 1.26 % 0.00 % +0.35 (+0.4%) USD 0.65B SPF1:F SSgA SPDR ETFs Europe II plc -.. 1.26 % 0.00 % -0.12 (0.4%) N/A SPF1:XETRA SSgA SPDR ETFs Europe II plc -.. 1.26 % 0.00 % +0.20 (+0.4%) USD 0.39B GCVB:LSE SSgA SPDR ETFs Europe II plc -.. 1.11 % 0.00 % +0.12 (+0.4%) USD 0.65B GLCB:LSE SSgA SPDR ETFs Europe II plc -.. 1.07 % 0.00 % +0.22 (+0.4%) USD 0.65B The Stock Target Advisor platform run millions of calculations every day on over 30,000 Canadian and American stocks, comparing and ranking their financial and market performance against their sectors and exchange. We represent the percentile ranking using the following grading system. Letter Grade Percentage Letter Grade Percentage Letter Grade Percentage A+ 97%-100% A 93%-96% A- 90%-92% B+ 97%-89% B 83%-86% B- 80%-82% C+ 77%-79% C 73%-76% C- 70%-72% D+ 67%-69% D 63%-66% D- 60%-62% F 0%-59%