Analyst ratings for Bragg Gaming Group Inc
•
0 likes•8 views

This report provides a summary of Bragg Gaming Group Inc., a technology and content supplier to the gaming industry. Key points include: - The stock is rated as very bearish with a score of 0 out of 10. - Negatives include low market capitalization, negative cashflow, and underperformance relative to peers and market indices. - Recent analyst ratings have lowered the target price but maintain a buy rating. - Financial data is provided for annual and quarterly results.

Recommended
Recommended
More Related Content
Similar to Analyst ratings for Bragg Gaming Group Inc
Similar to Analyst ratings for Bragg Gaming Group Inc (20)
More from Stock Target Advisor
More from Stock Target Advisor (20)
Recently uploaded
Recently uploaded (20)
Analyst ratings for Bragg Gaming Group Inc
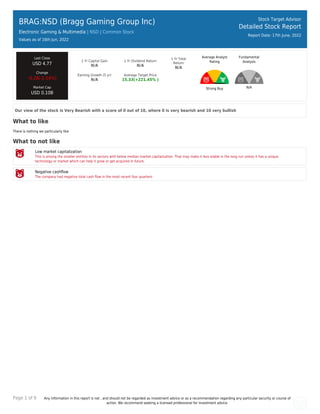
- 1. Page 1 of 9 Any information in this report is not , and should not be regarded as investment advice or as a recommendation regarding any particular security or course of action. We recommend seeking a licensed professional for investment advice. BRAG:NSD (Bragg Gaming Group Inc) Electronic Gaming & Multimedia | NSD | Common Stock Values as of 16th Jun, 2022 Stock Target Advisor Detailed Stock Report Report Date: 17th June, 2022 Last Close USD 4.77 Change -0.28(-5.54%) Market Cap USD 0.10B 1 Yr Capital Gain N/A 1 Yr Dividend Return N/A 1 Yr Total Return N/A Earning Growth (5 yr) N/A Average Target Price 15.33(+221.45% ) Average Analyst Rating Strong Buy Fundamental Analysis N/A Our view of the stock is Very Bearish with a score of 0 out of 10, where 0 is very bearish and 10 very bullish What to like There is nothing we particularly like What to not like Low market capitalization This is among the smaller entities in its sectors with below median market capitalization. That may make it less stable in the long run unless it has a unique technology or market which can help it grow or get acquired in future. Negative cashflow The company had negative total cash flow in the most recent four quarters.
- 2. Page 2 of 9 Any information in this report is not , and should not be regarded as investment advice or as a recommendation regarding any particular security or course of action. We recommend seeking a licensed professional for investment advice. BRAG:NSD (Bragg Gaming Group Inc) Electronic Gaming & Multimedia | | Common Stock Stock Target Advisor Detailed Stock Report Report Date: 17th June, 2022 Adjusted Closing Share Volume Relative Returns Relative Performance (Total Returns) Security Capital Gain Dividend Return Total Return BRAG Bragg Gaming Group Inc -63.7% 0 -63.7% QQQ Invesco QQQ Trust -27.1% +0.2% -26.9% Company Overview Bragg Gaming Group Inc. operates as a technology and content supplier to the gaming industry worldwide. The company provides business- to-business online gaming solutions. It offers a range of games, including slot, table, card, video bingo, scratch card, and live dealer games, as well as virtual sports. The company also provides managed operational and marketing services to its iGaming operator customers to complete its turnkey gaming solution. It offers proprietary third-party gaming content, which delivers through a single integrated platform. The company also holds various content distribution rights through partnerships with selected third-party studios. Bragg Gaming Group Inc. is headquartered in Toronto, Canada.
- 3. Page 3 of 9 Any information in this report is not , and should not be regarded as investment advice or as a recommendation regarding any particular security or course of action. We recommend seeking a licensed professional for investment advice. Company Website https://www.bragg.games Address 130 King Street West, Toronto, ON, Canada, M5X 1E3 Fiscal Year End December Employees 320 Technical Indicators Value Value Beta 0.96 52 Week High 14.70 Short Ratio 26.39 52 Week Low 4.06 Shorted Shares 518,670 200 Day Moving Average 6.84 Shorted Shares Previous Month 518,558 50 Day Moving Average 5.35 Shares Held By Insiders 3,110.00% Short Percentage 3.00% Shares Held by Institutions 6.52 Dividend Yield N/A
- 4. Page 4 of 9 Any information in this report is not , and should not be regarded as investment advice or as a recommendation regarding any particular security or course of action. We recommend seeking a licensed professional for investment advice. BRAG:NSD (Bragg Gaming Group Inc) Electronic Gaming & Multimedia | | Common Stock Stock Target Advisor Detailed Stock Report Report Date: 17th June, 2022 Market Performance Market Performance vs. Industry / Classification (Electronic Gaming & Multimedia) Market Performance vs. Exchange (Nasdaq Global Select) Value Sector Median Percentile Rank Grade Market Median Percentile Rank Grade YTD Capital Gain -5.17% -28.9% 82% -26.1% 74% Dividend Return N/A 0.7% N/A 1.1% N/A Total Return -5.17% -28.9% 82% -25.4% 73% Trailing 12 Months Capital Gain N/A -44.9% N/A -28.6% N/A Dividend Return N/A 0.5% N/A 2.3% N/A Total Return N/A -44.9% N/A -27.0% N/A Trailing 5 Years Capital Gain N/A 25.7% N/A -0.9% N/A Dividend Return N/A 3.5% N/A 10.9% N/A Total Return N/A 29.2% N/A 9.1% N/A Average Annual (5 Year Horizon) Capital Gain N/A 10.1% N/A 1.9% N/A Dividend Return N/A 0.6% N/A 1.8% N/A Total Return N/A 10.7% N/A 3.9% N/A Risk Return Profile Volatility (Standard Deviation) N/A 36.9% N/A 31.9% N/A Risk Adjusted Return N/A N/A N/A 19.0% N/A Market Capitalization 0.10B 0.33B 41% 0.33B 29%
- 5. Page 5 of 9 Any information in this report is not , and should not be regarded as investment advice or as a recommendation regarding any particular security or course of action. We recommend seeking a licensed professional for investment advice. Key Financial Ratios Ratios vs. Industry / Classification (Computer Hardware) Ratios vs. Exchange (Nasdaq Global Select) Value Sector Median Percentile Rank Grade Market Median Percentile Rank Grade Market Value peratio N/A 25.2 N/A 16.1 N/A pbratio 1.5 1.8 56% 1.6 54% pcfratio -2,526.2 0.0 100% -0.1 99% pfcfratio N/A 5.9 N/A 10.0 N/A Management Effectiveness retequity -11.86% 0.8% 38% 0.3% 40% retinvcap -10.15% -7.6% 41% -0.5% 37% retass -4.09% 1.4% 41% 0.1% 37% debtequityratio N/A 3.4% N/A 32.4% N/A Technical Ratios yield N/A 0.6% N/A 2.7% N/A sratio 26.39 2.18 6% 3.05 1% spercent 4.69% 2.2% 24% 3.1% 38% beta 0.96 1.21 53% 1.10 61%
- 6. Page 6 of 9 Any information in this report is not , and should not be regarded as investment advice or as a recommendation regarding any particular security or course of action. We recommend seeking a licensed professional for investment advice. BRAG:NSD (Bragg Gaming Group Inc) Electronic Gaming & Multimedia | | Common Stock Stock Target Advisor Detailed Stock Report Report Date: 17th June, 2022 Recent Analyst Ratings Price Action Rating Action Analyst Rating Price date Initiated Maxim Group Buy USD 12 2022-06-15 Target Lowered by Canaccord Capital USD 19 » USD 15 2022-05-12 Target Lowered by Canaccord Capital USD 21 » USD 19 2022-03-11 Target Lowered by Canaccord Capital Buy USD 30 » USD 21 2021-11-09
- 7. Page 7 of 9 Any information in this report is not , and should not be regarded as investment advice or as a recommendation regarding any particular security or course of action. We recommend seeking a licensed professional for investment advice. BRAG:NSD (Bragg Gaming Group Inc) Electronic Gaming & Multimedia | | Common Stock Stock Target Advisor Detailed Stock Report Report Date: 17th June, 2022 Annual Financial (USD)
- 8. Page 8 of 9 Any information in this report is not , and should not be regarded as investment advice or as a recommendation regarding any particular security or course of action. We recommend seeking a licensed professional for investment advice. BRAG:NSD (Bragg Gaming Group Inc) Electronic Gaming & Multimedia | | Common Stock Stock Target Advisor Detailed Stock Report Report Date: 17th June, 2022 Quarterly Financial (USD)
- 9. Page 9 of 9 Any information in this report is not , and should not be regarded as investment advice or as a recommendation regarding any particular security or course of action. We recommend seeking a licensed professional for investment advice. BRAG:NSD (Bragg Gaming Group Inc) Electronic Gaming & Multimedia | | Common Stock Stock Target Advisor Detailed Stock Report Report Date: 17th June, 2022 Largest Industry Peers for Electronic Gaming & Multimedia Symbol Company Name Price(Change) Market Cap NTES NetEase Inc -8.03 (-7.8%) USD 67.52B ATVI Activision Blizzard Inc -1.42 (-1.9%) USD 58.91B EA Electronic Arts Inc -1.28 (-1.0%) USD 36.18B TTWO Take-Two Interactive Software .. -1.26 (-1.0%) USD 20.44B ZNGA Zynga Inc N/A USD 9.30B BILI Bilibili Inc -1.12 (-4.2%) USD 8.99B GLUU Glu Mobile Inc N/A USD 2.20B SCR Score Media and Gaming Inc N/A USD 1.99B AVID Avid Technology Inc -0.46 (-1.8%) USD 1.16B SOHU Sohu.Com Inc -0.59 (-3.8%) USD 0.59B The Stock Target Advisor platform run millions of calculations every day on over 30,000 Canadian and American stocks, comparing and ranking their financial and market performance against their sectors and exchange. We represent the percentile ranking using the following grading system. Letter Grade Percentage Letter Grade Percentage Letter Grade Percentage A+ 97%-100% A 93%-96% A- 90%-92% B+ 97%-89% B 83%-86% B- 80%-82% C+ 77%-79% C 73%-76% C- 70%-72% D+ 67%-69% D 63%-66% D- 60%-62% F 0%-59%