Core & Main Inc (CNM) Stock

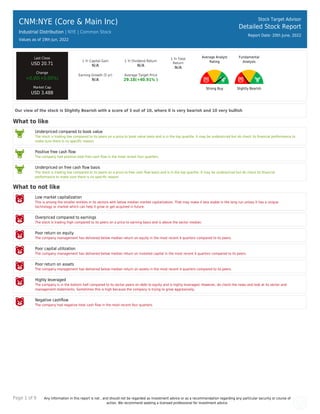
Core & Main, Inc. distributes water, wastewater, storm drainage, and fire protection products and related services to municipalities, private water companies, and professional contractors in the municipal, non-residential, and residential end markets in the United States. Based on the Core & Main Inc stock forecasts from 7 analysts, the average analyst target price for Core & Main Inc is USD 29.18 over the next 12 months. Core & Main Inc’s average analyst rating is Strong Buy. Stock Target Advisor’s own stock analysis of Core & Main Inc is Slightly Bearish, which is based on 3 positive signals and 7 negative signals. At the last closing, Core & Main Inc’s stock price was USD 20.71. Core & Main Inc’s stock price has changed by -7.54% over the past week, -4.78% over the past month and 0% over the last year.

Recommended
More Related Content
Similar to Core & Main Inc (CNM) Stock
Similar to Core & Main Inc (CNM) Stock (20)
More from Stock Target Advisor
More from Stock Target Advisor (20)
Recently uploaded
Recently uploaded (20)
Core & Main Inc (CNM) Stock
- 1. Page 1 of 9 Any information in this report is not , and should not be regarded as investment advice or as a recommendation regarding any particular security or course of action. We recommend seeking a licensed professional for investment advice. CNM:NYE (Core & Main Inc) Industrial Distribution | NYE | Common Stock Values as of 19th Jun, 2022 Stock Target Advisor Detailed Stock Report Report Date: 20th June, 2022 Last Close USD 20.71 Change +0.00(+0.00%) Market Cap USD 3.48B 1 Yr Capital Gain N/A 1 Yr Dividend Return N/A 1 Yr Total Return N/A Earning Growth (5 yr) N/A Average Target Price 29.18(+40.91% ) Average Analyst Rating Strong Buy Fundamental Analysis Slightly Bearish Our view of the stock is Slightly Bearish with a score of 3 out of 10, where 0 is very bearish and 10 very bullish What to like Underpriced compared to book value The stock is trading low compared to its peers on a price to book value basis and is in the top quartile. It may be underpriced but do check its financial performance to make sure there is no specific reason. Positive free cash flow The company had positive total free cash flow in the most recent four quarters. Underpriced on free cash flow basis The stock is trading low compared to its peers on a price to free cash flow basis and is in the top quartile. It may be underpriced but do check its financial performance to make sure there is no specific reason. What to not like Low market capitalization This is among the smaller entities in its sectors with below median market capitalization. That may make it less stable in the long run unless it has a unique technology or market which can help it grow or get acquired in future. Overpriced compared to earnings The stock is trading high compared to its peers on a price to earning basis and is above the sector median. Poor return on equity The company management has delivered below median return on equity in the most recent 4 quarters compared to its peers. Poor capital utilization The company management has delivered below median return on invested capital in the most recent 4 quarters compared to its peers. Poor return on assets The company management has delivered below median return on assets in the most recent 4 quarters compared to its peers. Highly leveraged The company is in the bottom half compared to its sector peers on debt to equity and is highly leveraged. However, do check the news and look at its sector and management statements. Sometimes this is high because the company is trying to grow aggressively. Negative cashflow The company had negative total cash flow in the most recent four quarters.
- 2. Page 2 of 9 Any information in this report is not , and should not be regarded as investment advice or as a recommendation regarding any particular security or course of action. We recommend seeking a licensed professional for investment advice. CNM:NYE (Core & Main Inc) Industrial Distribution | | Common Stock Stock Target Advisor Detailed Stock Report Report Date: 20th June, 2022 Adjusted Closing Share Volume Relative Returns Relative Performance (Total Returns) Security Capital Gain Dividend Return Total Return CNM Core & Main Inc 0 0 0 VTI Vanguard Index Funds - Vanguard Total Stock Market ETF -14.5% +1% -13.5% Company Overview Core & Main, Inc. distributes water, wastewater, storm drainage, and fire protection products and related services to municipalities, private water companies, and professional contractors in the municipal, non-residential, and residential end markets in the United States. Its products include pipes, valves, hydrants, fittings, and other products and services; storm drainage products, such as corrugated piping systems, retention basins, inline drains, manholes, grates, geosynthetics, and other related products; fire protection products, including fire protection pipes, sprinkler heads and other devices, fire suppression systems, and related accessories, as well as fabrication services; and meter products, such as smart meter products, installation, software and other services. The company's specialty products and services are used in the maintenance, repair, replacement, and construction of water and fire protection infrastructure. Core & Main, Inc. was founded in 1874 and is headquartered in St. Louis, Missouri.
- 3. Page 3 of 9 Any information in this report is not , and should not be regarded as investment advice or as a recommendation regarding any particular security or course of action. We recommend seeking a licensed professional for investment advice. Company Website https://www.coreandmain.com Address 1830 Craig Park Court, Saint Louis, MO, United States, 63146 Fiscal Year End December Employees 4100 Technical Indicators Value Value Beta N/A 52 Week High 32.54 Short Ratio 5.54 52 Week Low 20.00 Shorted Shares 2,963,301 200 Day Moving Average 25.06 Shorted Shares Previous Month 3,049,449 50 Day Moving Average 23.27 Shares Held By Insiders 1.50% Short Percentage 1.00% Shares Held by Institutions 104.25 Dividend Yield N/A
- 4. Page 4 of 9 Any information in this report is not , and should not be regarded as investment advice or as a recommendation regarding any particular security or course of action. We recommend seeking a licensed professional for investment advice. CNM:NYE (Core & Main Inc) Industrial Distribution | | Common Stock Stock Target Advisor Detailed Stock Report Report Date: 20th June, 2022 Market Performance Market Performance vs. Industry / Classification (Industrial Distribution) Market Performance vs. Exchange (Nasdaq Global Select) Value Sector Median Percentile Rank Grade Market Median Percentile Rank Grade YTD Capital Gain -31.74% -23.6% 36% -18.4% 20% Dividend Return N/A 0.9% N/A 1.4% N/A Total Return -31.74% -22.3% 36% -17.2% 19% Trailing 12 Months Capital Gain N/A -17.3% N/A -16.0% N/A Dividend Return N/A 1.9% N/A 2.8% N/A Total Return N/A -14.4% N/A -13.2% N/A Trailing 5 Years Capital Gain N/A 54.8% N/A -0.8% N/A Dividend Return N/A 16.8% N/A 12.9% N/A Total Return N/A 71.6% N/A 14.5% N/A Average Annual (5 Year Horizon) Capital Gain N/A 14.3% N/A 4.5% N/A Dividend Return N/A 1.9% N/A 2.1% N/A Total Return N/A 16.2% N/A 7.7% N/A Risk Return Profile Volatility (Standard Deviation) N/A 32.1% N/A 22.9% N/A Risk Adjusted Return N/A N/A N/A 38.6% N/A Market Capitalization 3.48B 5.05B 36% 1.19B 71%
- 5. Page 5 of 9 Any information in this report is not , and should not be regarded as investment advice or as a recommendation regarding any particular security or course of action. We recommend seeking a licensed professional for investment advice. Key Financial Ratios Ratios vs. Industry / Classification (Computer Hardware) Ratios vs. Exchange (Nasdaq Global Select) Value Sector Median Percentile Rank Grade Market Median Percentile Rank Grade Market Value peratio 25.4 14.9 9% 15.7 24% pbratio 2.6 4.8 82% 1.5 30% pcfratio -112.2 23.9 100% 6.5 95% pfcfratio 8.6 11.5 91% 10.7 59% Management Effectiveness retequity 24.77% 27.7% 36% 9.9% 81% retinvcap 13.04% 21.7% 45% 5.6% 76% retass 7.80% 10.3% 27% 2.5% 85% debtequityratio 109.89% 52.6% 30% 68.6% 32% Technical Ratios yield N/A 2.4% N/A 3.2% N/A sratio 5.54 3.10 27% 2.07 13% spercent 4.88% 4.0% 40% 3.9% 44% beta N/A 1.04 N/A 1.04 N/A
- 6. Page 6 of 9 Any information in this report is not , and should not be regarded as investment advice or as a recommendation regarding any particular security or course of action. We recommend seeking a licensed professional for investment advice. CNM:NYE (Core & Main Inc) Industrial Distribution | | Common Stock Stock Target Advisor Detailed Stock Report Report Date: 20th June, 2022 Recent Analyst Ratings Price Action Rating Action Analyst Rating Price date Maintains Barclays Overweight USD 34 » USD 29 2022-06-17 Maintains Truist Securities Hold USD 28 » USD 25 2022-06-16 Maintains Robert W Baird Outperform USD 28 » USD 29 2022-06-15 Maintains Credit Suisse Outperform USD 35 » USD 32 2022-06-15 Maintains Goldman Sachs Neutral USD 31 » USD 27 2022-06-15 Maintains RBC Royalbank Outperform USD 31 » USD 28 2022-06-15 Upgraded by Barclays Equal Weight » Overweight USD 32 » USD 34 2022-03-31 Target Lowered by RBC Royalbank Outperform USD 33 » USD 31 2022-03-31 Target Lowered by Truist Securities USD 32 » USD 28 2022-03-31 Downgrades Bank of America Securities Underperform USD 31 » USD 25 2022-02-17 Upgrades RBC Royalbank Outperform USD 33 2022-01-10 Target Raised by Barclays Equal Weight » Equal Weight USD 30 » USD 32 2021-12-09 Downgraded by Citigroup Buy » Neutral USD 32 2021-12-08 Target Raised by Deutsche Bank Capital Buy » Buy USD 33 » USD 37 2021-12-08 Target Raised by Robert W Baird Outperform » Outperform USD 32 » USD 33 2021-12-08 Target Raised by Credit Suisse Outperform » Outperform USD 33 » USD 40 2021-12-08 Initiated by Berenberg Capital Markets Hold USD 25 2021-10-05 Target Raised by Deutsche Bank Capital Buy USD 32 » USD 33 2021-09-17 Maintains Citigroup Buy USD 31 » USD 32 2021-09-16
- 7. Page 7 of 9 Any information in this report is not , and should not be regarded as investment advice or as a recommendation regarding any particular security or course of action. We recommend seeking a licensed professional for investment advice. CNM:NYE (Core & Main Inc) Industrial Distribution | | Common Stock Stock Target Advisor Detailed Stock Report Report Date: 20th June, 2022 Annual Financial (USD)
- 8. Page 8 of 9 Any information in this report is not , and should not be regarded as investment advice or as a recommendation regarding any particular security or course of action. We recommend seeking a licensed professional for investment advice. CNM:NYE (Core & Main Inc) Industrial Distribution | | Common Stock Stock Target Advisor Detailed Stock Report Report Date: 20th June, 2022 Quarterly Financial (USD)
- 9. Page 9 of 9 Any information in this report is not , and should not be regarded as investment advice or as a recommendation regarding any particular security or course of action. We recommend seeking a licensed professional for investment advice. CNM:NYE (Core & Main Inc) Industrial Distribution | | Common Stock Stock Target Advisor Detailed Stock Report Report Date: 20th June, 2022 Largest Industry Peers for Industrial Distribution Symbol Company Name Price(Change) Market Cap FERG Ferguson Plc N/A USD 23.36B GWW WW Grainger Inc N/A USD 22.59B WSO Watsco Inc N/A USD 8.89B WSO-B Watsco Inc N/A USD 8.89B WCC WESCO International Inc N/A USD 5.41B SITE Siteone Landscape Supply Inc N/A USD 5.05B MSM MSC Industrial Direct Company .. N/A USD 4.07B AIT Applied Industrial Technologie.. N/A USD 3.47B AXE Anixter International Inc N/A USD 3.33B SYX Systemax Inc N/A USD 1.33B The Stock Target Advisor platform run millions of calculations every day on over 30,000 Canadian and American stocks, comparing and ranking their financial and market performance against their sectors and exchange. We represent the percentile ranking using the following grading system. Letter Grade Percentage Letter Grade Percentage Letter Grade Percentage A+ 97%-100% A 93%-96% A- 90%-92% B+ 97%-89% B 83%-86% B- 80%-82% C+ 77%-79% C 73%-76% C- 70%-72% D+ 67%-69% D 63%-66% D- 60%-62% F 0%-59%