Marvell Technology Inc (MRVL) Stock Analysis

Marvell Technology, Inc., together with its subsidiaries, designs, develops, and sells analog, mixed-signal, digital signal processing, and embedded and standalone integrated circuits. It offers a portfolio of Ethernet solutions, including controllers, network adapters, physical transceivers, and switches. Based on the Marvell Technology Inc stock forecasts from 25 analysts, the average analyst target price for Marvell Technology Inc is USD 92.92 over the next 12 months. Marvell Technology Inc’s average analyst rating is Strong Buy. Stock Target Advisor’s own stock analysis of Marvell Technology Inc is Slightly Bearish, which is based on 4 positive signals and 5 negative signals. At the last closing, Marvell Technology Inc’s stock price was USD 60.82. Marvell Technology Inc’s stock price has changed by +10.86% over the past week, +4.72% over the past month and +25.92% over the last year.

Recommended
Recommended
More Related Content
Similar to Marvell Technology Inc (MRVL) Stock Analysis
Similar to Marvell Technology Inc (MRVL) Stock Analysis (20)
More from Stock Target Advisor
More from Stock Target Advisor (20)
Recently uploaded
Recently uploaded (20)
Marvell Technology Inc (MRVL) Stock Analysis
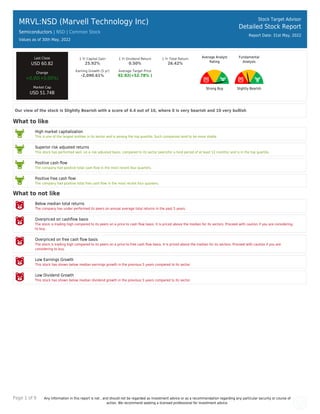
- 1. Page 1 of 9 Any information in this report is not , and should not be regarded as investment advice or as a recommendation regarding any particular security or course of action. We recommend seeking a licensed professional for investment advice. MRVL:NSD (Marvell Technology Inc) Semiconductors | NSD | Common Stock Values as of 30th May, 2022 Stock Target Advisor Detailed Stock Report Report Date: 31st May, 2022 Last Close USD 60.82 Change +0.00(+0.00%) Market Cap USD 51.74B 1 Yr Capital Gain 25.92% 1 Yr Dividend Return 0.50% 1 Yr Total Return 26.42% Earning Growth (5 yr) -2,090.61% Average Target Price 92.92(+52.78% ) Average Analyst Rating Strong Buy Fundamental Analysis Slightly Bearish Our view of the stock is Slightly Bearish with a score of 4.4 out of 10, where 0 is very bearish and 10 very bullish What to like High market capitalization This is one of the largest entities in its sector and is among the top quartile. Such companies tend to be more stable. Superior risk adjusted returns This stock has performed well, on a risk adjusted basis, compared to its sector peers(for a hold period of at least 12 months) and is in the top quartile. Positive cash flow The company had positive total cash flow in the most recent four quarters. Positive free cash flow The company had positive total free cash flow in the most recent four quarters. What to not like Below median total returns The company has under performed its peers on annual average total returns in the past 5 years. Overpriced on cashflow basis The stock is trading high compared to its peers on a price to cash flow basis. It is priced above the median for its sectors. Proceed with caution if you are considering to buy. Overpriced on free cash flow basis The stock is trading high compared to its peers on a price to free cash flow basis. It is priced above the median for its sectors. Proceed with caution if you are considering to buy. Low Earnings Growth This stock has shown below median earnings growth in the previous 5 years compared to its sector Low Dividend Growth This stock has shown below median dividend growth in the previous 5 years compared to its sector.
- 2. Page 2 of 9 Any information in this report is not , and should not be regarded as investment advice or as a recommendation regarding any particular security or course of action. We recommend seeking a licensed professional for investment advice. MRVL:NSD (Marvell Technology Inc) Semiconductors | | Common Stock Stock Target Advisor Detailed Stock Report Report Date: 31st May, 2022 Adjusted Closing Share Volume Relative Returns Relative Performance (Total Returns) Security Capital Gain Dividend Return Total Return MRVL Marvell Technology Inc +25.9% +0.5% +26.4% QQQ Invesco QQQ Trust Series 1 -7.4% +0.4% -7% Company Overview Marvell Technology, Inc., together with its subsidiaries, designs, develops, and sells analog, mixed-signal, digital signal processing, and embedded and standalone integrated circuits. It offers a portfolio of Ethernet solutions, including controllers, network adapters, physical transceivers, and switches; single or multiple core processors; ASIC; and printer System-on-a-Chip products and application processors. The company also provides a range of storage products comprising storage controllers for hard disk drives (HDD) and solid-state drives that support various host system interfaces consisting of serial attached SCSI (SAS), serial advanced technology attachment (SATA), peripheral component interconnect express, non-volatile memory express (NVMe), and NVMe over fabrics; and fiber channel products, including host bus adapters, and controllers for server and storage system connectivity. It has operations in the United States, China, Malaysia, the Philippines, Thailand, Singapore, India, Israel, Japan, South Korea, Taiwan, and Vietnam. Marvell Technology, Inc. was incorporated in 1995 and is headquartered in Wilmington, Delaware.
- 3. Page 3 of 9 Any information in this report is not , and should not be regarded as investment advice or as a recommendation regarding any particular security or course of action. We recommend seeking a licensed professional for investment advice. Company Website https://www.marvell.com Address 1000 North West Street, Wilmington, DE, United States, 19801 Fiscal Year End February Employees 6695 Technical Indicators Value Value Beta 1.27 52 Week High 93.70 Short Ratio 1.38 52 Week Low 46.60 Shorted Shares 13,437,157 200 Day Moving Average 68.57 Shorted Shares Previous Month 13,013,321 50 Day Moving Average 62.30 Shares Held By Insiders 58.10% Short Percentage 2.00% Shares Held by Institutions 83.00 Dividend Yield 0.42%
- 4. Page 4 of 9 Any information in this report is not , and should not be regarded as investment advice or as a recommendation regarding any particular security or course of action. We recommend seeking a licensed professional for investment advice. MRVL:NSD (Marvell Technology Inc) Semiconductors | | Common Stock Stock Target Advisor Detailed Stock Report Report Date: 31st May, 2022 Market Performance Market Performance vs. Industry / Classification (Semiconductors) Market Performance vs. Exchange (Nasdaq Global Select) Value Sector Median Percentile Rank Grade Market Median Percentile Rank Grade YTD Capital Gain -30.48% -27.6% 31% -16.9% 37% Dividend Return 0.14% 0.6% 18% 0.9% 6% Total Return -30.35% -24.7% 31% -16.3% 37% Trailing 12 Months Capital Gain 25.92% 0.8% 83% -18.7% 94% Dividend Return 0.50% 1.8% 11% 2.3% 11% Total Return 26.42% 0.8% 81% -17.2% 94% Trailing 5 Years Capital Gain 252.78% 81.2% 86% 8.7% 91% Dividend Return 6.61% 9.5% 20% 11.1% 24% Total Return 259.40% 90.1% 86% 19.5% 91% Average Annual (5 Year Horizon) Capital Gain 39.51% 22.2% 73% 2.6% 86% Dividend Return 0.92% 1.6% 20% 1.8% 26% Total Return 40.43% 23.2% 73% 4.5% 86% Risk Return Profile Volatility (Standard Deviation) 35.57% 66.8% 66% 32.2% 44% Risk Adjusted Return 113.68% N/A 91% 20.7% 98% Market Capitalization 51.74B 4.08B 83% 0.49B 98%
- 5. Page 5 of 9 Any information in this report is not , and should not be regarded as investment advice or as a recommendation regarding any particular security or course of action. We recommend seeking a licensed professional for investment advice. Key Financial Ratios Ratios vs. Industry / Classification (Computer Hardware) Ratios vs. Exchange (Nasdaq Global Select) Value Sector Median Percentile Rank Grade Market Median Percentile Rank Grade Market Value peratio 18.4 25.7 61% 16.6 46% pbratio 3.0 3.3 58% 1.6 29% pcfratio 63.1 14.2 4% 0.0 4% pfcfratio 56.5 13.3 10% 10.1 11% Management Effectiveness retequity -3.49% 20.4% 20% 0.6% 46% retinvcap -1.91% 12.9% 20% -0.5% 45% retass -0.23% 7.4% 18% 0.2% 48% debtequityratio 28.56% 38.8% 64% 31.8% 53% Technical Ratios yield 0.42% 2.1% 11% 2.6% 5% sratio 1.38 2.68 86% 3.07 72% spercent 1.85% 3.0% 77% 3.0% 62% beta 1.27 1.22 45% 1.09 38%
- 6. Page 6 of 9 Any information in this report is not , and should not be regarded as investment advice or as a recommendation regarding any particular security or course of action. We recommend seeking a licensed professional for investment advice. MRVL:NSD (Marvell Technology Inc) Semiconductors | | Common Stock Stock Target Advisor Detailed Stock Report Report Date: 31st May, 2022 Recent Analyst Ratings Price Action Rating Action Analyst Rating Price date Reiterated by Raymond James Capital Buy USD 80 2022-05-29 Target Down Deutsche Bank Capital USD 75 2022-05-27 Maintains BMO Financial Outperform USD 98 » USD 82 2022-05-27 Target Down Craig Hallum USD 90 2022-05-27 Target Down Needham & Company LLC USD 75 2022-05-27 Maintains KeyBanc Overweight USD 95 » USD 90 2022-05-27 Maintains Cowen Outperform USD 100 » USD 85 2022-05-27 Maintains Morgan Stanley Equal-Weight USD 80 » USD 68 2022-05-27 Maintains Bank of America Buy USD 100 » USD 90 2022-05-27 Maintains Susquehanna Bancshares Positive USD 105 » USD 90 2022-05-25 Maintains UBS Buy USD 95 » USD 80 2022-05-23 Target Down Oppenheimer Holdings Outperform USD 90 2022-05-20 Target Lowered by Barclays Overweight USD 90 » USD 80 2022-04-25 Upgraded by Raymond James Capital Market Perform » Outperform USD 80 2022-04-25 Target Lowered by Deutsche Bank Capital USD 90 » USD 80 2022-04-20 Target Raised by Susquehanna Bancshares USD 100 » USD 105 2022-03-07 Target Lowered by B. Riley Buy USD 115 » USD 95 2022-03-04 Target Lowered by Wells Fargo Equal Weight USD 80 » USD 70 2022-03-04 Maintains Needham & Company LLC Buy USD 115 » USD 105 2022-03-04 Target Lowered by Deutsche Bank Capital Buy USD 100 » USD 90 2022-03-04 Target Lowered by Piper Sandler USD 100 » USD 80 2022-03-04 Target Lowered by Morgan Stanley Equal Weight USD 86 » USD 80 2022-03-04 Maintains Rosenblatt Securities Buy USD 120 » USD 125 2022-03-04 Downgraded by Summit Insights Buy » Hold 2022-03-04 Reiterated by Susquehanna Bancshares Buy USD 100 2022-02-24
- 7. Page 7 of 9 Any information in this report is not , and should not be regarded as investment advice or as a recommendation regarding any particular security or course of action. We recommend seeking a licensed professional for investment advice. MRVL:NSD (Marvell Technology Inc) Semiconductors | | Common Stock Stock Target Advisor Detailed Stock Report Report Date: 31st May, 2022 Annual Financial (USD)
- 8. Page 8 of 9 Any information in this report is not , and should not be regarded as investment advice or as a recommendation regarding any particular security or course of action. We recommend seeking a licensed professional for investment advice. MRVL:NSD (Marvell Technology Inc) Semiconductors | | Common Stock Stock Target Advisor Detailed Stock Report Report Date: 31st May, 2022 Quarterly Financial (USD)
- 9. Page 9 of 9 Any information in this report is not , and should not be regarded as investment advice or as a recommendation regarding any particular security or course of action. We recommend seeking a licensed professional for investment advice. MRVL:NSD (Marvell Technology Inc) Semiconductors | | Common Stock Stock Target Advisor Detailed Stock Report Report Date: 31st May, 2022 Largest Industry Peers for Semiconductors Symbol Company Name Price(Change) Market Cap NVDA NVIDIA Corporation N/A USD 468.77B AVGO Broadcom Inc N/A USD 245.79B INTC Intel Corporation N/A USD 182.16B AMD Advanced Micro Devices Inc N/A USD 165.71B TXN Texas Instruments Incorporated N/A USD 164.11B QCOM QUALCOMM Incorporated N/A USD 156.53B ADI Analog Devices Inc N/A USD 87.09B MU Micron Technology Inc. N/A USD 81.87B XLNX Xilinx Inc N/A USD 48.41B NXPI NXP Semiconductors N.V N/A USD 47.44B ETFs Containing MRVL Symbol Company Name Weight Mer Price(Change) Market Cap VXF Vanguard Extended Market Index.. 0.78 % 0.07 % N/A USD 87.68B EUSA iShares MSCI USA Equal Weighte.. 0.00 % 0.15 % N/A USD 0.44B FHQ-F:CA First Trust AlphaDEX U.S. Tech.. 0.00 % 0.00 % N/A N/A QQQA ProShares Trust - ProShares Na.. 0.00 % 0.00 % N/A N/A IMCG iShares Morningstar Mid-Cap Gr.. 0.00 % 0.00 % N/A N/A ITEP:LSE HAN-GINS Tech Megatrend Equal .. 0.00 % 0.00 % +23.00 (+0.0%) N/A MID American Century Mid Cap Growt.. 0.00 % 0.00 % N/A N/A BKMC BNY Mellon US Mid Cap Core Equ.. 0.00 % 0.00 % N/A N/A XRSM:XETRA Xtrackers (IE) Public Limited .. 0.00 % 0.00 % +0.26 (+0.0%) USD 0.11B QDVC:XETRA iShares IV Public Limited Comp.. 0.00 % 0.00 % +0.06 (+0.0%) USD 0.15B The Stock Target Advisor platform run millions of calculations every day on over 30,000 Canadian and American stocks, comparing and ranking their financial and market performance against their sectors and exchange. We represent the percentile ranking using the following grading system. Letter Grade Percentage Letter Grade Percentage Letter Grade Percentage A+ 97%-100% A 93%-96% A- 90%-92% B+ 97%-89% B 83%-86% B- 80%-82% C+ 77%-79% C 73%-76% C- 70%-72% D+ 67%-69% D 63%-66% D- 60%-62% F 0%-59%