CSCO Stock Forecast.pdf

Cisco Systems, Inc. designs, manufactures, and sells Internet Protocol based networking and other products related to the communications and information technology industry in the Americas, Europe, the Middle East, Africa, the Asia Pacific, Japan, and China. Based on the Cisco Systems Inc stock forecasts from 19 analysts, the average analyst target price for Cisco Systems Inc is USD 52.64 over the next 12 months. Cisco Systems Inc’s average analyst rating is Buy . Stock Target Advisor’s own stock analysis of Cisco Systems Inc is Bullish , which is based on 11 positive signals and 4 negative signals. At the last closing, Cisco Systems Inc’s stock price was USD 48.70. Cisco Systems Inc’s stock price has changed by +4.48% over the past week, +9.24% over the past month and -16.35% over the last year.

Recommended
Recommended
More Related Content
Similar to CSCO Stock Forecast.pdf
Similar to CSCO Stock Forecast.pdf (20)
More from Stocktargetadvisor.com
More from Stocktargetadvisor.com (20)
Recently uploaded
Recently uploaded (20)
CSCO Stock Forecast.pdf
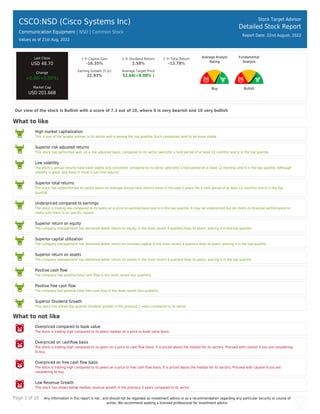
- 1. Page 1 of 10 Any information in this report is not , and should not be regarded as investment advice or as a recommendation regarding any particular security or course of action. We recommend seeking a licensed professional for investment advice. CSCO:NSD (Cisco Systems Inc) Communication Equipment | NSD | Common Stock Values as of 21st Aug, 2022 Stock Target Advisor Detailed Stock Report Report Date: 22nd August, 2022 Last Close USD 48.70 Change +0.00(+0.00%) Market Cap USD 201.66B 1 Yr Capital Gain -16.35% 1 Yr Dividend Return 2.58% 1 Yr Total Return -13.78% Earning Growth (5 yr) 22.93% Average Target Price 52.64(+8.08% ) Average Analyst Rating Buy Fundamental Analysis Bullish Our view of the stock is Bullish with a score of 7.3 out of 10, where 0 is very bearish and 10 very bullish What to like High market capitalization This is one of the largest entities in its sector and is among the top quartile. Such companies tend to be more stable. Superior risk adjusted returns This stock has performed well, on a risk adjusted basis, compared to its sector peers(for a hold period of at least 12 months) and is in the top quartile. Low volatility The stock’s annual returns have been stable and consistent compared to its sector peers(for a hold period of at least 12 months) and is in the top quartile. Although stability is good, also keep in mind it can limit returns. Superior total returns The stock has outperformed its sector peers on average annual total returns basis in the past 5 years (for a hold period of at least 12 months) and is in the top quartile. Underpriced compared to earnings The stock is trading low compared to its peers on a price to earning basis and is in the top quartile. It may be underpriced but do check its financial performance to make sure there is no specific reason. Superior return on equity The company management has delivered better return on equity in the most recent 4 quarters than its peers, placing it in the top quartile. Superior capital utilization The company management has delivered better return on invested capital in the most recent 4 quarters than its peers, placing it in the top quartile. Superior return on assets The company management has delivered better return on assets in the most recent 4 quarters than its peers, placing it in the top quartile. Positive cash flow The company had positive total cash flow in the most recent four quarters. Positive free cash flow The company had positive total free cash flow in the most recent four quarters. Superior Dividend Growth This stock has shown top quartile dividend growth in the previous 5 years compared to its sector What to not like Overpriced compared to book value The stock is trading high compared to its peers median on a price to book value basis. Overpriced on cashflow basis The stock is trading high compared to its peers on a price to cash flow basis. It is priced above the median for its sectors. Proceed with caution if you are considering to buy. Overpriced on free cash flow basis The stock is trading high compared to its peers on a price to free cash flow basis. It is priced above the median for its sectors. Proceed with caution if you are considering to buy. Low Revenue Growth This stock has shown below median revenue growth in the previous 5 years compared to its sector
- 2. Page 2 of 10 Any information in this report is not , and should not be regarded as investment advice or as a recommendation regarding any particular security or course of action. We recommend seeking a licensed professional for investment advice.
- 3. Page 3 of 10 Any information in this report is not , and should not be regarded as investment advice or as a recommendation regarding any particular security or course of action. We recommend seeking a licensed professional for investment advice. CSCO:NSD (Cisco Systems Inc) Communication Equipment | | Common Stock Stock Target Advisor Detailed Stock Report Report Date: 22nd August, 2022 Adjusted Closing Share Volume Relative Returns Relative Performance (Total Returns) Security Capital Gain Dividend Return Total Return CSCO Cisco Systems Inc -16.4% +2.6% -13.8% QQQ Invesco QQQ Trust -12.2% +0.4% -11.8% Company Overview Cisco Systems, Inc. designs, manufactures, and sells Internet Protocol based networking and other products related to the communications and information technology industry in the Americas, Europe, the Middle East, Africa, the Asia Pacific, Japan, and China. It provides infrastructure platforms, including networking technologies of switching, routing, wireless, and data center products that are designed to work together to deliver networking capabilities, and transport and/or store data. The company also offers collaboration products comprising unified communications, Cisco TelePresence, and conferencing, as well as the Internet of Things and analytics software. In addition, it provides security products, such as network security, cloud and email security, identity and access management, advanced threat protection, and unified threat management products. Further, the company offers a range of service and support options for its customers, including technical support and advanced services. It serves businesses of various sizes, public institutions, governments, and service providers. The company sells its products and services directly, as well as through systems integrators, service providers, other resellers, and distributors. Cisco Systems, Inc. has strategic alliances with other companies. Cisco Systems, Inc. was incorporated in 1984 and is headquartered in San Jose, California.
- 4. Page 4 of 10 Any information in this report is not , and should not be regarded as investment advice or as a recommendation regarding any particular security or course of action. We recommend seeking a licensed professional for investment advice. Company Website https://www.cisco.com Address 170 West Tasman Drive, San Jose, CA, United States, 95134 Fiscal Year End July Technical Indicators Value Value Beta 0.95 52 Week High 62.91 Short Ratio 2.01 52 Week Low 40.65 Shorted Shares 37,079,470 200 Day Moving Average 52.12 Shorted Shares Previous Month 37,647,684 50 Day Moving Average 44.32 Shares Held By Insiders 7.20% Short Percentage 1.00% Shares Held by Institutions 74.48 Dividend Yield 3.08%
- 5. Page 5 of 10 Any information in this report is not , and should not be regarded as investment advice or as a recommendation regarding any particular security or course of action. We recommend seeking a licensed professional for investment advice. CSCO:NSD (Cisco Systems Inc) Communication Equipment | | Common Stock Stock Target Advisor Detailed Stock Report Report Date: 22nd August, 2022 Market Performance Market Performance vs. Industry / Classification (Communication Equipment) Market Performance vs. Exchange (Nasdaq Global Select) Value Sector Median Percentile Rank Grade Market Median Percentile Rank Grade YTD Capital Gain -23.15% -16.4% 42% -16.6% 43% Dividend Return 1.78% 1.2% 86% 1.4% 60% Total Return -21.37% -16.4% 42% -15.5% 44% Trailing 12 Months Capital Gain -16.35% -28.2% 63% -17.4% 51% Dividend Return 2.58% 2.2% 100% 2.4% 55% Total Return -13.78% -28.2% 65% -15.4% 52% Trailing 5 Years Capital Gain 55.74% 15.9% 71% 9.4% 70% Dividend Return 21.20% 11.5% 100% 11.0% 84% Total Return 76.94% 24.2% 73% 19.3% 74% Average Annual (5 Year Horizon) Capital Gain 9.43% 8.4% 52% 0.4% 68% Dividend Return 2.93% 2.4% 82% 1.8% 73% Total Return 12.35% 9.6% 54% 1.6% 70% Risk Return Profile Volatility (Standard Deviation) 22.02% 44.6% 96% 32.8% 68% Risk Adjusted Return 56.12% N/A 81% 14.3% 86% Market Capitalization 201.66B 0.37B 100% 0.37B 100%
- 6. Page 6 of 10 Any information in this report is not , and should not be regarded as investment advice or as a recommendation regarding any particular security or course of action. We recommend seeking a licensed professional for investment advice. Key Financial Ratios Ratios vs. Industry / Classification (Computer Hardware) Ratios vs. Exchange (Nasdaq Global Select) Value Sector Median Percentile Rank Grade Market Median Percentile Rank Grade Market Value peratio 17.5 37.7 79% 16.9 48% pbratio 5.1 2.5 27% 1.8 20% pcfratio 15.2 11.7 42% -0.1 21% pfcfratio 11.4 11.3 47% 0.5 26% Management Effectiveness retequity 29.15% -6.6% 96% -0.9% 91% retinvcap 22.15% -4.7% 90% -0.5% 89% retass 9.14% -0.9% 96% -0.1% 91% debtequityratio 21.16% 30.9% 57% 32.4% 60% Technical Ratios yield 3.08% 3.2% 44% 2.6% 58% sratio 2.01 3.73 69% 3.66 67% spercent 0.90% 3.1% 71% 2.8% 74% beta 0.95 1.11 63% 1.07 58%
- 7. Page 7 of 10 Any information in this report is not , and should not be regarded as investment advice or as a recommendation regarding any particular security or course of action. We recommend seeking a licensed professional for investment advice. CSCO:NSD (Cisco Systems Inc) Communication Equipment | | Common Stock Stock Target Advisor Detailed Stock Report Report Date: 22nd August, 2022 Recent Analyst Ratings Price Action Rating Action Analyst Rating Price date Maintains Deutsche Bank Capital Hold USD 51 » USD 54 2022-08-19 Target Raised by UBS Neutral USD 46 » USD 48 2022-08-18 Target Raised by Rosenblatt Securities Neutral USD 48 » USD 53 2022-08-18 Target Lowered by Raymond James Capital USD 63 » USD 59 2022-08-18 Target Raised by Credit Suisse USD 60 » USD 65 2022-08-18 Maintains Cowen Outperform USD 58 » USD 60 2022-08-18 Target Raised by Goldman Sachs Neutral USD 45 » USD 50 2022-08-18 Target Raised by Morgan Stanley Equal Weight USD 46 » USD 48 2022-08-18 Target Raised by Evercore ISI Outperform USD 50 » USD 56 2022-08-18 Target Raised by Citigroup USD 40 » USD 44 2022-08-18 Target Raised by Piper Sandler Neutral USD 43 » USD 47 2022-08-18 Target Raised by Jefferies Financial LLC Buy USD 52 » USD 54 2022-08-18 Target Raised by Barclays USD 55 » USD 56 2022-08-18 Downgraded by KGI Securities Outperform » Neutral 2022-07-15 Downgrades JP Morgan & Company Neutral USD 62 » USD 51 2022-07-14 Initiates Coverage On Rosenblatt Securities Neutral USD 48 2022-07-13 Maintains Goldman Sachs Neutral USD 64 » USD 46 2022-05-20 Maintains UBS Neutral USD 59 » USD 46 2022-05-19 Maintains JP Morgan & Company Overweight USD 67 » USD 62 2022-05-19 Maintains Piper Sandler Neutral USD 57 » USD 43 2022-05-19 Upgraded by KGI Securities Neutral » Outperform 2022-05-19 Maintains Citigroup Sell USD 45 » USD 40 2022-05-19 Maintains Wells Fargo Equal-Weight USD 65 » USD 52 2022-05-19 Maintains Jefferies Financial LLC Buy USD 65 » USD 52 2022-05-19 Maintains Barclays Overweight USD 68 » USD 55 2022-05-19
- 8. Page 8 of 10 Any information in this report is not , and should not be regarded as investment advice or as a recommendation regarding any particular security or course of action. We recommend seeking a licensed professional for investment advice. CSCO:NSD (Cisco Systems Inc) Communication Equipment | | Common Stock Stock Target Advisor Detailed Stock Report Report Date: 22nd August, 2022 Annual Financial (USD)
- 9. Page 9 of 10 Any information in this report is not , and should not be regarded as investment advice or as a recommendation regarding any particular security or course of action. We recommend seeking a licensed professional for investment advice. CSCO:NSD (Cisco Systems Inc) Communication Equipment | | Common Stock Stock Target Advisor Detailed Stock Report Report Date: 22nd August, 2022 Quarterly Financial (USD)
- 10. Page 10 of 10 Any information in this report is not , and should not be regarded as investment advice or as a recommendation regarding any particular security or course of action. We recommend seeking a licensed professional for investment advice. CSCO:NSD (Cisco Systems Inc) Communication Equipment | | Common Stock Stock Target Advisor Detailed Stock Report Report Date: 22nd August, 2022 Largest Industry Peers for Communication Equipment Symbol Company Name Price(Change) Market Cap ERIC Telefonaktiebolaget LM Ericsso.. N/A USD 26.03B ZBRA Zebra Technologies Corporation N/A USD 17.01B LITE Lumentum Holdings Inc N/A USD 6.28B ACIA Acacia Communications, Inc N/A USD 4.90B VIAV Viavi Solutions Inc N/A USD 3.56B VSAT ViaSat Inc N/A USD 2.81B PI Impinj Inc N/A USD 2.41B COMM CommScope Holding Co Inc N/A USD 2.24B CRDO Credo Technology Group Holding.. N/A USD 2.13B ADTN ADTRAN Inc N/A USD 1.94B ETFs Containing CSCO Symbol Company Name Weight Mer Price(Change) Market Cap CIBR First Trust NASDAQ Cybersecuri.. 0.00 % 0.00 % N/A USD 5.13B EKLD:XETRA BNP Paribas Easy MSCI USA SRI .. 0.00 % 0.00 % N/A USD 0.53B QDVI:F iShares IV Public Limited Comp.. 0.00 % 0.00 % N/A USD 6.31B UBUS:F UBS (Irl) ETF Public Limited C.. 0.00 % 0.00 % N/A USD 0.60B UBUW:F UBS (Irl) ETF Public Limited C.. 0.00 % 0.00 % N/A USD 0.05B UIMM:F UBS (Lux) Fund Solutions - MSC.. 0.00 % 0.00 % N/A USD 4.67B UIMP:F UBS ETF - MSCI USA Socially Re.. 0.00 % 0.00 % N/A USD 1.95B WTDM:F WisdomTree US Quality Dividend.. 0.00 % 0.00 % N/A USD 0.24B WTDY:F WisdomTree Issuer ICAV - Wisdo.. 0.00 % 0.00 % N/A USD 1.18M ZPRU:F SSgA SPDR ETFs Europe II Publi.. 0.00 % 0.00 % N/A USD 0.12B The Stock Target Advisor platform run millions of calculations every day on over 30,000 Canadian and American stocks, comparing and ranking their financial and market performance against their sectors and exchange. We represent the percentile ranking using the following grading system. Letter Grade Percentage Letter Grade Percentage Letter Grade Percentage A+ 97%-100% A 93%-96% A- 90%-92% B+ 97%-89% B 83%-86% B- 80%-82% C+ 77%-79% C 73%-76% C- 70%-72% D+ 67%-69% D 63%-66% D- 60%-62% F 0%-59%