TSLA Inc.pdf
•
0 likes•15 views

The document provides a detailed stock report on Tesla (TSLA) as of August 24, 2022. It includes information such as the stock price, market capitalization, fundamentals analysis, financial ratios, analyst ratings, and annual/quarterly financials. The report provides a slightly bullish fundamental analysis score of 6.3/10 for TSLA, noting positives like high market cap and returns, but also negatives like high valuation multiples and leverage.

Recommended
More Related Content
Similar to TSLA Inc.pdf
Similar to TSLA Inc.pdf (20)
More from Stocktargetadvisor.com
More from Stocktargetadvisor.com (20)
Recently uploaded
Recently uploaded (20)
TSLA Inc.pdf
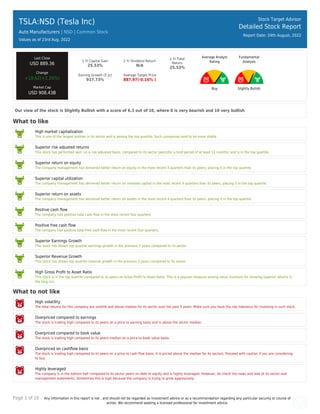
- 1. Page 1 of 10 Any information in this report is not , and should not be regarded as investment advice or as a recommendation regarding any particular security or course of action. We recommend seeking a licensed professional for investment advice. TSLA:NSD (Tesla Inc) Auto Manufacturers | NSD | Common Stock Values as of 23rd Aug, 2022 Stock Target Advisor Detailed Stock Report Report Date: 24th August, 2022 Last Close USD 889.36 Change +19.62(+2.26%) Market Cap USD 908.43B 1 Yr Capital Gain 25.53% 1 Yr Dividend Return N/A 1 Yr Total Return 25.53% Earning Growth (5 yr) 917.73% Average Target Price 887.97(-0.16% ) Average Analyst Rating Buy Fundamental Analysis Slightly Bullish Our view of the stock is Slightly Bullish with a score of 6.3 out of 10, where 0 is very bearish and 10 very bullish What to like High market capitalization This is one of the largest entities in its sector and is among the top quartile. Such companies tend to be more stable. Superior risk adjusted returns This stock has performed well, on a risk adjusted basis, compared to its sector peers(for a hold period of at least 12 months) and is in the top quartile. Superior return on equity The company management has delivered better return on equity in the most recent 4 quarters than its peers, placing it in the top quartile. Superior capital utilization The company management has delivered better return on invested capital in the most recent 4 quarters than its peers, placing it in the top quartile. Superior return on assets The company management has delivered better return on assets in the most recent 4 quarters than its peers, placing it in the top quartile. Positive cash flow The company had positive total cash flow in the most recent four quarters. Positive free cash flow The company had positive total free cash flow in the most recent four quarters. Superior Earnings Growth This stock has shown top quartile earnings growth in the previous 5 years compared to its sector. Superior Revenue Growth This stock has shown top quartile revenue growth in the previous 5 years compared to its sector. High Gross Profit to Asset Ratio This stock is in the top quartile compared to its peers on Gross Profit to Asset Ratio. This is a popular measure among value investors for showing superior returns in the long run. What to not like High volatility The total returns for this company are volatile and above median for its sector over the past 5 years. Make sure you have the risk tolerance for investing in such stock. Overpriced compared to earnings The stock is trading high compared to its peers on a price to earning basis and is above the sector median. Overpriced compared to book value The stock is trading high compared to its peers median on a price to book value basis. Overpriced on cashflow basis The stock is trading high compared to its peers on a price to cash flow basis. It is priced above the median for its sectors. Proceed with caution if you are considering to buy. Highly leveraged The company is in the bottom half compared to its sector peers on debt to equity and is highly leveraged. However, do check the news and look at its sector and management statements. Sometimes this is high because the company is trying to grow aggressively.
- 2. Page 2 of 10 Any information in this report is not , and should not be regarded as investment advice or as a recommendation regarding any particular security or course of action. We recommend seeking a licensed professional for investment advice. Overpriced on free cash flow basis The stock is trading high compared to its peers on a price to free cash flow basis. It is priced above the median for its sectors. Proceed with caution if you are considering to buy.
- 3. Page 3 of 10 Any information in this report is not , and should not be regarded as investment advice or as a recommendation regarding any particular security or course of action. We recommend seeking a licensed professional for investment advice. TSLA:NSD (Tesla Inc) Auto Manufacturers | | Common Stock Stock Target Advisor Detailed Stock Report Report Date: 24th August, 2022 Adjusted Closing Share Volume Relative Returns Relative Performance (Total Returns) Security Capital Gain Dividend Return Total Return TSLA Tesla Inc +25.9% 0 +25.9% QQQ Invesco QQQ Trust -15.8% +0.4% -15.5% Company Overview Tesla, Inc. designs, develops, manufactures, leases, and sells electric vehicles, and energy generation and storage systems in the United States, China, and internationally. The company operates in two segments, Automotive, and Energy Generation and Storage. The Automotive segment offers electric vehicles, as well as sells automotive regulatory credits. It provides sedans and sport utility vehicles through direct and used vehicle sales, a network of Tesla Superchargers, and in-app upgrades; and purchase financing and leasing services. This segment is also involved in the provision of non-warranty after-sales vehicle services, sale of used vehicles, retail merchandise, and vehicle insurance, as well as sale of products to third party customers; services for electric vehicles through its company-owned service locations, and Tesla mobile service technicians; and vehicle limited warranties and extended service plans. The Energy Generation and Storage segment engages in the design, manufacture, installation, sale, and leasing of solar energy generation and energy storage products, and related services to residential, commercial, and industrial customers and utilities through its website, stores, and galleries, as well as through a network of channel partners. This segment also offers service and repairs to its energy product customers, including under warranty; and various financing options to its solar customers. The company was formerly known as Tesla Motors, Inc. and changed its name to Tesla, Inc. in February 2017. Tesla, Inc. was incorporated in 2003 and is headquartered in Austin, Texas.
- 4. Page 4 of 10 Any information in this report is not , and should not be regarded as investment advice or as a recommendation regarding any particular security or course of action. We recommend seeking a licensed professional for investment advice. Company Website https://www.tesla.com Address 13101 Tesla Road, Austin, TX, United States, 78725 Fiscal Year End December Employees 99290 Technical Indicators Value Value Beta 2.18 52 Week High 1,243.49 Short Ratio 0.86 52 Week Low 620.57 Shorted Shares 25,022,667 200 Day Moving Average 902.20 Shorted Shares Previous Month 23,491,892 50 Day Moving Average 780.61 Shares Held By Insiders 1,719.00% Short Percentage 3.00% Shares Held by Institutions 44.40 Dividend Yield N/A
- 5. Page 5 of 10 Any information in this report is not , and should not be regarded as investment advice or as a recommendation regarding any particular security or course of action. We recommend seeking a licensed professional for investment advice. TSLA:NSD (Tesla Inc) Auto Manufacturers | | Common Stock Stock Target Advisor Detailed Stock Report Report Date: 24th August, 2022 Market Performance Market Performance vs. Industry / Classification (Auto Manufacturers) Market Performance vs. Exchange (Nasdaq Global Select) Value Sector Median Percentile Rank Grade Market Median Percentile Rank Grade YTD Capital Gain -15.84% -62.1% 93% -18.4% 53% Dividend Return N/A N/A N/A 1.4% N/A Total Return -15.84% -62.1% 93% -17.2% 52% Trailing 12 Months Capital Gain 25.53% -77.4% 100% -21.2% 94% Dividend Return N/A N/A N/A 2.4% N/A Total Return 25.53% -77.4% 100% -18.9% 93% Trailing 5 Years Capital Gain 1,159.97% -36.5% 100% 7.0% 97% Dividend Return N/A N/A N/A 10.9% N/A Total Return 1,159.97% -36.5% 100% 17.4% 97% Average Annual (5 Year Horizon) Capital Gain 173.68% -5.8% 100% 0.4% 97% Dividend Return N/A N/A N/A 1.8% N/A Total Return 173.68% -5.8% 100% 1.6% 97% Risk Return Profile Volatility (Standard Deviation) 250.49% 39.5% 14% 32.8% 5% Risk Adjusted Return 69.34% N/A 100% 14.3% 93% Market Capitalization 908.43B 0.36B 100% 0.35B 100%
- 6. Page 6 of 10 Any information in this report is not , and should not be regarded as investment advice or as a recommendation regarding any particular security or course of action. We recommend seeking a licensed professional for investment advice. Key Financial Ratios Ratios vs. Industry / Classification (Computer Hardware) Ratios vs. Exchange (Nasdaq Global Select) Value Sector Median Percentile Rank Grade Market Median Percentile Rank Grade Market Value peratio 106.8 31.1 29% 16.8 9% pbratio 25.6 2.5 8% 1.8 4% pcfratio 79.0 -3.3 7% -0.1 4% pfcfratio 64.0 -1.9 8% 0.5 4% Management Effectiveness retequity 29.89% -29.0% 100% -0.9% 91% retinvcap 16.76% -33.2% 100% -0.5% 85% retass 10.96% -18.4% 100% -0.1% 93% debtequityratio 14.09% 14.1% 44% 32.6% 69% Technical Ratios yield N/A N/A N/A 2.7% N/A sratio 0.86 4.12 86% 3.66 81% spercent 2.92% 7.2% 93% 2.8% 49% beta 2.18 2.18 55% 1.07 8%
- 7. Page 7 of 10 Any information in this report is not , and should not be regarded as investment advice or as a recommendation regarding any particular security or course of action. We recommend seeking a licensed professional for investment advice. TSLA:NSD (Tesla Inc) Auto Manufacturers | | Common Stock Stock Target Advisor Detailed Stock Report Report Date: 24th August, 2022 Recent Analyst Ratings Price Action Rating Action Analyst Rating Price date Target Raised by Loop Capital USD 50 » USD 100 2022-08-22 Rates Zacks Research Inc. Buy 2022-08-19 Reiterates STA Research Buy USD 1000 2022-08-19 Target Morningstar Inc. Hold USD 760 2022-08-19 Target Raised by Canaccord Capital Buy » Buy USD 815 » USD 881 2022-08-08 Target Up STA Research Buy USD 1000 2022-08-02 Maintains Citigroup Sell USD 375 » USD 424 2022-08-02 Target Up Daiwa Securities Outperform USD 930 2022-07-25 Target Up JP Morgan & Company Underweight USD 385 » USD 410 2022-07-22 Maintains Wells Fargo Equal-Weight USD 820 » USD 830 2022-07-21 Maintains Bank of America Securities Neutral USD 900 » USD 950 2022-07-21 Maintains Cowen Market Perform USD 700 » USD 733 2022-07-21 Maintains Mizuho Securities Buy USD 1150 » USD 1175 2022-07-21 Maintains Canaccord Capital Buy USD 801 » USD 815 2022-07-21 Target Lowered by Robert W Baird USD 1108 » USD 949 2022-07-21 Maintains Berenberg Capital Markets Hold USD 900 » USD 850 2022-07-21 Maintains GLJ Research Sell USD 67 » USD 73 2022-07-19 Resumed Credit Suisse Outperform USD 1000 2022-07-19 Maintains STA Research Buy USD 825 2022-07-18 Maintains Barclays Underweight USD 370 » USD 380 2022-07-18 Maintains Morgan Stanley Overweight USD 1200 » USD 1150 2022-07-14 Initiates Coverage On Truist Securities Buy USD 1000 2022-07-14 Reiterated by Canaccord Capital Buy USD 801 2022-07-13 Target Lowered by Wells Fargo Equal Weight USD 900 » USD 820 2022-07-11 Maintains JP Morgan & Company Underweight USD 395 » USD 385 2022-07-05
- 8. Page 8 of 10 Any information in this report is not , and should not be regarded as investment advice or as a recommendation regarding any particular security or course of action. We recommend seeking a licensed professional for investment advice. TSLA:NSD (Tesla Inc) Auto Manufacturers | | Common Stock Stock Target Advisor Detailed Stock Report Report Date: 24th August, 2022 Annual Financial (USD)
- 9. Page 9 of 10 Any information in this report is not , and should not be regarded as investment advice or as a recommendation regarding any particular security or course of action. We recommend seeking a licensed professional for investment advice. TSLA:NSD (Tesla Inc) Auto Manufacturers | | Common Stock Stock Target Advisor Detailed Stock Report Report Date: 24th August, 2022 Quarterly Financial (USD)
- 10. Page 10 of 10 Any information in this report is not , and should not be regarded as investment advice or as a recommendation regarding any particular security or course of action. We recommend seeking a licensed professional for investment advice. TSLA:NSD (Tesla Inc) Auto Manufacturers | | Common Stock Stock Target Advisor Detailed Stock Report Report Date: 24th August, 2022 Largest Industry Peers for Auto Manufacturers Symbol Company Name Price(Change) Market Cap LI Li Auto Inc -1.49 (-4.8%) USD 28.86B GOEV Canoo Inc -0.22 (-6.1%) USD 0.98B ARVL Arrival Vault USA Inc +0.01 (+0.8%) USD 0.77B FFIE Faraday Future Intelligent Ele.. -0.07 (-3.8%) USD 0.66B WKHS Workhorse Group Inc -0.02 (-0.6%) USD 0.56B NIU Niu Technologies +0.11 (+1.8%) USD 0.47B BLBD Blue Bird Corp -0.01 (-0.1%) USD 0.36B CENN Cenntro Electric Group Ltd +0.07 (+5.2%) USD 0.35B SEV Sono Group NV -0.06 (-2.0%) USD 0.26B SOLO Electrameccanica Vehicles Corp +0.05 (+3.3%) USD 0.18B ETFs Containing TSLA Symbol Company Name Weight Mer Price(Change) Market Cap ZPRC:F SSgA SPDR ETFs Europe II plc -.. 1.26 % 0.00 % -0.11 (0.2%) USD 0.61B SPF1:F SSgA SPDR ETFs Europe II plc -.. 1.26 % 0.00 % -0.10 (0.2%) N/A SPF1:XETRA SPDR Refinitiv Global Converti.. 1.26 % 0.00 % +0.19 (+0.2%) USD 0.36B ZPRC:XETRA SPDR Thomson Reuters Global Co.. 1.26 % 0.00 % +0.08 (+0.2%) USD 0.60B GCVB:LSE SSgA SPDR ETFs Europe II plc -.. 1.11 % 0.00 % +0.21 (+0.2%) USD 0.60B GLCB:LSE SPDR Thomson Reuters Global Co.. 1.07 % 0.00 % -0.10 (0.2%) USD 0.60B XMAW:F Xtrackers MSCI AC World ESG Sc.. 0.77 % 0.00 % -0.11 (0.2%) USD 1.30B XMAW:XETRA Xtrackers MSCI AC World ESG Sc.. 0.77 % 0.00 % -0.22 (0.2%) USD 1.30B SXR8:XETRA iShares Core S&P 500 UCITS ETF.. 0.00 % 0.00 % -4.31 (0.2%) USD 56.01B SXR4:XETRA iShares VII PLC - iShares MSCI.. 0.00 % 0.00 % -4.34 (0.2%) USD 0.55B The Stock Target Advisor platform run millions of calculations every day on over 30,000 Canadian and American stocks, comparing and ranking their financial and market performance against their sectors and exchange. We represent the percentile ranking using the following grading system. Letter Grade Percentage Letter Grade Percentage Letter Grade Percentage A+ 97%-100% A 93%-96% A- 90%-92% B+ 97%-89% B 83%-86% B- 80%-82% C+ 77%-79% C 73%-76% C- 70%-72% D+ 67%-69% D 63%-66% D- 60%-62% F 0%-59%