Palo Alto Networks Inc.pdf
•
0 likes•14 views

PANW Stock Forecast & Price: Based on the Palo Alto Networks Inc stock forecasts from 25 analysts, the average analyst target price for Palo Alto Networks Inc is USD 647.95 over the next 12 months. Palo Alto Networks Inc’s average analyst rating is Strong Buy. Stock Target Advisor’s own stock analysis of Palo Alto Networks Inc is Slightly Bullish , which is based on 5 positive signals and 4 negative signals. At the last closing, Palo Alto Networks Inc’s stock price was USD 569.51. Palo Alto Networks Inc’s stock price has changed by +8.57% over the past week, +11.41% over the past month and +52.86% over the last year.

Recommended
More Related Content
Similar to Palo Alto Networks Inc.pdf
Similar to Palo Alto Networks Inc.pdf (20)
More from Stocktargetadvisor.com
More from Stocktargetadvisor.com (20)
Recently uploaded
Recently uploaded (20)
Palo Alto Networks Inc.pdf
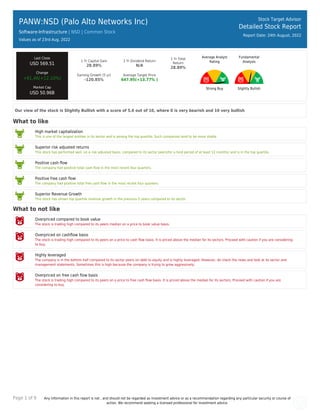
- 1. Page 1 of 9 Any information in this report is not , and should not be regarded as investment advice or as a recommendation regarding any particular security or course of action. We recommend seeking a licensed professional for investment advice. PANW:NSD (Palo Alto Networks Inc) Software-Infrastructure | NSD | Common Stock Values as of 23rd Aug, 2022 Stock Target Advisor Detailed Stock Report Report Date: 24th August, 2022 Last Close USD 569.51 Change +61.46(+12.10%) Market Cap USD 50.96B 1 Yr Capital Gain 28.89% 1 Yr Dividend Return N/A 1 Yr Total Return 28.89% Earning Growth (5 yr) -120.85% Average Target Price 647.95(+13.77% ) Average Analyst Rating Strong Buy Fundamental Analysis Slightly Bullish Our view of the stock is Slightly Bullish with a score of 5.6 out of 10, where 0 is very bearish and 10 very bullish What to like High market capitalization This is one of the largest entities in its sector and is among the top quartile. Such companies tend to be more stable. Superior risk adjusted returns This stock has performed well, on a risk adjusted basis, compared to its sector peers(for a hold period of at least 12 months) and is in the top quartile. Positive cash flow The company had positive total cash flow in the most recent four quarters. Positive free cash flow The company had positive total free cash flow in the most recent four quarters. Superior Revenue Growth This stock has shown top quartile revenue growth in the previous 5 years compared to its sector. What to not like Overpriced compared to book value The stock is trading high compared to its peers median on a price to book value basis. Overpriced on cashflow basis The stock is trading high compared to its peers on a price to cash flow basis. It is priced above the median for its sectors. Proceed with caution if you are considering to buy. Highly leveraged The company is in the bottom half compared to its sector peers on debt to equity and is highly leveraged. However, do check the news and look at its sector and management statements. Sometimes this is high because the company is trying to grow aggressively. Overpriced on free cash flow basis The stock is trading high compared to its peers on a price to free cash flow basis. It is priced above the median for its sectors. Proceed with caution if you are considering to buy.
- 2. Page 2 of 9 Any information in this report is not , and should not be regarded as investment advice or as a recommendation regarding any particular security or course of action. We recommend seeking a licensed professional for investment advice. PANW:NSD (Palo Alto Networks Inc) Software-Infrastructure | | Common Stock Stock Target Advisor Detailed Stock Report Report Date: 24th August, 2022 Adjusted Closing Share Volume Relative Returns Relative Performance (Total Returns) Security Capital Gain Dividend Return Total Return PANW Palo Alto Networks Inc +52.9% 0 +52.9% QQQ Invesco QQQ Trust -15.8% +0.4% -15.5% Company Overview Palo Alto Networks, Inc. provides cybersecurity solutions worldwide. The company offers firewall appliances and software; Panorama, a security management solution for the control of firewall appliances and software deployed on an end-customer's network and instances in public or private cloud environments, as a virtual or a physical appliance; and virtual system upgrades, which are available as extensions to the virtual system capacity that ships with physical appliances. It also provides subscription services covering the areas of threat prevention, malware and persistent threat, uniform resource locator filtering, laptop and mobile device protection, and firewall; and DNS security, Internet of Things security, SaaS security API, and SaaS security inline, as well as threat intelligence, and data loss prevention. In addition, the company offers cloud security, secure access, security analytics and automation, and threat intelligence and cyber security consulting; professional services, including architecture design and planning, implementation, configuration, and firewall migration; education services, such as certifications, as well as online and in-classroom training; and support services. Palo Alto Networks, Inc. sells its products and services through its channel partners, as well as directly to medium to large enterprises, service providers, and government entities operating in various industries, including education, energy, financial services, government entities, healthcare, Internet and media, manufacturing, public sector, and telecommunications. The company was incorporated in 2005 and is headquartered in Santa Clara, California.
- 3. Page 3 of 9 Any information in this report is not , and should not be regarded as investment advice or as a recommendation regarding any particular security or course of action. We recommend seeking a licensed professional for investment advice. Company Website https://www.paloaltonetworks.com Address 3000 Tannery Way, Santa Clara, CA, United States, 95054 Fiscal Year End July Employees 11870 Technical Indicators Value Value Beta 1.18 52 Week High 640.90 Short Ratio 5.82 52 Week Low 421.55 Shorted Shares 6,954,194 200 Day Moving Average 529.05 Shorted Shares Previous Month 7,261,762 50 Day Moving Average 503.55 Shares Held By Insiders 178.90% Short Percentage 7.00% Shares Held by Institutions 89.71 Dividend Yield N/A
- 4. Page 4 of 9 Any information in this report is not , and should not be regarded as investment advice or as a recommendation regarding any particular security or course of action. We recommend seeking a licensed professional for investment advice. PANW:NSD (Palo Alto Networks Inc) Software-Infrastructure | | Common Stock Stock Target Advisor Detailed Stock Report Report Date: 24th August, 2022 Market Performance Market Performance vs. Industry / Classification (Software-Infrastructure) Market Performance vs. Exchange (Nasdaq Global Select) Value Sector Median Percentile Rank Grade Market Median Percentile Rank Grade YTD Capital Gain 2.29% -32.3% 90% -18.4% 86% Dividend Return N/A 0.9% N/A 1.4% N/A Total Return 2.29% -32.3% 90% -17.2% 85% Trailing 12 Months Capital Gain 28.89% -38.8% 95% -21.2% 94% Dividend Return N/A 2.0% N/A 2.4% N/A Total Return 28.89% -38.4% 95% -18.9% 94% Trailing 5 Years Capital Gain 332.30% 26.4% 86% 7.0% 93% Dividend Return N/A 12.7% N/A 10.9% N/A Total Return 332.30% 26.4% 86% 17.4% 93% Average Annual (5 Year Horizon) Capital Gain 35.92% 13.3% 73% 0.4% 87% Dividend Return N/A 2.2% N/A 1.8% N/A Total Return 35.92% 13.3% 72% 1.6% 86% Risk Return Profile Volatility (Standard Deviation) 33.46% 38.4% 59% 32.8% 49% Risk Adjusted Return 107.35% N/A 92% 14.3% 99% Market Capitalization 50.96B 1.67B 96% 0.36B 98%
- 5. Page 5 of 9 Any information in this report is not , and should not be regarded as investment advice or as a recommendation regarding any particular security or course of action. We recommend seeking a licensed professional for investment advice. Key Financial Ratios Ratios vs. Industry / Classification (Computer Hardware) Ratios vs. Exchange (Nasdaq Global Select) Value Sector Median Percentile Rank Grade Market Median Percentile Rank Grade Market Value peratio N/A 41.5 N/A 16.8 N/A pbratio 151.8 5.1 4% 1.8 1% pcfratio 33.9 12.8 28% -0.1 9% pfcfratio 826.7 -0.6 1% 0.5 0% Management Effectiveness retequity -58.38% -18.3% 26% -0.9% 21% retinvcap -8.27% -4.7% 47% -0.5% 38% retass -1.40% -4.4% 61% -0.1% 44% debtequityratio 218.45% 44.7% 11% 32.6% 10% Technical Ratios yield N/A 1.8% N/A 2.7% N/A sratio 5.82 4.69 36% 3.66 32% spercent 7.10% 3.6% 21% 2.8% 25% beta 1.18 1.04 39% 1.07 41%
- 6. Page 6 of 9 Any information in this report is not , and should not be regarded as investment advice or as a recommendation regarding any particular security or course of action. We recommend seeking a licensed professional for investment advice. PANW:NSD (Palo Alto Networks Inc) Software-Infrastructure | | Common Stock Stock Target Advisor Detailed Stock Report Report Date: 24th August, 2022 Recent Analyst Ratings Price Action Rating Action Analyst Rating Price date Maintains Wolfe Research Outperform USD 700 » USD 715 2022-08-23 Target Raised by Evercore ISI USD 620 2022-08-23 Maintains Guggenheim Securities Buy USD 625 » USD 640 2022-08-23 Maintains Northland Capital Outperform USD 728 » USD 733 2022-08-23 Maintains RBC Royalbank Outperform USD 680 » USD 700 2022-08-23 Maintains Stifel Nicolaus Research Buy USD 600 » USD 645 2022-08-23 Maintains Mizuho Securities Buy USD 600 » USD 660 2022-08-23 Target Up Jefferies Financial LLC USD 650 2022-08-23 Maintains BMO Financial Outperform USD 650 » USD 675 2022-08-23 Maintains Citigroup Buy USD 605 » USD 640 2022-08-23 Maintains KeyBanc Overweight USD 630 » USD 680 2022-08-23 Maintains Deutsche Bank Capital Buy USD 605 » USD 625 2022-08-23 Maintains UBS Neutral USD 545 » USD 590 2022-08-23 Maintains Wedbush Outperform USD 580 » USD 620 2022-08-23 Maintains Credit Suisse Outperform USD 635 » USD 685 2022-08-23 Maintains Piper Sandler Overweight USD 650 » USD 690 2022-08-23 Maintains Barclays Overweight USD 605 » USD 695 2022-08-23 Maintains Raymond James Capital Outperform USD 610 » USD 640 2022-08-23 Maintains Wells Fargo Overweight USD 700 » USD 750 2022-08-23 Target Down Barclays USD 605 2022-08-15 Initiated by Guggenheim Securities Buy USD 625 2022-08-12 Initiated by Wolfe Research Outperform USD 700 2022-08-01 Target Lowered by Citigroup USD 610 » USD 605 2022-07-22 Target Lowered by Piper Sandler USD 675 » USD 650 2022-07-13 Target Raised by BMO Financial Outperform USD 615 » USD 650 2022-07-08
- 7. Page 7 of 9 Any information in this report is not , and should not be regarded as investment advice or as a recommendation regarding any particular security or course of action. We recommend seeking a licensed professional for investment advice. PANW:NSD (Palo Alto Networks Inc) Software-Infrastructure | | Common Stock Stock Target Advisor Detailed Stock Report Report Date: 24th August, 2022 Annual Financial (USD)
- 8. Page 8 of 9 Any information in this report is not , and should not be regarded as investment advice or as a recommendation regarding any particular security or course of action. We recommend seeking a licensed professional for investment advice. PANW:NSD (Palo Alto Networks Inc) Software-Infrastructure | | Common Stock Stock Target Advisor Detailed Stock Report Report Date: 24th August, 2022 Quarterly Financial (USD)
- 9. Page 9 of 9 Any information in this report is not , and should not be regarded as investment advice or as a recommendation regarding any particular security or course of action. We recommend seeking a licensed professional for investment advice. PANW:NSD (Palo Alto Networks Inc) Software-Infrastructure | | Common Stock Stock Target Advisor Detailed Stock Report Report Date: 24th August, 2022 Largest Industry Peers for Software-Infrastructure Symbol Company Name Price(Change) Market Cap MSFT Microsoft Corporation -1.31 (-0.5%) USD 2,071.43B ADBE Adobe Systems Incorporated -0.94 (-0.2%) USD 192.51B SNPS Synopsys Inc +0.90 (+0.3%) USD 54.78B CRWD Crowdstrike Holdings Inc +6.48 (+3.5%) USD 44.21B FTNT Fortinet Inc +0.27 (+0.5%) USD 39.68B ZS Zscaler Inc +2.35 (+1.4%) USD 23.58B MDB MongoDB -3.50 (-1.1%) USD 22.96B VRSN VeriSign Inc -1.83 (-0.9%) USD 21.89B SPLK Splunk Inc +2.04 (+1.9%) USD 16.94B CHKP Check Point Software Technolog.. +0.23 (+0.2%) USD 15.52B ETFs Containing PANW Symbol Company Name Weight Mer Price(Change) Market Cap FXL First Trust Technology AlphaDE.. 0.00 % 0.63 % -0.09 (-0.8%) USD 1.14B CYBR-U:CA Evolve Cyber Security Index Fu.. 0.00 % 0.00 % N/A N/A SKYY:LSE HAN-GINS Cloud Technology Equa.. 0.00 % 0.00 % +0.06 (+-0.8%) USD 0.02B USPY:LSE L&G Cyber Security UCITS ETF 0.00 % 0.00 % +0.33 (+-0.8%) USD 2.61B WTAI:LSE WisdomTree Artificial Intellig.. 0.00 % 0.00 % +0.35 (+-0.8%) USD 0.33B 2B79:XETRA iShares Digitalisation UCITS A.. 0.00 % 0.00 % -0.05 (-0.8%) USD 1.14B EL41:XETRA Deka MSCI USA MC UCITS ETF 0.00 % 0.00 % -0.47 (-0.8%) USD 0.04B IS4S:XETRA iShares Digital Security UCITS.. 0.00 % 0.00 % +0.02 (+-0.8%) USD 1.73B USPY:XETRA L&G Cyber Security UCITS ETF 0.00 % 0.00 % +0.25 (+-0.8%) USD 2.61B BKMC BNY Mellon US Mid Cap Core Equ.. 0.00 % 0.00 % -0.06 (-0.8%) N/A The Stock Target Advisor platform run millions of calculations every day on over 30,000 Canadian and American stocks, comparing and ranking their financial and market performance against their sectors and exchange. We represent the percentile ranking using the following grading system. Letter Grade Percentage Letter Grade Percentage Letter Grade Percentage A+ 97%-100% A 93%-96% A- 90%-92% B+ 97%-89% B 83%-86% B- 80%-82% C+ 77%-79% C 73%-76% C- 70%-72% D+ 67%-69% D 63%-66% D- 60%-62% F 0%-59%