Aldeyra The (ALDX) Stock Analysis Report
•
0 likes•55 views

Aldeyra Therapeutics, Inc., a biotechnology company, develops and commercializes medicines for immune-mediated ocular and systemic diseases. The company's lead product candidate is reproxalap. Based on the Aldeyra The stock forecasts from 5 analysts, the average analyst target price for Aldeyra The is USD 19.67 over the next 12 months. Aldeyra The’s average analyst rating is Strong Buy. Stock Target Advisor’s own stock analysis of Aldeyra The is Bearish, which is based on 1 positive signals and 3 negative signals. At the last closing, Aldeyra The’s stock price was USD 3.86. Aldeyra The’s stock price has changed by +26.14% over the past week, +56.28% over the past month and -69.29% over the last year.

Recommended
Recommended
More Related Content
Similar to Aldeyra The (ALDX) Stock Analysis Report
Similar to Aldeyra The (ALDX) Stock Analysis Report (20)
More from Stock Target Advisor
More from Stock Target Advisor (20)
Recently uploaded
Recently uploaded (20)
Aldeyra The (ALDX) Stock Analysis Report
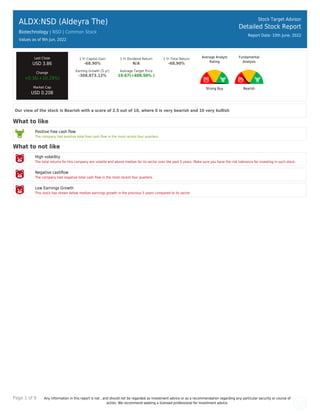
- 1. Page 1 of 9 Any information in this report is not , and should not be regarded as investment advice or as a recommendation regarding any particular security or course of action. We recommend seeking a licensed professional for investment advice. ALDX:NSD (Aldeyra The) Biotechnology | NSD | Common Stock Values as of 9th Jun, 2022 Stock Target Advisor Detailed Stock Report Report Date: 10th June, 2022 Last Close USD 3.86 Change +0.36(+10.29%) Market Cap USD 0.20B 1 Yr Capital Gain -68.90% 1 Yr Dividend Return N/A 1 Yr Total Return -68.90% Earning Growth (5 yr) -308,873.12% Average Target Price 19.67(+409.50% ) Average Analyst Rating Strong Buy Fundamental Analysis Bearish Our view of the stock is Bearish with a score of 2.5 out of 10, where 0 is very bearish and 10 very bullish What to like Positive free cash flow The company had positive total free cash flow in the most recent four quarters. What to not like High volatility The total returns for this company are volatile and above median for its sector over the past 5 years. Make sure you have the risk tolerance for investing in such stock. Negative cashflow The company had negative total cash flow in the most recent four quarters. Low Earnings Growth This stock has shown below median earnings growth in the previous 5 years compared to its sector
- 2. Page 2 of 9 Any information in this report is not , and should not be regarded as investment advice or as a recommendation regarding any particular security or course of action. We recommend seeking a licensed professional for investment advice. ALDX:NSD (Aldeyra The) Biotechnology | | Common Stock Stock Target Advisor Detailed Stock Report Report Date: 10th June, 2022 Adjusted Closing Share Volume Relative Returns Relative Performance (Total Returns) Security Capital Gain Dividend Return Total Return ALDX Aldeyra The -69.3% 0 -69.3% QQQ Invesco QQQ Trust -11.1% +0.4% -10.7% Company Overview Aldeyra Therapeutics, Inc., a biotechnology company, develops and commercializes medicines for immune-mediated ocular and systemic diseases. The company's lead product candidate is reproxalap, a reactive aldehyde species (RASP)modulator, which is in Phase III clinical trial for the treatment of dry eye diseases and allergic conjunctivitis. It also develops ADX-629, a first-in-class orally administered RASP modulator that is Phase II clinical trial for psoriasis, asthma, and COVID-19; and ADX-2191, a dihydrofolate reductase inhibitor which is in phase 3 for the prevention of proliferative vitreoretinopathy, and phase II clinical trial for the treatment of retinitis pigmentosa, as well as for treating primary vitreoretinal lymphoma. The company has a license agreement with Madrigal Pharmaceuticals, Inc. for developing ADX-1612, which inhibits the protein chaperome for the treatment of inflammatory diseases. The company was formerly known as Aldexa Therapeutics, Inc. and changed its name to Aldeyra Therapeutics, Inc. in March 2014. Aldeyra Therapeutics, Inc. was incorporated in 2004 and is based in Lexington, Massachusetts. Address: 131 Hartwell Avenue, Lexington, MA, United States, 02421
- 3. Page 3 of 9 Any information in this report is not , and should not be regarded as investment advice or as a recommendation regarding any particular security or course of action. We recommend seeking a licensed professional for investment advice. Company Website https://www.aldeyra.com Address 131 Hartwell Avenue, Lexington, MA, United States, 02421 Fiscal Year End December Employees 14 Technical Indicators Value Value Beta 1.64 52 Week High 12.54 Short Ratio 3.55 52 Week Low 2.36 Shorted Shares 2,900,665 200 Day Moving Average 5.66 Shorted Shares Previous Month 2,908,423 50 Day Moving Average 3.47 Shares Held By Insiders 146.10% Short Percentage 6.00% Shares Held by Institutions 65.92 Dividend Yield N/A
- 4. Page 4 of 9 Any information in this report is not , and should not be regarded as investment advice or as a recommendation regarding any particular security or course of action. We recommend seeking a licensed professional for investment advice. ALDX:NSD (Aldeyra The) Biotechnology | | Common Stock Stock Target Advisor Detailed Stock Report Report Date: 10th June, 2022 Market Performance Market Performance vs. Industry / Classification (Biotechnology) Market Performance vs. Exchange (Nasdaq Global Select) Value Sector Median Percentile Rank Grade Market Median Percentile Rank Grade YTD Capital Gain -3.50% -43.0% 90% -18.3% 71% Dividend Return N/A 1.0% N/A 1.0% N/A Total Return -3.50% -43.0% 90% -17.9% 70% Trailing 12 Months Capital Gain -68.90% -66.5% 46% -22.1% 22% Dividend Return N/A 1.5% N/A 2.3% N/A Total Return -68.90% -66.5% 46% -21.1% 22% Trailing 5 Years Capital Gain -23.56% -58.4% 65% 3.6% 32% Dividend Return N/A 13.9% N/A 10.9% N/A Total Return -23.56% -55.9% 65% 14.1% 28% Average Annual (5 Year Horizon) Capital Gain 26.42% 2.9% 72% 2.3% 80% Dividend Return N/A 9.4% N/A 1.8% N/A Total Return 26.42% 3.9% 71% 4.2% 80% Risk Return Profile Volatility (Standard Deviation) 100.47% 58.3% 24% 32.2% 13% Risk Adjusted Return 26.30% N/A 67% 20.5% 56% Market Capitalization 0.20B 0.13B 59% 0.32B 40%
- 5. Page 5 of 9 Any information in this report is not , and should not be regarded as investment advice or as a recommendation regarding any particular security or course of action. We recommend seeking a licensed professional for investment advice. Key Financial Ratios Ratios vs. Industry / Classification (Computer Hardware) Ratios vs. Exchange (Nasdaq Global Select) Value Sector Median Percentile Rank Grade Market Median Percentile Rank Grade Market Value peratio N/A 7.9 N/A 17.0 N/A pbratio 0.9 1.8 74% 1.6 81% pcfratio 0.0 -2.6 10% -0.1 49% pfcfratio 0.6 0.6 54% 10.0 87% Management Effectiveness retequity -39.95% -57.0% 68% 0.3% 27% retinvcap -38.01% -54.2% 67% -0.6% 25% retass -20.90% -26.2% 63% 0.1% 20% debtequityratio 7.54% 20.7% 69% 32.1% 76% Technical Ratios yield N/A 1.9% N/A 2.6% N/A sratio 3.55 4.81 61% 3.11 45% spercent 6.12% 5.0% 42% 2.9% 29% beta 1.64 1.41 34% 1.10 21%
- 6. Page 6 of 9 Any information in this report is not , and should not be regarded as investment advice or as a recommendation regarding any particular security or course of action. We recommend seeking a licensed professional for investment advice. ALDX:NSD (Aldeyra The) Biotechnology | | Common Stock Stock Target Advisor Detailed Stock Report Report Date: 10th June, 2022 Recent Analyst Ratings Price Action Rating Action Analyst Rating Price date Maintains Citigroup Buy USD 21 » USD 26 2022-06-09 Target Up Oppenheimer Holdings USD 11 2022-06-09 Target Up Jones Trading USD 17 2022-06-09 Initiated by Berenberg Capital Markets Buy USD 28 2022-05-24 Maintains SVB Leerink Outperform USD 24 » USD 15 2021-12-21 Maintains Citigroup Buy USD 25 » USD 21 2021-12-21 Reiterated by SVB Leerink Buy USD 24 2021-12-01 Target Raised by Citigroup USD 22 » USD 25 2021-04-28 Reiterated by SVB Leerink Buy USD 22 2021-04-25 Initiates Coverage On SVB Leerink Outperform USD 22 2021-03-12 Initiated by HC Wainwright Buy USD 26 2021-02-08 Initiated by Berenberg Capital Markets Buy USD 32 2020-12-16 Initiates Coverage On Jefferies Financial LLC Buy USD 24 2020-10-30 Initiated by Alliance Global Partners Buy USD 32 2020-09-22 Target Lowered by Citigroup Buy USD 24 » USD 22 2020-08-11 Reiterated by Oppenheimer Holdings Buy USD 15 2020-08-07 Initiates Coverage On Oppenheimer Holdings Outperform USD 12 2020-05-12 Initiated by Oppenheimer Holdings Outperform 2020-05-11 Assumes Cantor Fitzgerald Securities Overweight USD 33 2019-10-22 Reiterates Cantor Fitzgerald Securities Buy USD 30 » USD 35 2019-03-26 Reiterates Citigroup Buy » Positive USD 32 » USD 38 2019-03-26 Set Price Target Cantor Fitzgerald Securities Buy USD 30 2019-01-29 Initiates Citigroup Buy » Buy USD 23 2018-12-04 Set Price Target Cantor Fitzgerald Securities Buy USD 30 2018-11-14 Set Price Target Cantor Fitzgerald Securities Buy USD 30 2018-10-04
- 7. Page 7 of 9 Any information in this report is not , and should not be regarded as investment advice or as a recommendation regarding any particular security or course of action. We recommend seeking a licensed professional for investment advice. ALDX:NSD (Aldeyra The) Biotechnology | | Common Stock Stock Target Advisor Detailed Stock Report Report Date: 10th June, 2022 Annual Financial (USD)
- 8. Page 8 of 9 Any information in this report is not , and should not be regarded as investment advice or as a recommendation regarding any particular security or course of action. We recommend seeking a licensed professional for investment advice. ALDX:NSD (Aldeyra The) Biotechnology | | Common Stock Stock Target Advisor Detailed Stock Report Report Date: 10th June, 2022 Quarterly Financial (USD)
- 9. Page 9 of 9 Any information in this report is not , and should not be regarded as investment advice or as a recommendation regarding any particular security or course of action. We recommend seeking a licensed professional for investment advice. ALDX:NSD (Aldeyra The) Biotechnology | | Common Stock Stock Target Advisor Detailed Stock Report Report Date: 10th June, 2022 Largest Industry Peers for Biotechnology Symbol Company Name Price(Change) Market Cap VRTX Vertex Pharmaceuticals Inc -14.84 (-5.4%) USD 70.22B REGN Regeneron Pharmaceuticals Inc -32.28 (-5.3%) USD 66.76B MRNA Moderna Inc -14.49 (-9.8%) USD 57.81B ALXN Alexion Pharmaceuticals Inc N/A USD 40.34B BNTX BioNTech SE -12.46 (-7.7%) USD 38.91B RPRX Royalty Pharma plc -0.41 (-1.0%) USD 27.86B SGEN Seagen Inc -2.54 (-1.8%) USD 26.56B IMMU Immunomedics, Inc N/A USD 20.31B GMAB Genmab AS -1.27 (-4.1%) USD 20.15B BGNE BeiGene Ltd -11.41 (-7.0%) USD 18.09B The Stock Target Advisor platform run millions of calculations every day on over 30,000 Canadian and American stocks, comparing and ranking their financial and market performance against their sectors and exchange. We represent the percentile ranking using the following grading system. Letter Grade Percentage Letter Grade Percentage Letter Grade Percentage A+ 97%-100% A 93%-96% A- 90%-92% B+ 97%-89% B 83%-86% B- 80%-82% C+ 77%-79% C 73%-76% C- 70%-72% D+ 67%-69% D 63%-66% D- 60%-62% F 0%-59%