Autodesk Inc (ADSK) Stock Analysis

Autodesk, Inc. provides 3D design, engineering, and entertainment software and services worldwide. The company offers AutoCAD Civil 3D, a surveying, design, analysis, and documentation solution for civil engineering, including land development and transportation. Based on the Autodesk Inc stock forecasts from 19 analysts, the average analyst target price for Autodesk Inc is USD 307.36 over the next 12 months. Autodesk Inc’s average analyst rating is Strong Buy. Stock Target Advisor’s own stock analysis of Autodesk Inc is Slightly Bullish , which is based on 9 positive signals and 5 negative signals. At the last closing, Autodesk Inc’s stock price was USD 195.64. Autodesk Inc’s stock price has changed by +4.95% over the past week, -0.55% over the past month and -28.80% over the last year.

Recommended
Recommended
More Related Content
Similar to Autodesk Inc (ADSK) Stock Analysis
Similar to Autodesk Inc (ADSK) Stock Analysis (20)
More from Stock Target Advisor
More from Stock Target Advisor (20)
Recently uploaded
Recently uploaded (16)
Autodesk Inc (ADSK) Stock Analysis
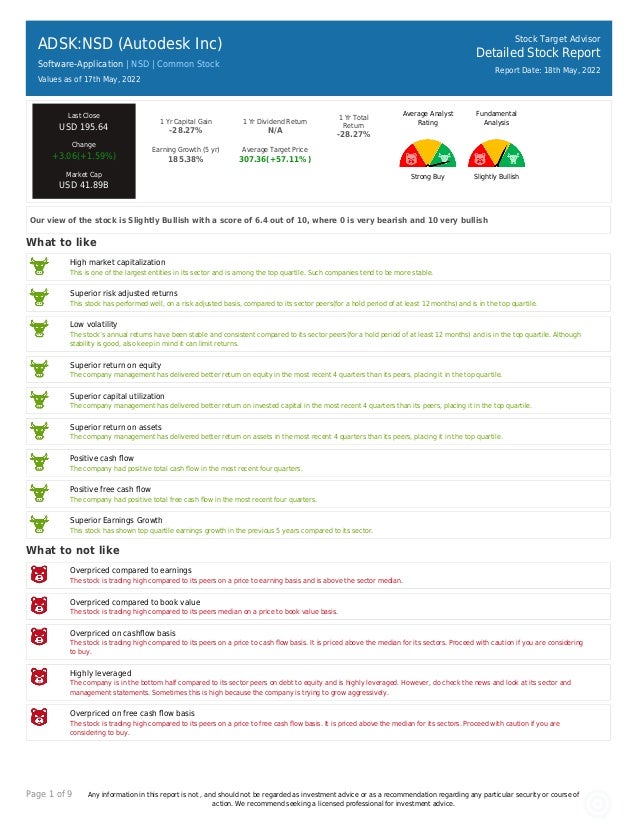
- 1. Page 1 of 9 Any information in this report is not , and should not be regarded as investment advice or as a recommendation regarding any particular security or course of action. We recommend seeking a licensed professional for investment advice. ADSK:NSD (Autodesk Inc) Software-Application | NSD | Common Stock Values as of 17th May, 2022 Stock Target Advisor Detailed Stock Report Report Date: 18th May, 2022 Last Close USD 195.64 Change +3.06(+1.59%) Market Cap USD 41.89B 1 Yr Capital Gain -28.27% 1 Yr Dividend Return N/A 1 Yr Total Return -28.27% Earning Growth (5 yr) 185.38% Average Target Price 307.36(+57.11% ) Average Analyst Rating Strong Buy Fundamental Analysis Slightly Bullish Our view of the stock is Slightly Bullish with a score of 6.4 out of 10, where 0 is very bearish and 10 very bullish What to like High market capitalization This is one of the largest entities in its sector and is among the top quartile. Such companies tend to be more stable. Superior risk adjusted returns This stock has performed well, on a risk adjusted basis, compared to its sector peers(for a hold period of at least 12 months) and is in the top quartile. Low volatility The stock’s annual returns have been stable and consistent compared to its sector peers(for a hold period of at least 12 months) and is in the top quartile. Although stability is good, also keep in mind it can limit returns. Superior return on equity The company management has delivered better return on equity in the most recent 4 quarters than its peers, placing it in the top quartile. Superior capital utilization The company management has delivered better return on invested capital in the most recent 4 quarters than its peers, placing it in the top quartile. Superior return on assets The company management has delivered better return on assets in the most recent 4 quarters than its peers, placing it in the top quartile. Positive cash flow The company had positive total cash flow in the most recent four quarters. Positive free cash flow The company had positive total free cash flow in the most recent four quarters. Superior Earnings Growth This stock has shown top quartile earnings growth in the previous 5 years compared to its sector. What to not like Overpriced compared to earnings The stock is trading high compared to its peers on a price to earning basis and is above the sector median. Overpriced compared to book value The stock is trading high compared to its peers median on a price to book value basis. Overpriced on cashflow basis The stock is trading high compared to its peers on a price to cash flow basis. It is priced above the median for its sectors. Proceed with caution if you are considering to buy. Highly leveraged The company is in the bottom half compared to its sector peers on debt to equity and is highly leveraged. However, do check the news and look at its sector and management statements. Sometimes this is high because the company is trying to grow aggressively. Overpriced on free cash flow basis The stock is trading high compared to its peers on a price to free cash flow basis. It is priced above the median for its sectors. Proceed with caution if you are considering to buy.
- 2. Page 2 of 9 Any information in this report is not , and should not be regarded as investment advice or as a recommendation regarding any particular security or course of action. We recommend seeking a licensed professional for investment advice. ADSK:NSD (Autodesk Inc) Software-Application | | Common Stock Stock Target Advisor Detailed Stock Report Report Date: 18th May, 2022 Adjusted Closing Share Volume Relative Returns Relative Performance (Total Returns) Security Capital Gain Dividend Return Total Return ADSK Autodesk Inc -28.8% 0 -28.8% QQQ Invesco QQQ Trust Series 1 -5.6% +0.4% -5.2% Company Overview Autodesk, Inc. provides 3D design, engineering, and entertainment software and services worldwide. The company offers AutoCAD Civil 3D, a surveying, design, analysis, and documentation solution for civil engineering, including land development, transportation, and environmental projects; BIM 360, a construction management cloud-based software; AutoCAD, a software for professional design, drafting, detailing, and visualization; AutoCAD LT, a drafting and detailing software; computer-aided manufacturing (CAM) software for computer numeric control machining, inspection, and modelling for manufacturing; Fusion 360, a 3D CAD, CAM, and computer-aided engineering tool; and Industry Collections tools for professionals in architecture, engineering and construction, product design and manufacturing, and media and entertainment collection industries. It also provides Inventor tools for 3D mechanical design, simulation, analysis, tooling, visualization, and documentation; Vault, a data management software to manage data in one central location, accelerate design processes, and streamline internal/external collaboration; Maya and 3ds Max software products that offer 3D modeling, animation, effects, rendering, and compositing solutions; and ShotGrid, a cloud-based software for review and production tracking in the media and entertainment industry. It sells its products and services to customers directly, as well as through a network of resellers and distributors. Autodesk, Inc. was incorporated in 1982 and is headquartered in San Rafael, California. Address: 111 McInnis Parkway, San Rafael, CA, United States, 94903
- 3. Page 3 of 9 Any information in this report is not , and should not be regarded as investment advice or as a recommendation regarding any particular security or course of action. We recommend seeking a licensed professional for investment advice. Company Website https://www.autodesk.com Address 111 McInnis Parkway, San Rafael, CA, United States, 94903 Fiscal Year End January Employees 12600 Technical Indicators Value Value Beta 1.44 52 Week High 344.39 Short Ratio 2.73 52 Week Low 175.41 Shorted Shares 4,198,384 200 Day Moving Average 261.41 Shorted Shares Previous Month 4,148,006 50 Day Moving Average 200.46 Shares Held By Insiders 20.60% Short Percentage 1.00% Shares Held by Institutions 91.14 Dividend Yield N/A
- 4. Page 4 of 9 Any information in this report is not , and should not be regarded as investment advice or as a recommendation regarding any particular security or course of action. We recommend seeking a licensed professional for investment advice. ADSK:NSD (Autodesk Inc) Software-Application | | Common Stock Stock Target Advisor Detailed Stock Report Report Date: 18th May, 2022 Market Performance Market Performance vs. Industry / Classification (Software-Application) Market Performance vs. Exchange (Nasdaq Global Select) Value Sector Median Percentile Rank Grade Market Median Percentile Rank Grade YTD Capital Gain -30.42% -39.4% 61% -18.6% 38% Dividend Return N/A 0.4% N/A 0.8% N/A Total Return -30.42% -39.4% 61% -18.2% 38% Trailing 12 Months Capital Gain -28.27% -38.8% 58% -18.6% 43% Dividend Return N/A 1.6% N/A 2.3% N/A Total Return -28.27% -37.6% 58% -16.7% 43% Trailing 5 Years Capital Gain 104.15% 28.8% 69% 7.2% 80% Dividend Return N/A 10.6% N/A 11.2% N/A Total Return 104.15% 32.4% 69% 18.1% 80% Average Annual (5 Year Horizon) Capital Gain 25.86% 16.9% 59% 3.1% 79% Dividend Return N/A 1.0% N/A 1.8% N/A Total Return 25.86% 18.2% 59% 5.1% 79% Risk Return Profile Volatility (Standard Deviation) 26.12% 42.1% 77% 32.3% 60% Risk Adjusted Return 98.98% N/A 92% 21.8% 96% Market Capitalization 41.89B 0.54B 98% 0.33B 98%
- 5. Page 5 of 9 Any information in this report is not , and should not be regarded as investment advice or as a recommendation regarding any particular security or course of action. We recommend seeking a licensed professional for investment advice. Key Financial Ratios Ratios vs. Industry / Classification (Computer Hardware) Ratios vs. Exchange (Nasdaq Global Select) Value Sector Median Percentile Rank Grade Market Median Percentile Rank Grade Market Value peratio 86.0 37.1 25% 16.0 11% pbratio 46.3 2.9 5% 1.6 2% pcfratio 27.4 13.4 36% 0.0 11% pfcfratio 52.2 18.5 24% 9.9 12% Management Effectiveness retequity 54.78% -9.5% 94% 0.8% 96% retinvcap 18.09% -4.3% 89% -0.4% 86% retass 5.84% -2.9% 85% 0.4% 82% debtequityratio 268.27% 44.6% 8% 32.3% 8% Technical Ratios yield N/A 1.5% N/A 3.7% N/A sratio 2.73 3.34 60% 3.09 55% spercent 1.93% 3.2% 65% 2.9% 60% beta 1.44 1.15 30% 1.08 28%
- 6. Page 6 of 9 Any information in this report is not , and should not be regarded as investment advice or as a recommendation regarding any particular security or course of action. We recommend seeking a licensed professional for investment advice. ADSK:NSD (Autodesk Inc) Software-Application | | Common Stock Stock Target Advisor Detailed Stock Report Report Date: 18th May, 2022 Recent Analyst Ratings Price Action Rating Action Analyst Rating Price date Target Down Barclays Overweight USD 230 2022-05-17 Target Down Credit Suisse NA USD 335 2022-05-17 Assigns STA Research Buy USD 220 2022-05-17 Target Lowered by Argus USD 360 » USD 290 2022-02-28 Target Lowered by Stifel Europe Buy » Buy USD 310 » USD 285 2022-02-28 Target Lowered by JP Morgan & Company Overweight USD 355 » USD 275 2022-02-25 Maintains Piper Sandler Overweight USD 340 » USD 298 2022-02-25 Maintains Rosenblatt Securities Buy USD 340 » USD 300 2022-02-25 Maintains Deutsche Bank Capital Buy USD 330 » USD 275 2022-02-25 Target Lowered by Stifel Nicolaus Research Buy USD 310 » USD 285 2022-02-25 Maintains KeyBanc Overweight USD 300 » USD 260 2022-02-25 Target Lowered by Barclays USD 289 » USD 275 2022-02-25 Maintains Morgan Stanley Equal-Weight USD 277 » USD 258 2022-02-25 Maintains Citigroup Buy USD 305 » USD 286 2022-02-25 Target Lowered by Goldman Sachs Sell USD 250 » USD 220 2022-02-25 Target Lowered by Griffin Securities Buy USD 340 » USD 300 2022-02-25 Target Lowered by RBC Royalbank Outperform USD 343 » USD 300 2022-02-22 Initiated by Citigroup Buy » Buy USD 305 2022-02-17 Target Lowered by Barclays Overweight USD 346 » USD 289 2022-02-15 Target Lowered by Mizuho Securities Buy USD 330 » USD 285 2022-02-15 Maintains KeyBanc Overweight USD 350 » USD 300 2022-02-14 Downgraded by OTR Global Positive 2022-02-10 Target Lowered by Deutsche Bank Capital Buy USD 370 » USD 330 2021-11-29 Maintains Credit Suisse Outperform USD 450 » USD 440 2021-11-24 Maintains RBC Royalbank Outperform USD 363 » USD 343 2021-11-24
- 7. Page 7 of 9 Any information in this report is not , and should not be regarded as investment advice or as a recommendation regarding any particular security or course of action. We recommend seeking a licensed professional for investment advice. ADSK:NSD (Autodesk Inc) Software-Application | | Common Stock Stock Target Advisor Detailed Stock Report Report Date: 18th May, 2022 Annual Financial (USD)
- 8. Page 8 of 9 Any information in this report is not , and should not be regarded as investment advice or as a recommendation regarding any particular security or course of action. We recommend seeking a licensed professional for investment advice. ADSK:NSD (Autodesk Inc) Software-Application | | Common Stock Stock Target Advisor Detailed Stock Report Report Date: 18th May, 2022 Quarterly Financial (USD)
- 9. Page 9 of 9 Any information in this report is not , and should not be regarded as investment advice or as a recommendation regarding any particular security or course of action. We recommend seeking a licensed professional for investment advice. ADSK:NSD (Autodesk Inc) Software-Application | | Common Stock Stock Target Advisor Detailed Stock Report Report Date: 18th May, 2022 Largest Industry Peers for Software-Application Symbol Company Name Price(Change) Market Cap INTU Intuit Inc +12.28 (+3.4%) USD 105.14B WDAY Workday Inc -2.72 (-1.5%) USD 46.24B TEAM Atlassian Corporation Plc -2.57 (-1.5%) USD 42.65B CDNS Cadence Design Systems Inc +3.49 (+2.5%) USD 39.28B DDOG Datadog Inc -2.14 (-2.2%) USD 34.29B ZM Zoom Video Communications Inc +2.02 (+2.3%) USD 28.37B TTD The Trade Desk Inc +2.40 (+4.7%) USD 23.01B ANSS ANSYS Inc +5.09 (+2.1%) USD 22.00B NUAN Nuance Communications Inc N/A USD 17.88B COIN Coinbase Global Inc +8.30 (+13.5%) USD 17.78B ETFs Containing ADSK Symbol Company Name Weight Mer Price(Change) Market Cap IGV 0.00 % 0.46 % N/A N/A HERS:CA Evolve North American Gender D.. 0.00 % 0.62 % N/A USD 3.37M AIEQ AI Powered Equity ETF 0.00 % 0.75 % +0.98 (+0.0%) USD 0.13B AUGR Defiance NextGen Video Gaming .. 0.00 % 0.52 % N/A USD 3.36M QGRO American Century U.S. Quality .. 0.00 % 0.00 % +1.44 (+0.0%) USD 0.22B AMOM QRAFT AI-Enhanced U.S. Large C.. 0.00 % 0.00 % +0.14 (+0.0%) USD 0.02B HERS-B:CA Evolve North American Gender D.. 0.00 % 0.00 % N/A N/A CLDL Direxion Daily Cloud Computing.. 0.00 % 0.00 % +0.17 (+0.0%) N/A META Roundhill Ball Metaverse ETF 0.00 % 0.00 % N/A N/A The Stock Target Advisor platform run millions of calculations every day on over 30,000 Canadian and American stocks, comparing and ranking their financial and market performance against their sectors and exchange. We represent the percentile ranking using the following grading system. Letter Grade Percentage Letter Grade Percentage Letter Grade Percentage A+ 97%-100% A 93%-96% A- 90%-92% B+ 97%-89% B 83%-86% B- 80%-82% C+ 77%-79% C 73%-76% C- 70%-72% D+ 67%-69% D 63%-66% D- 60%-62% F 0%-59%