Downloaded 2,906 times


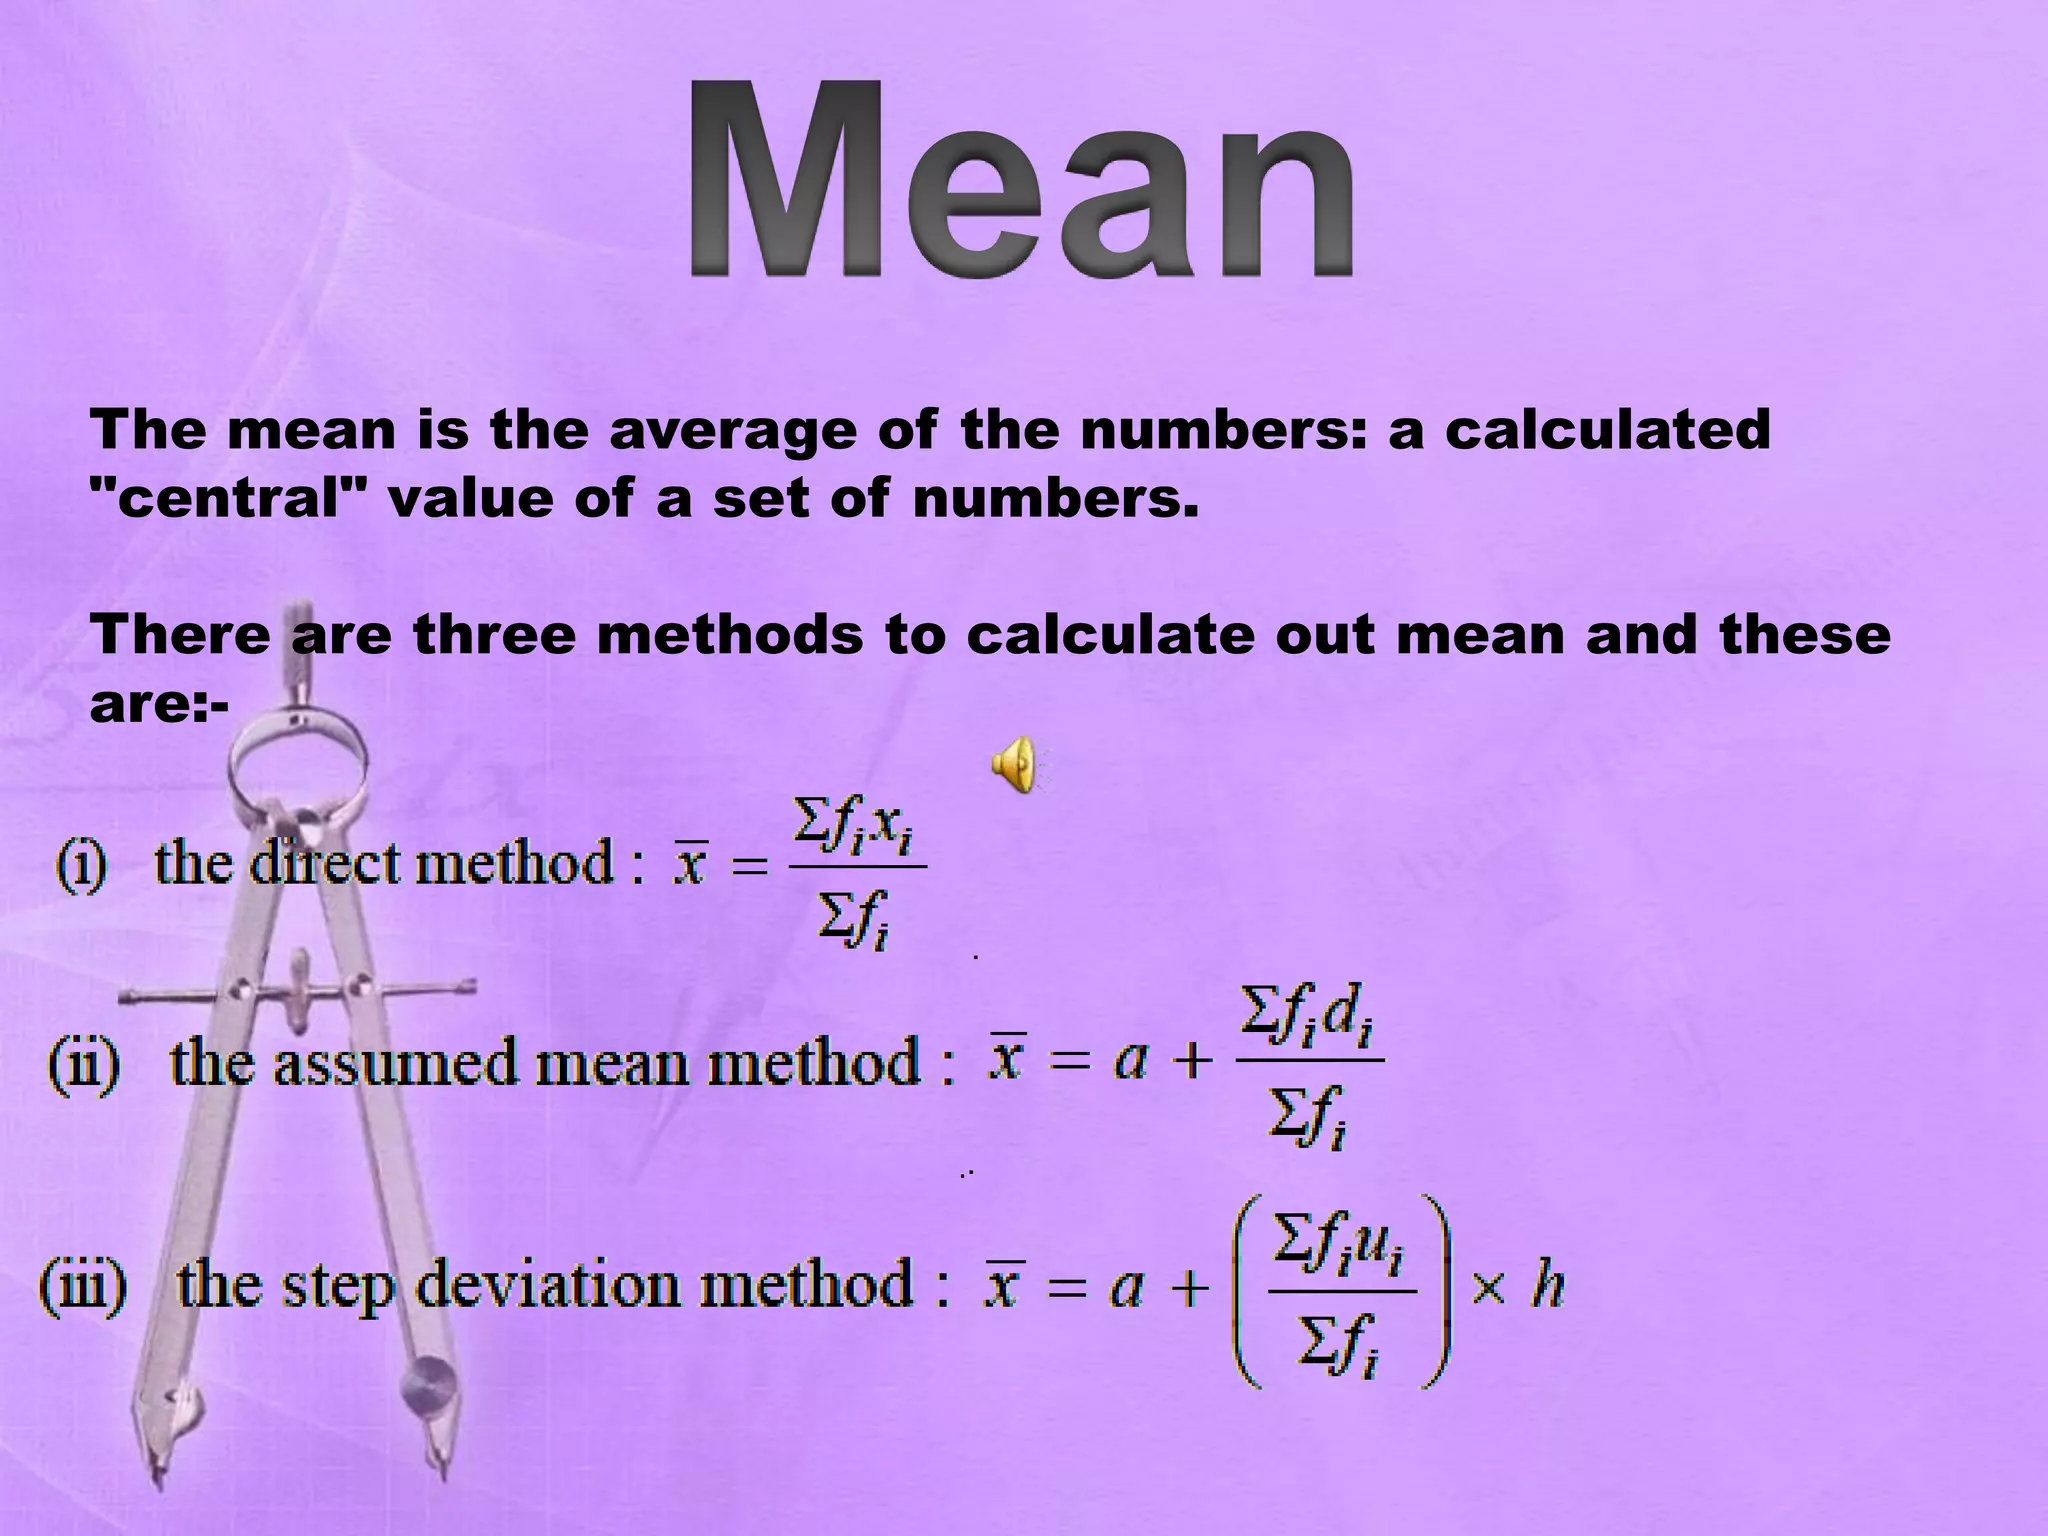
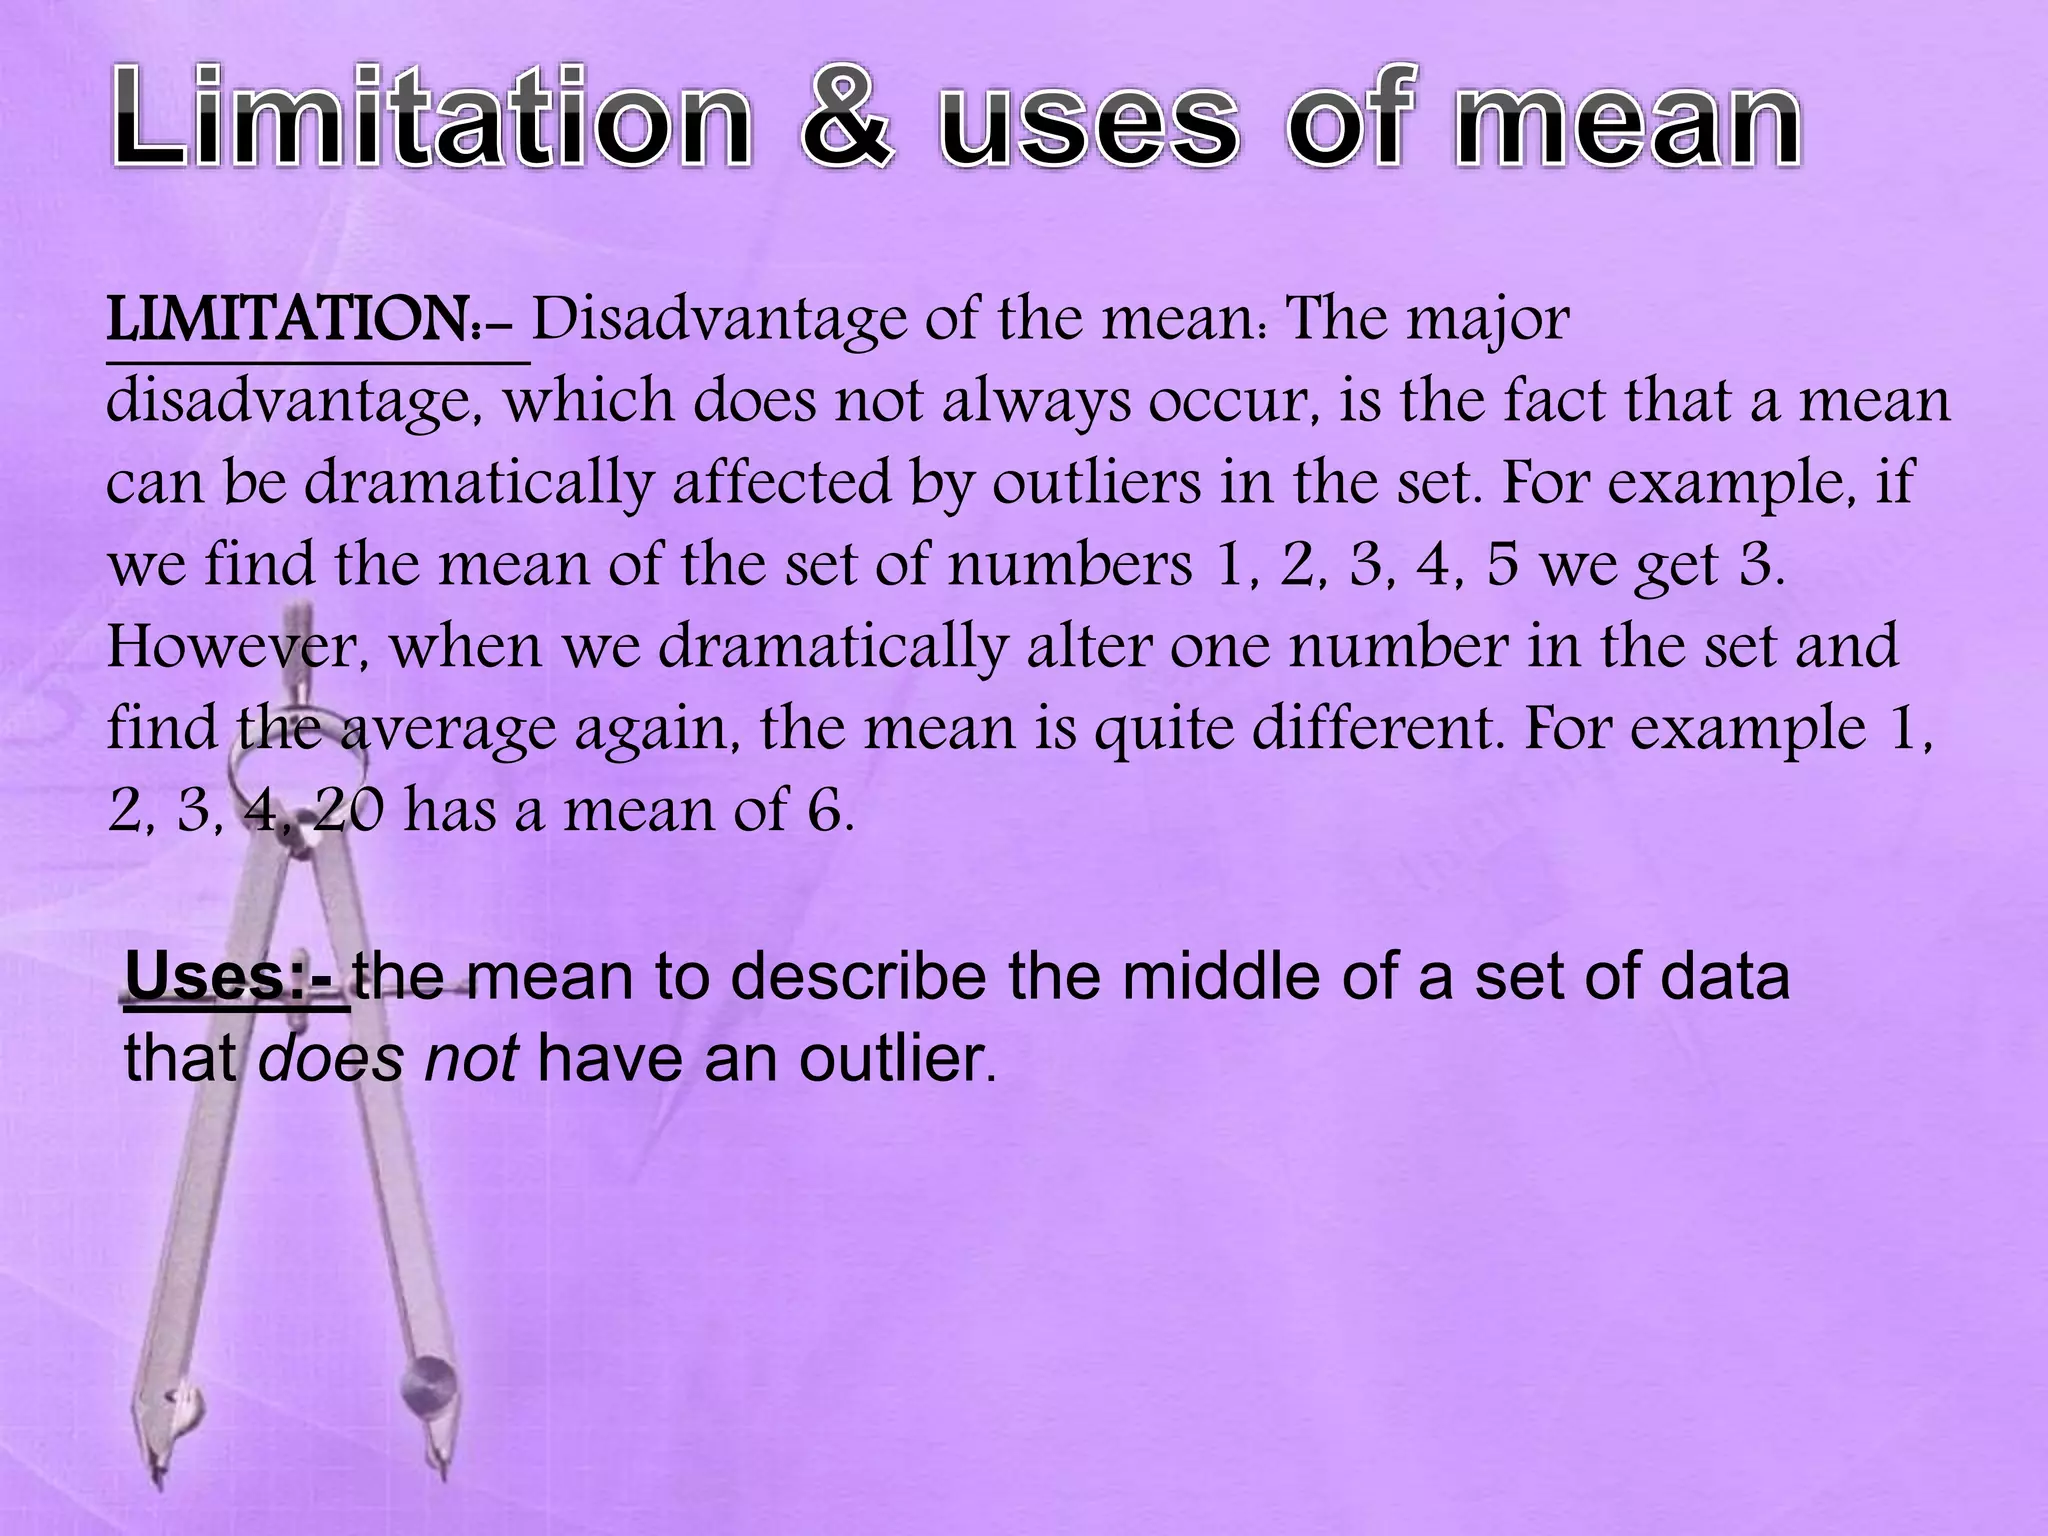
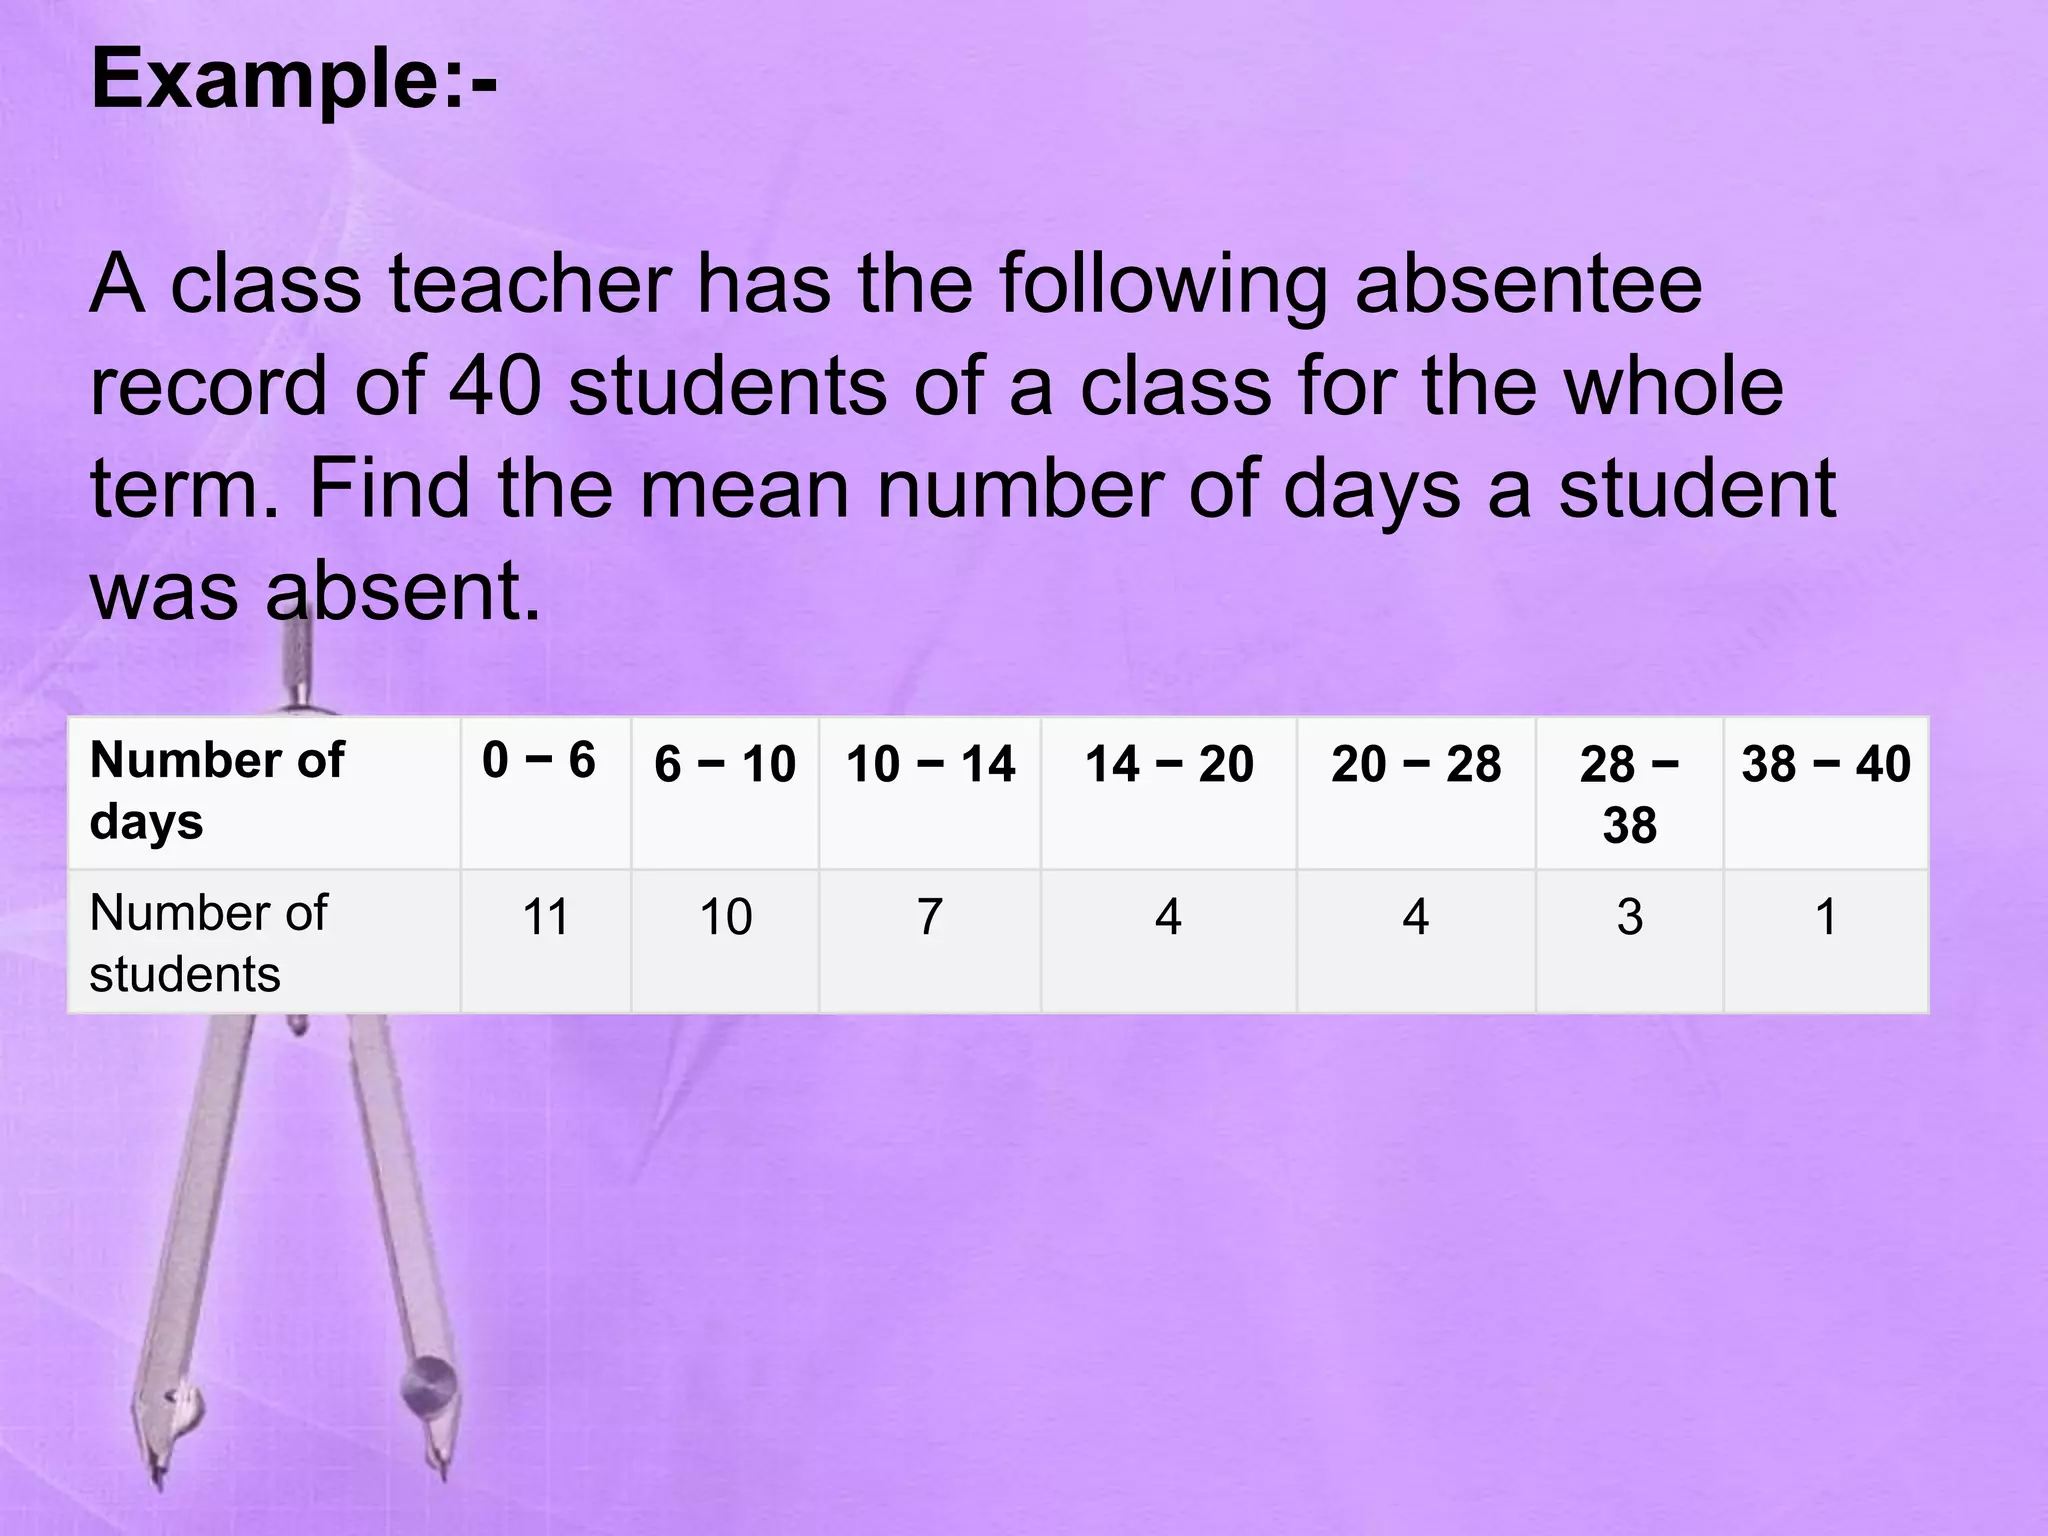
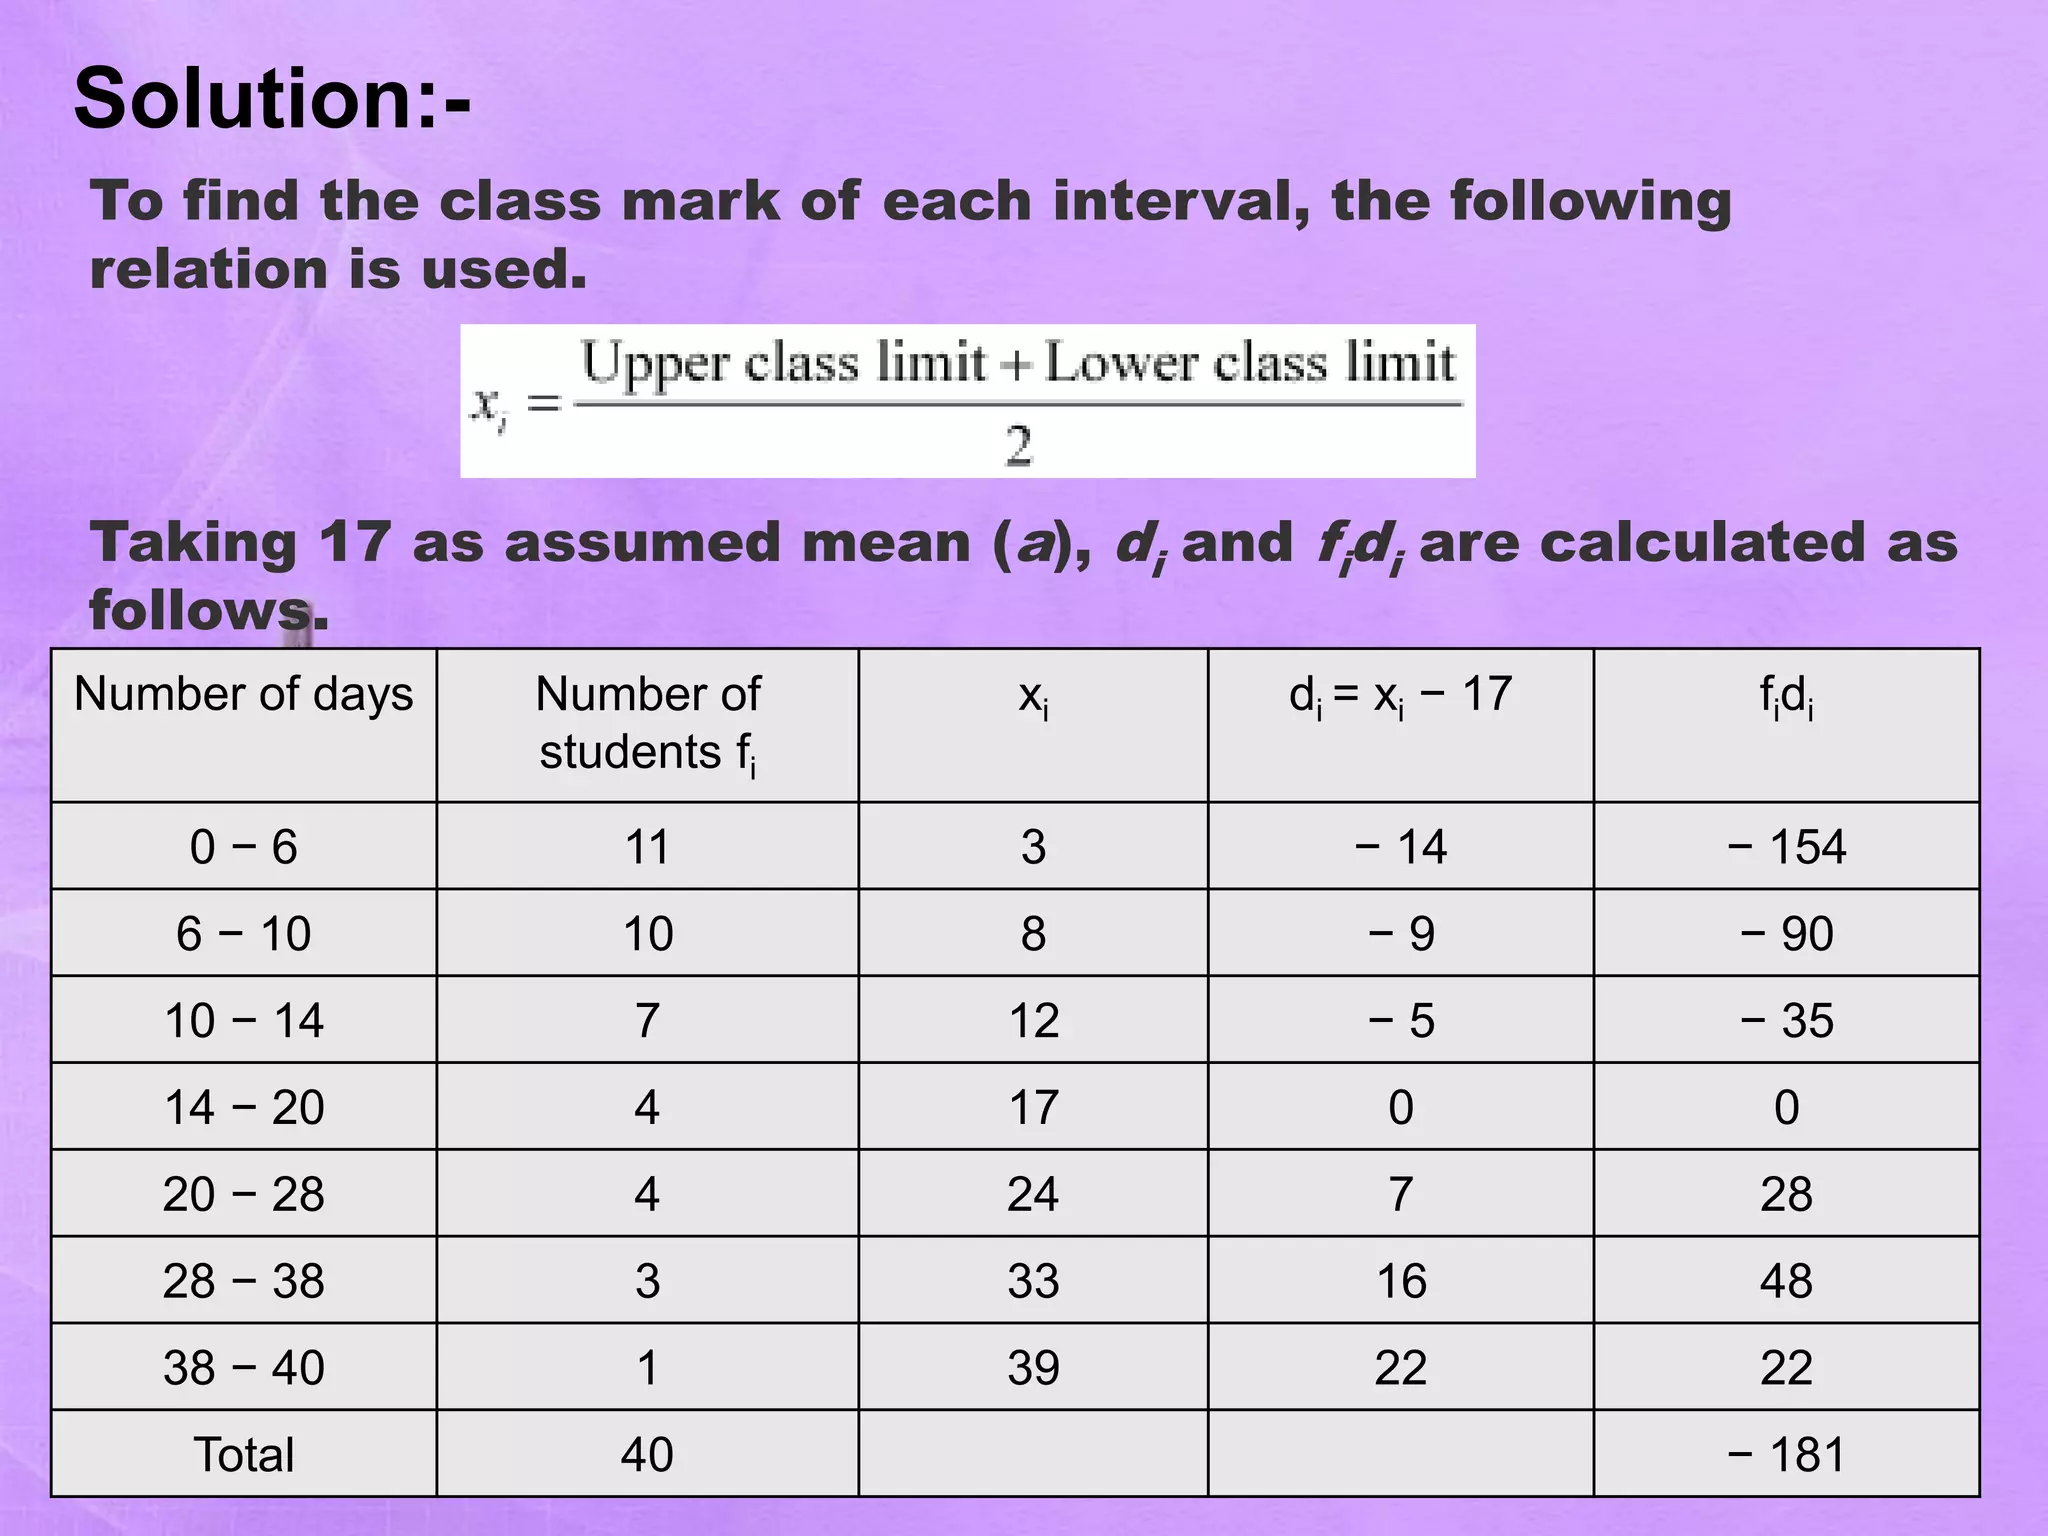
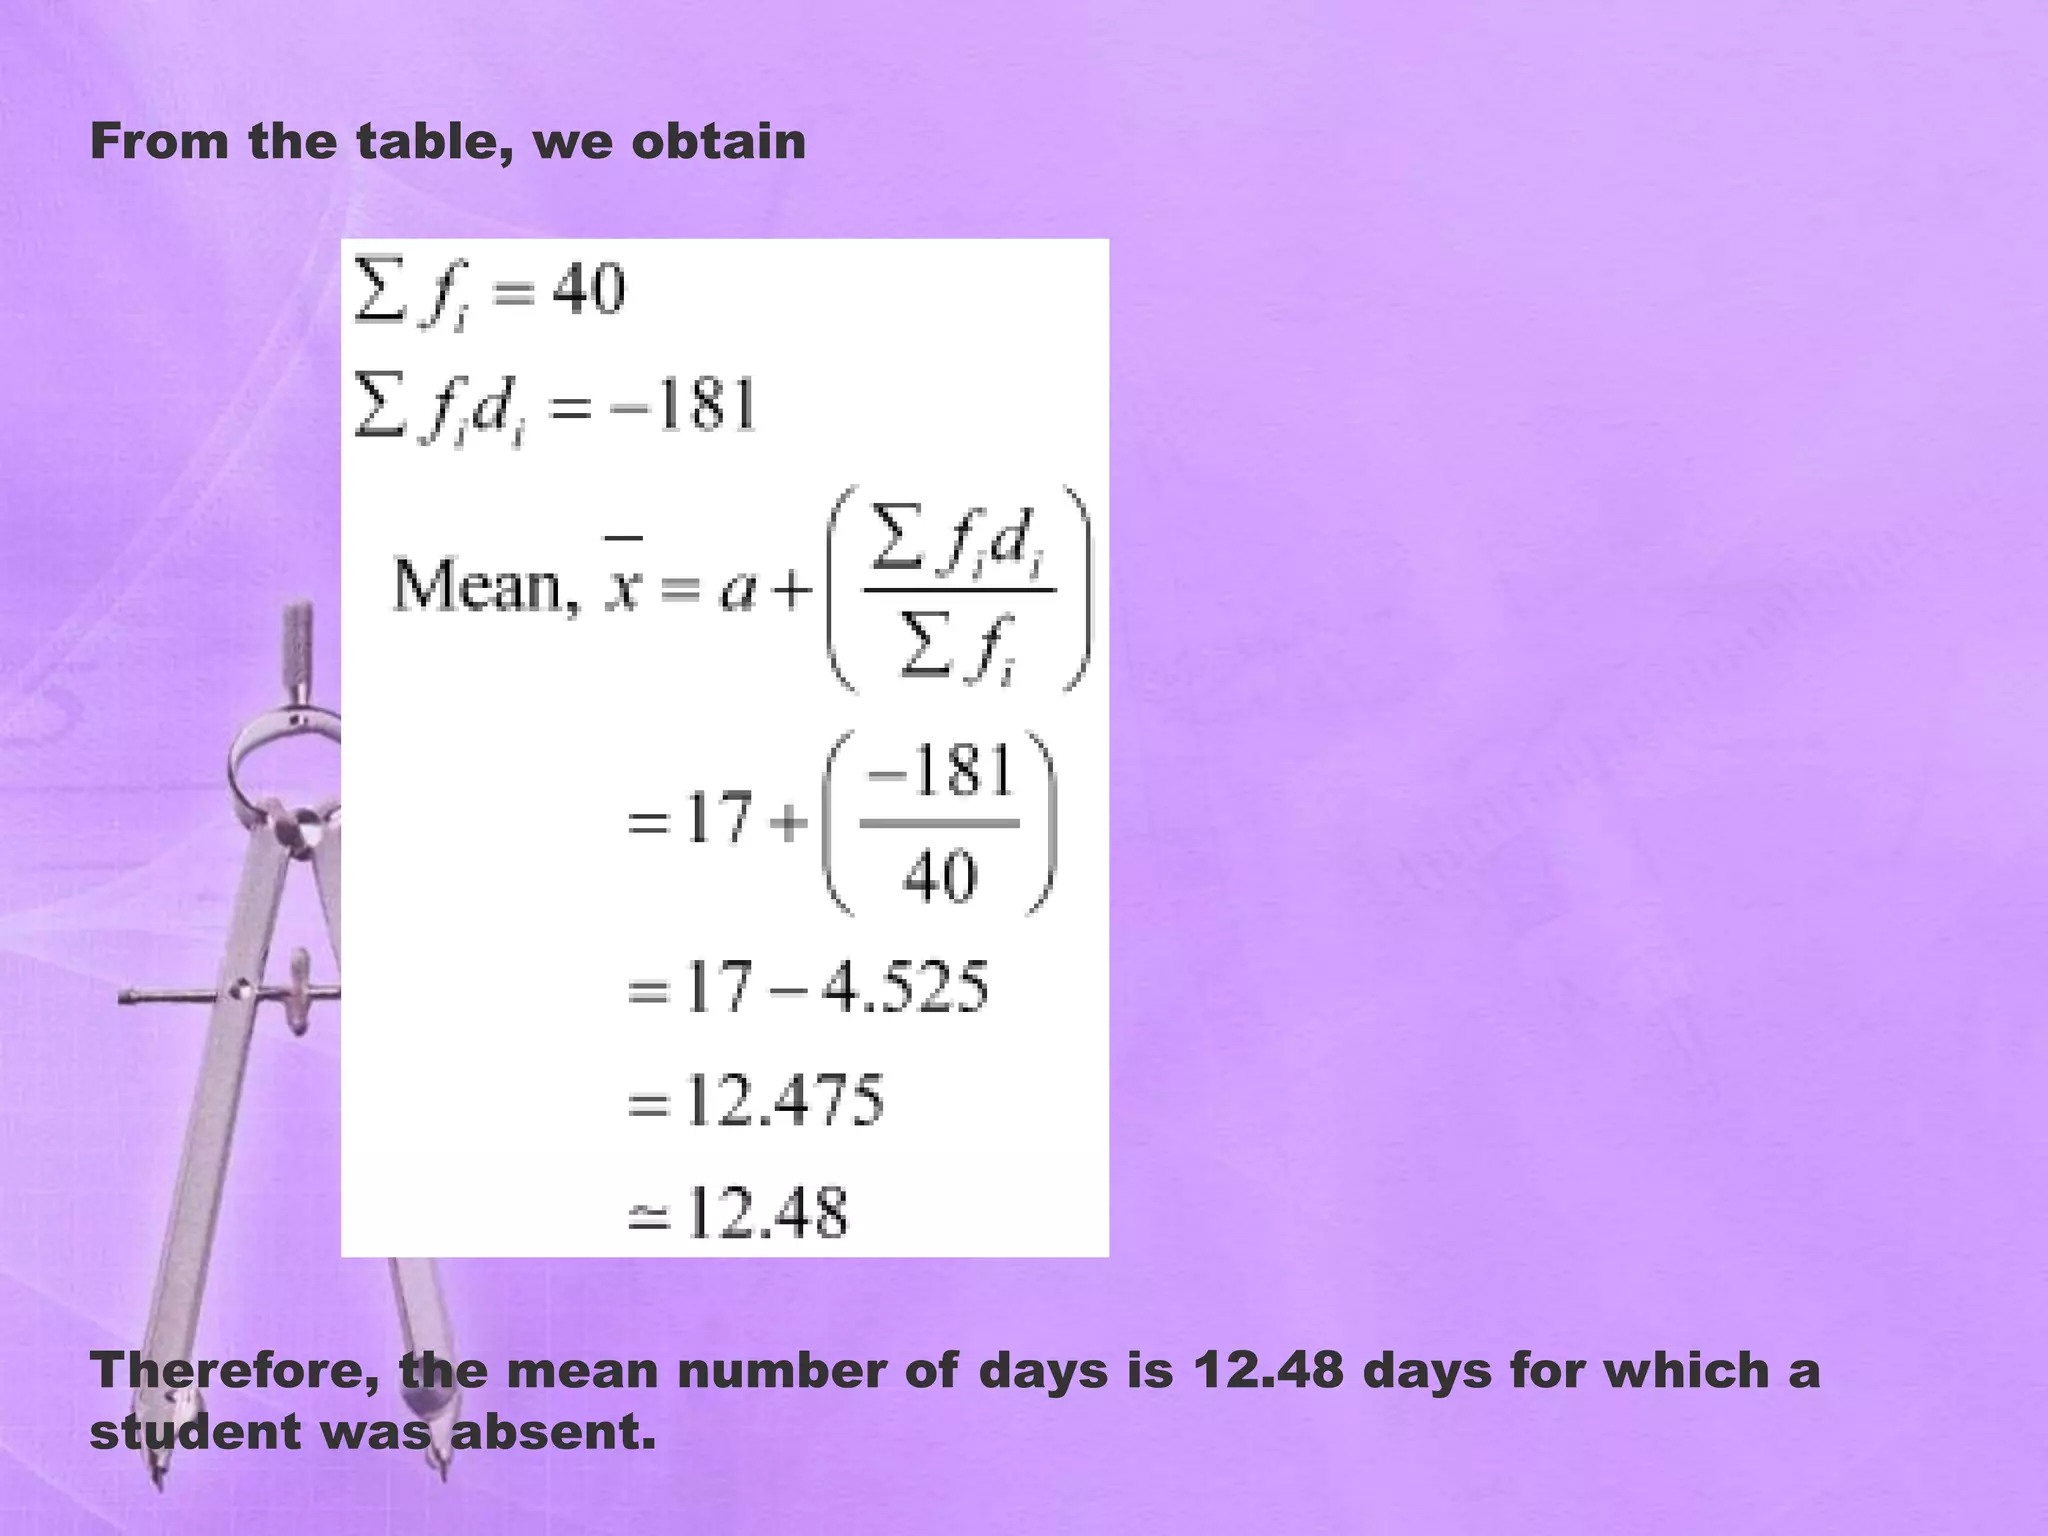
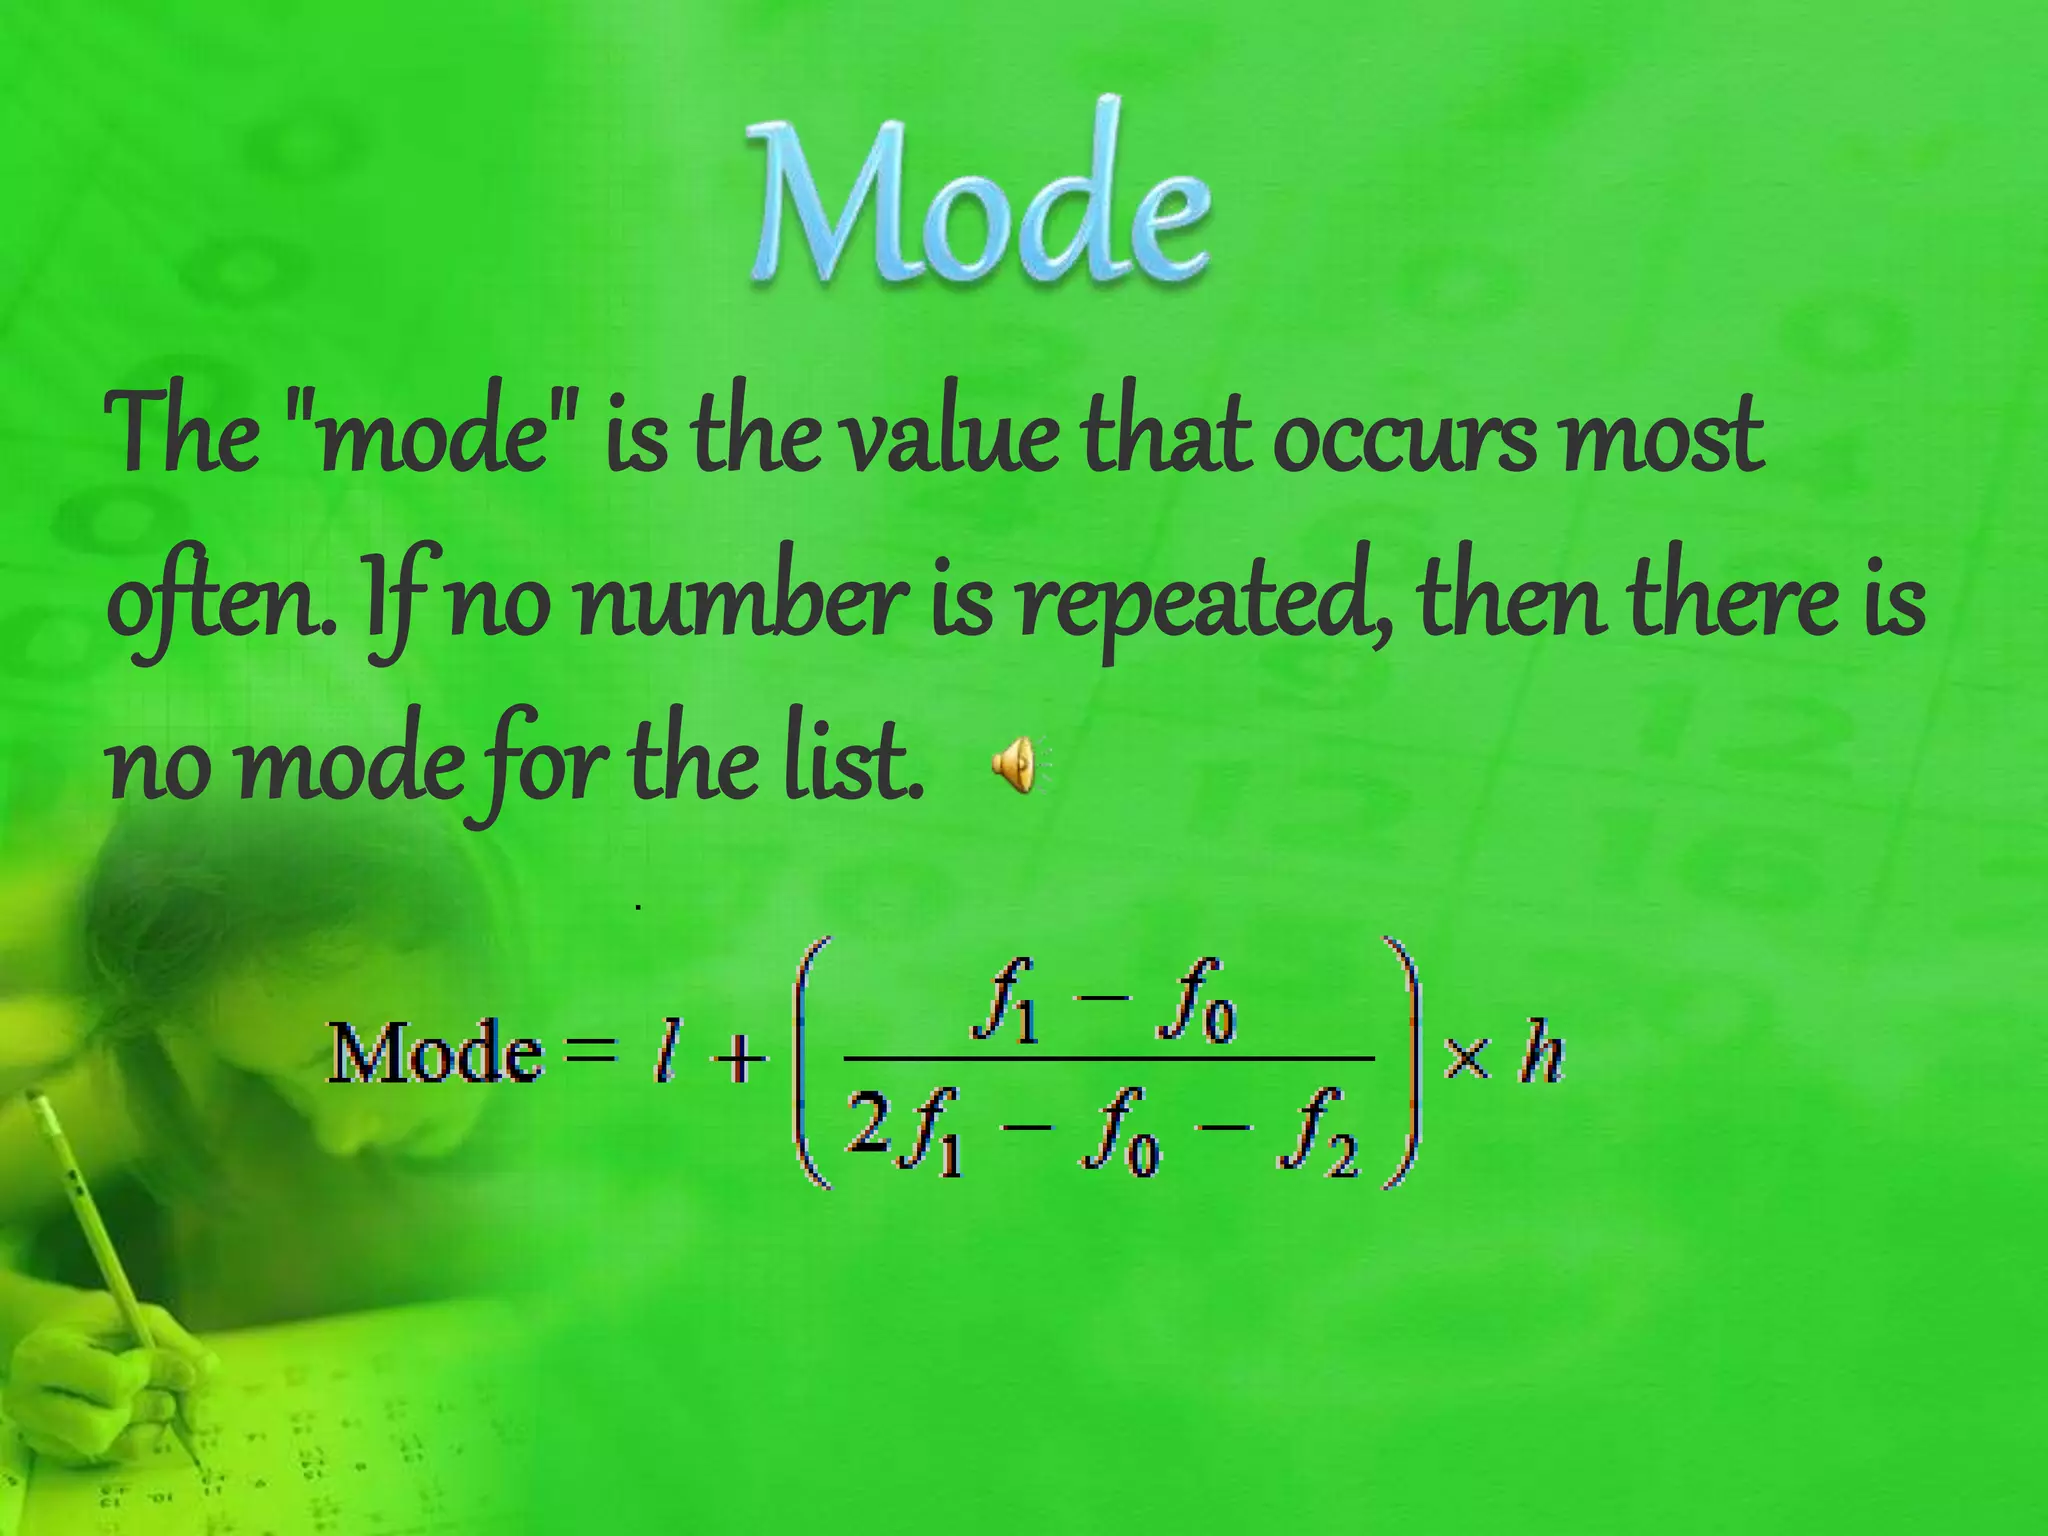
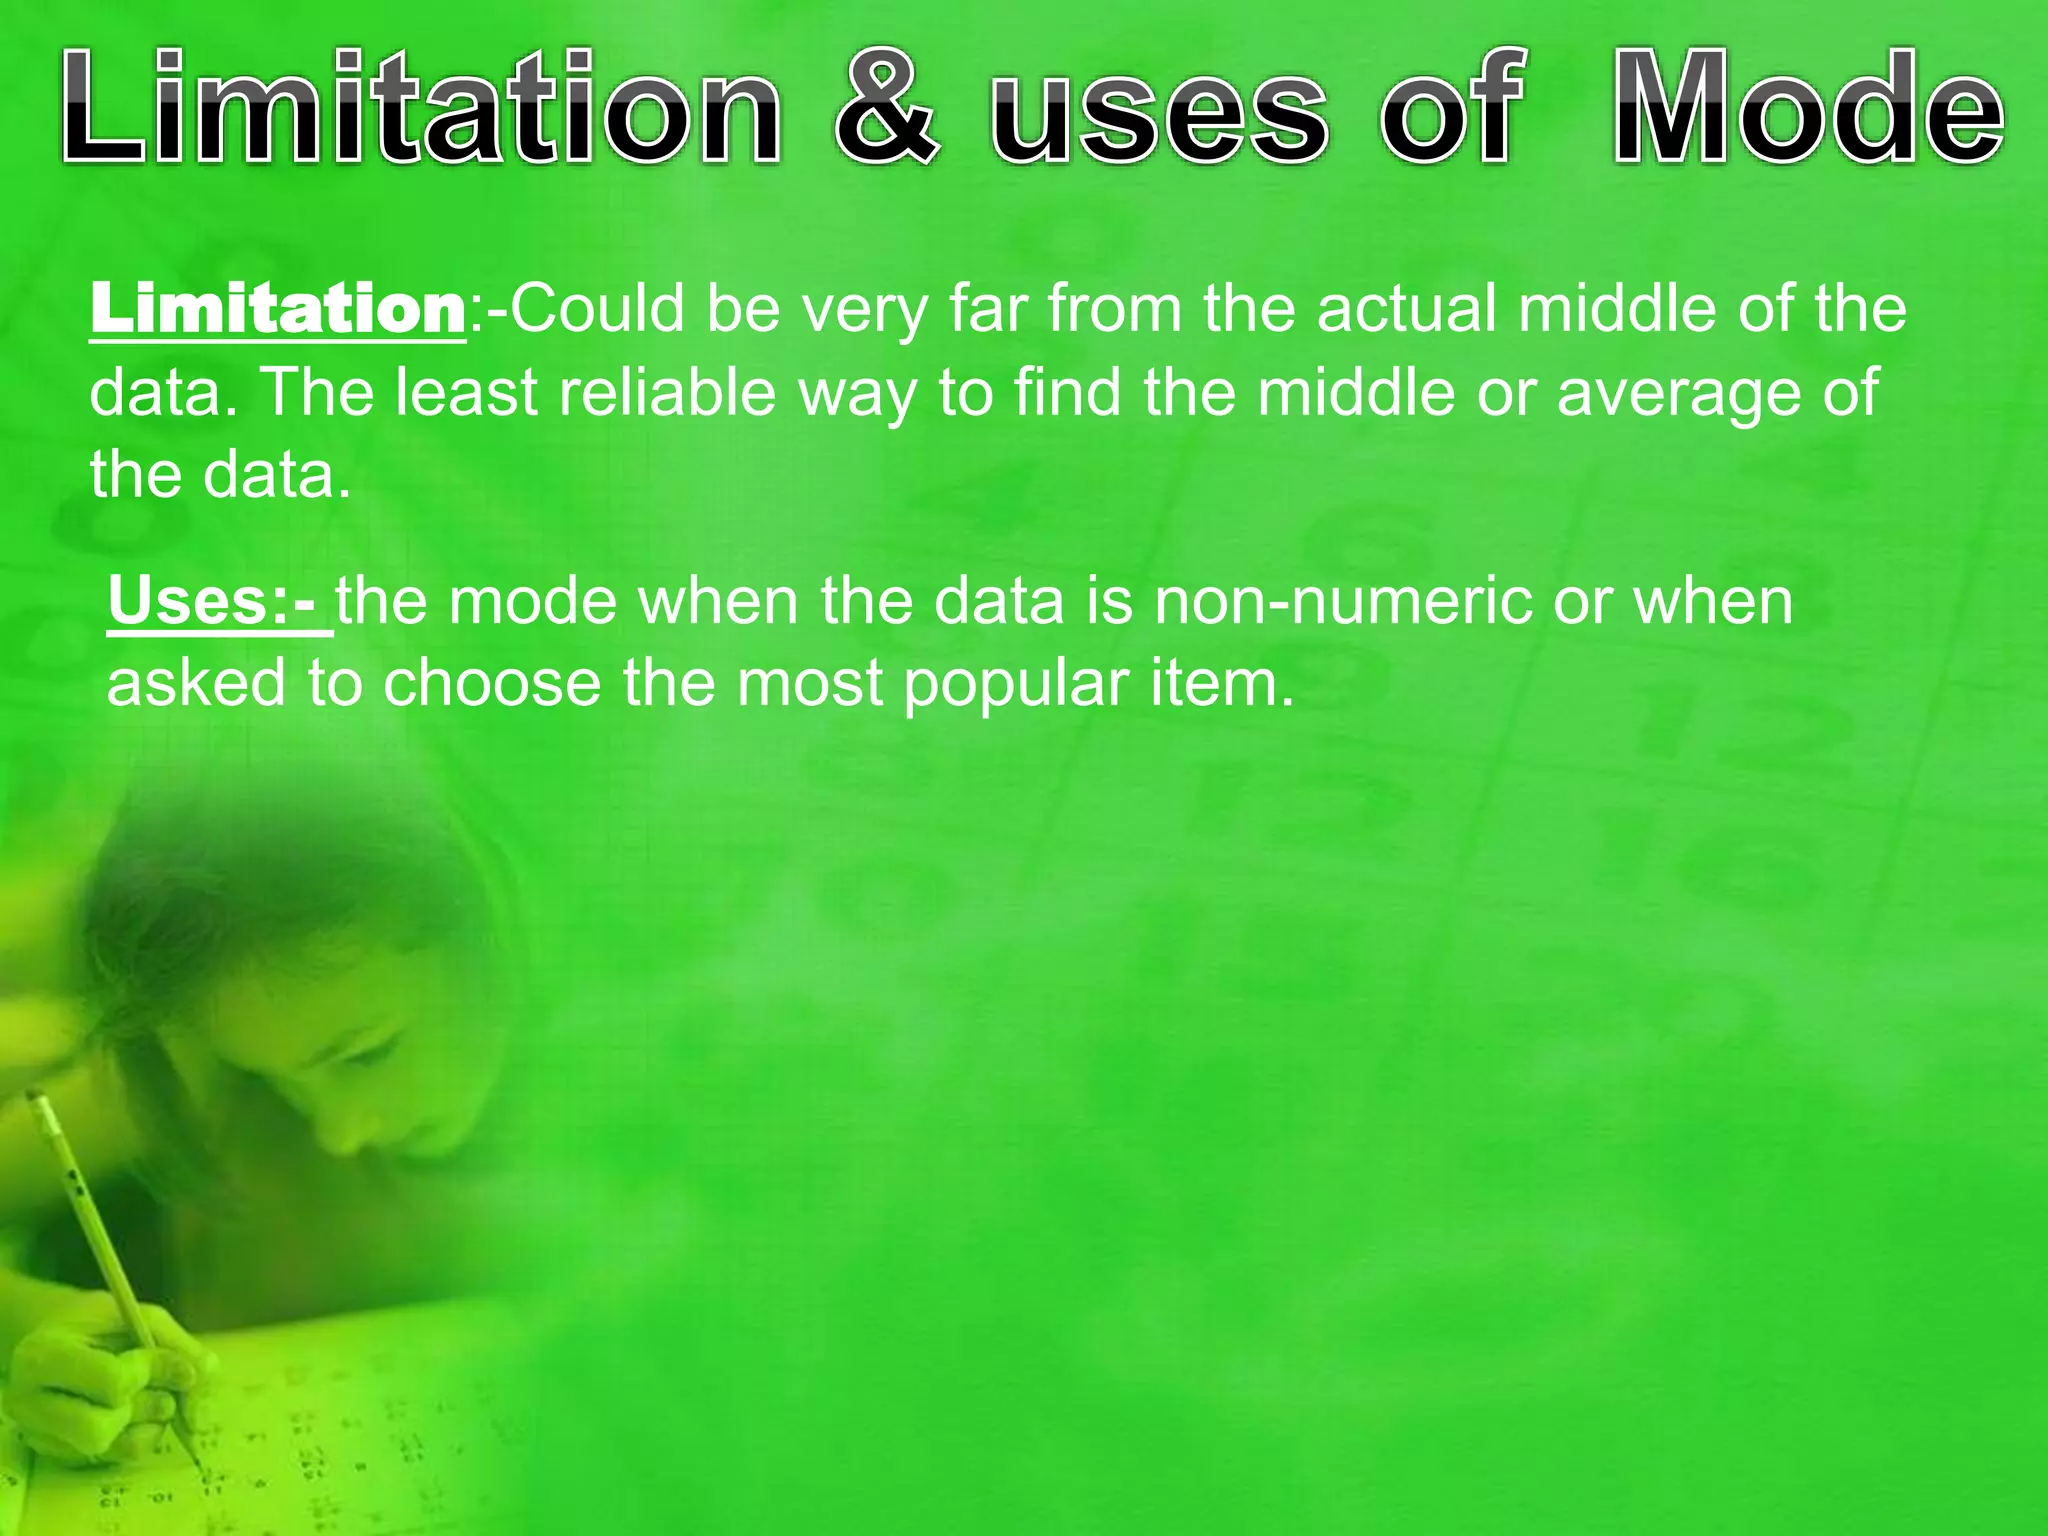
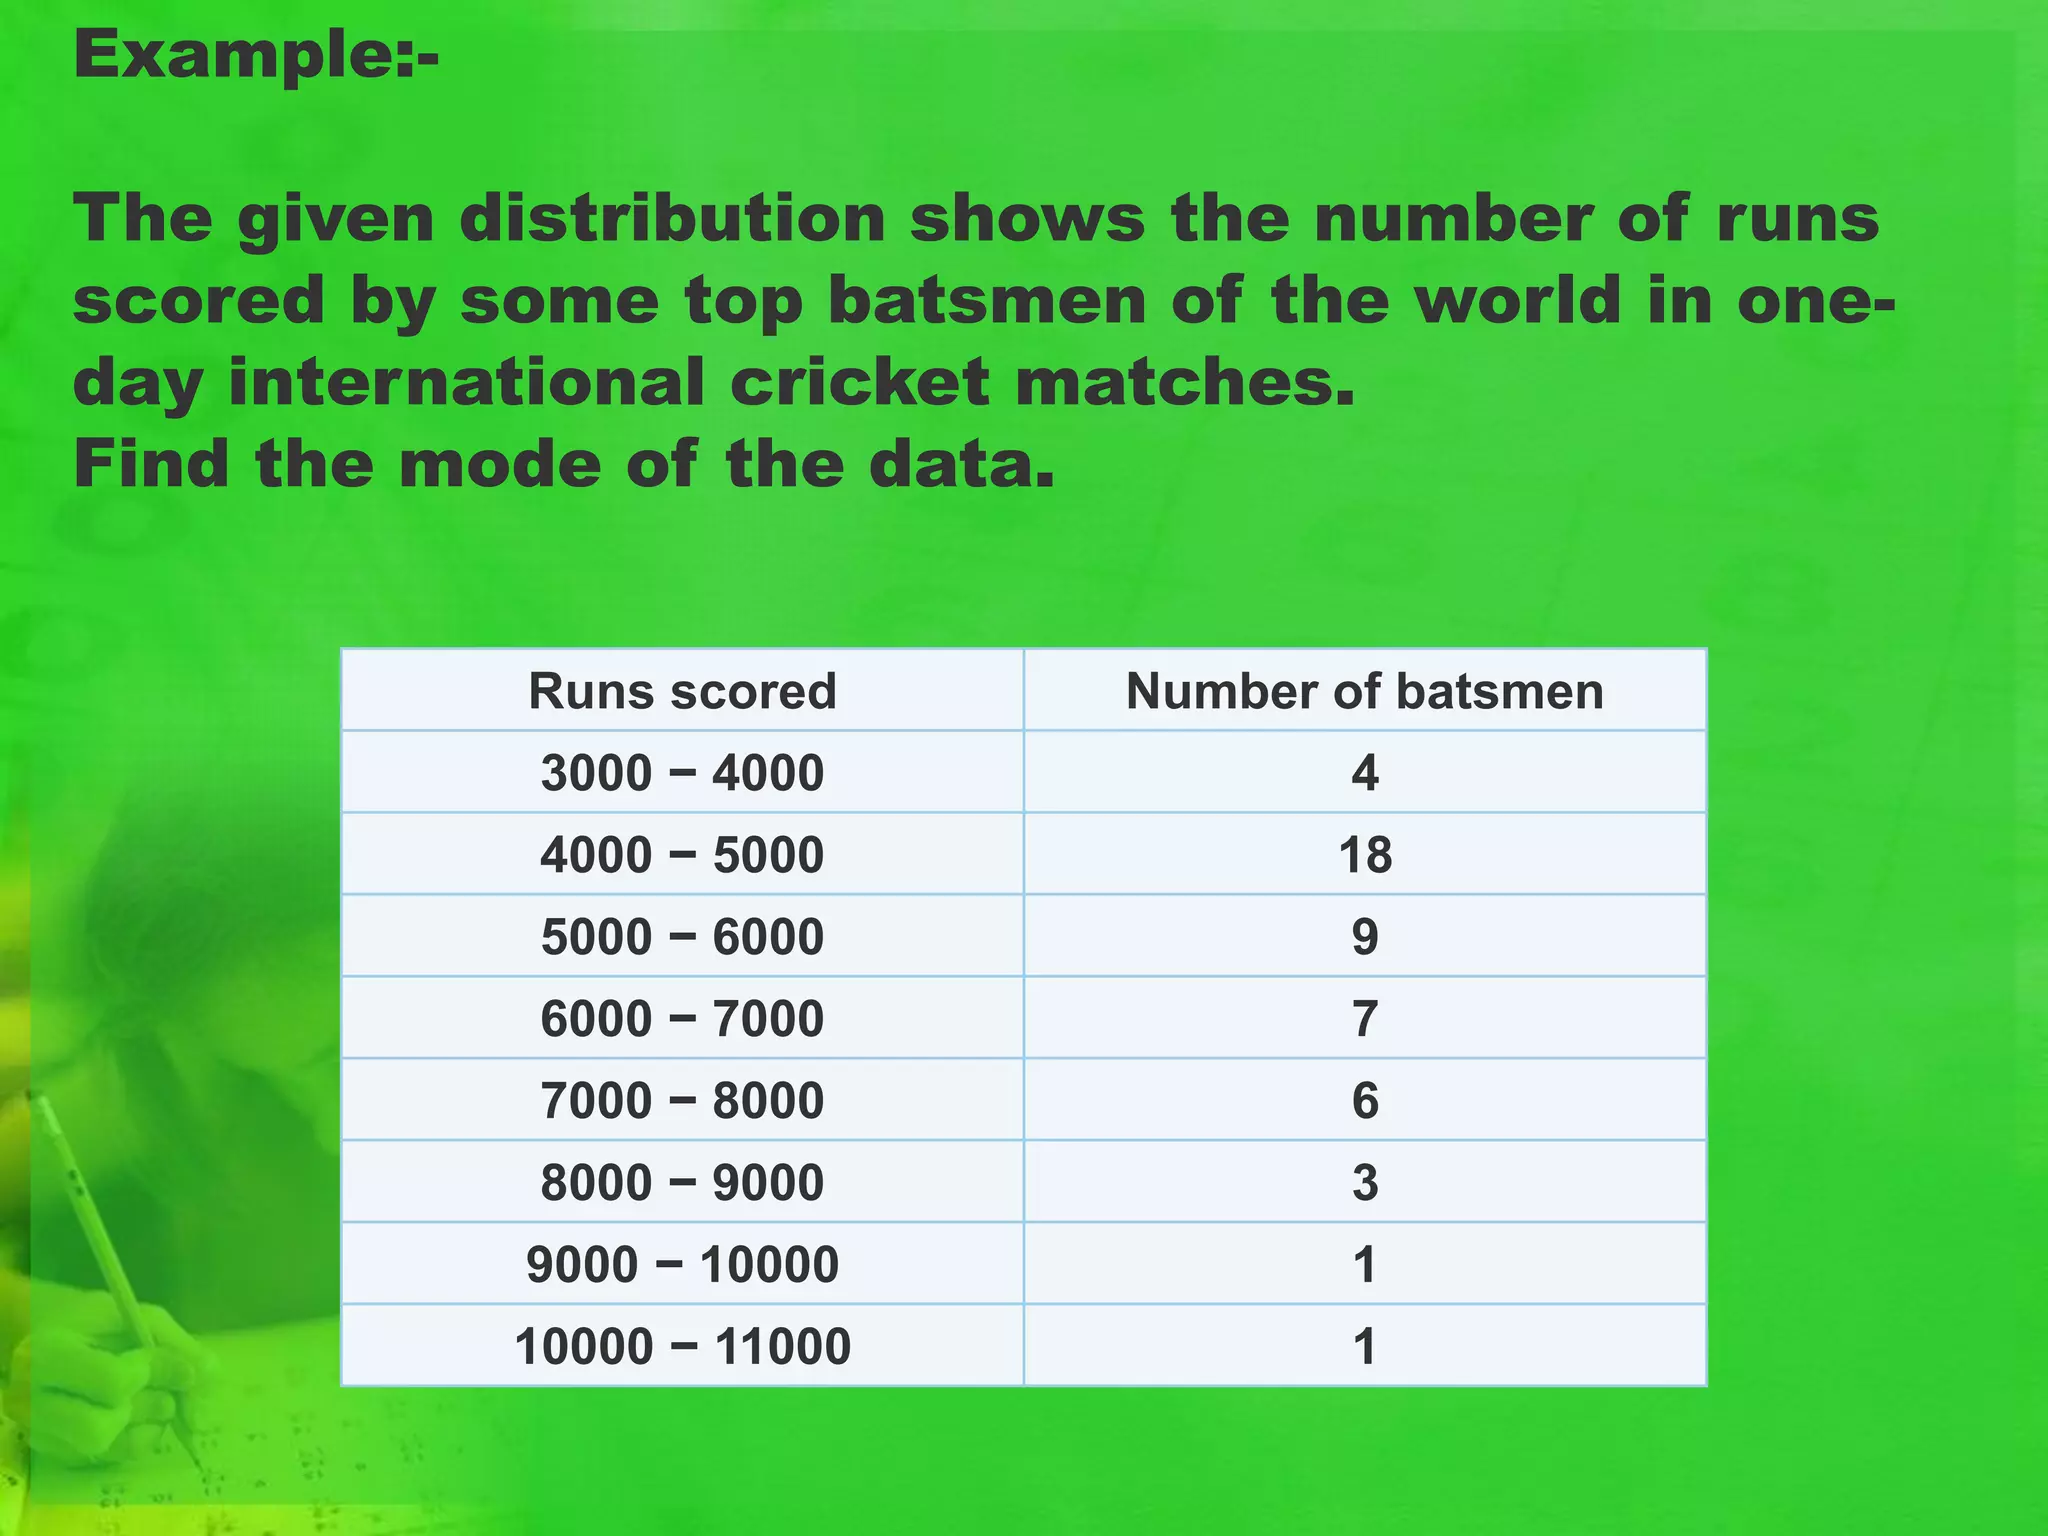
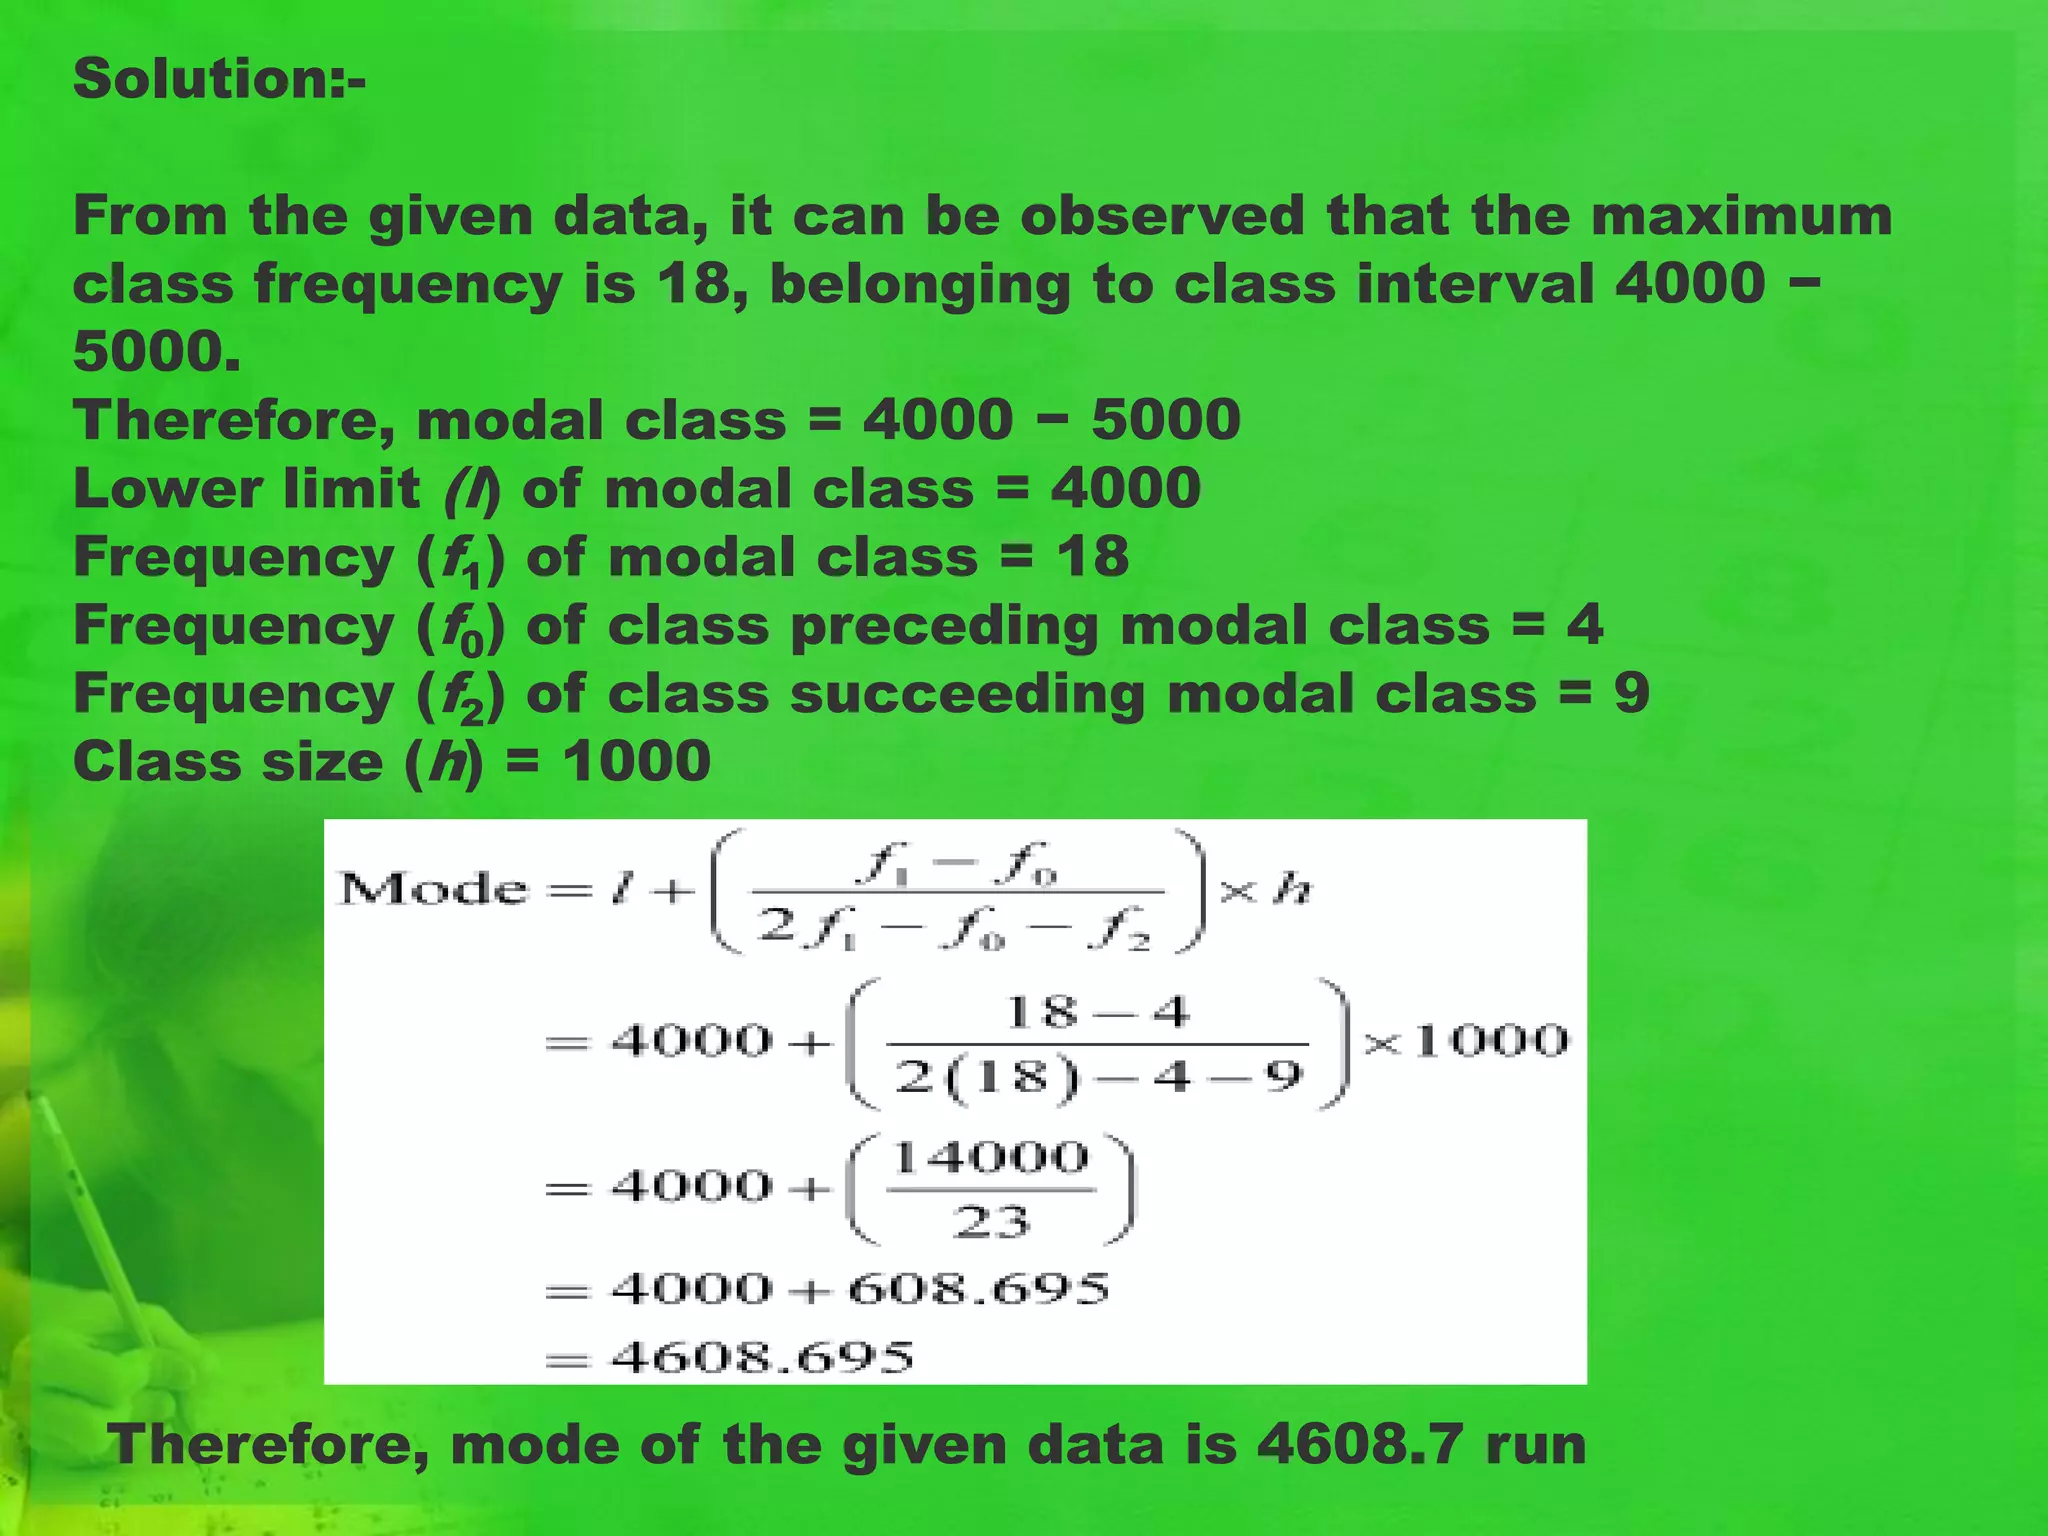
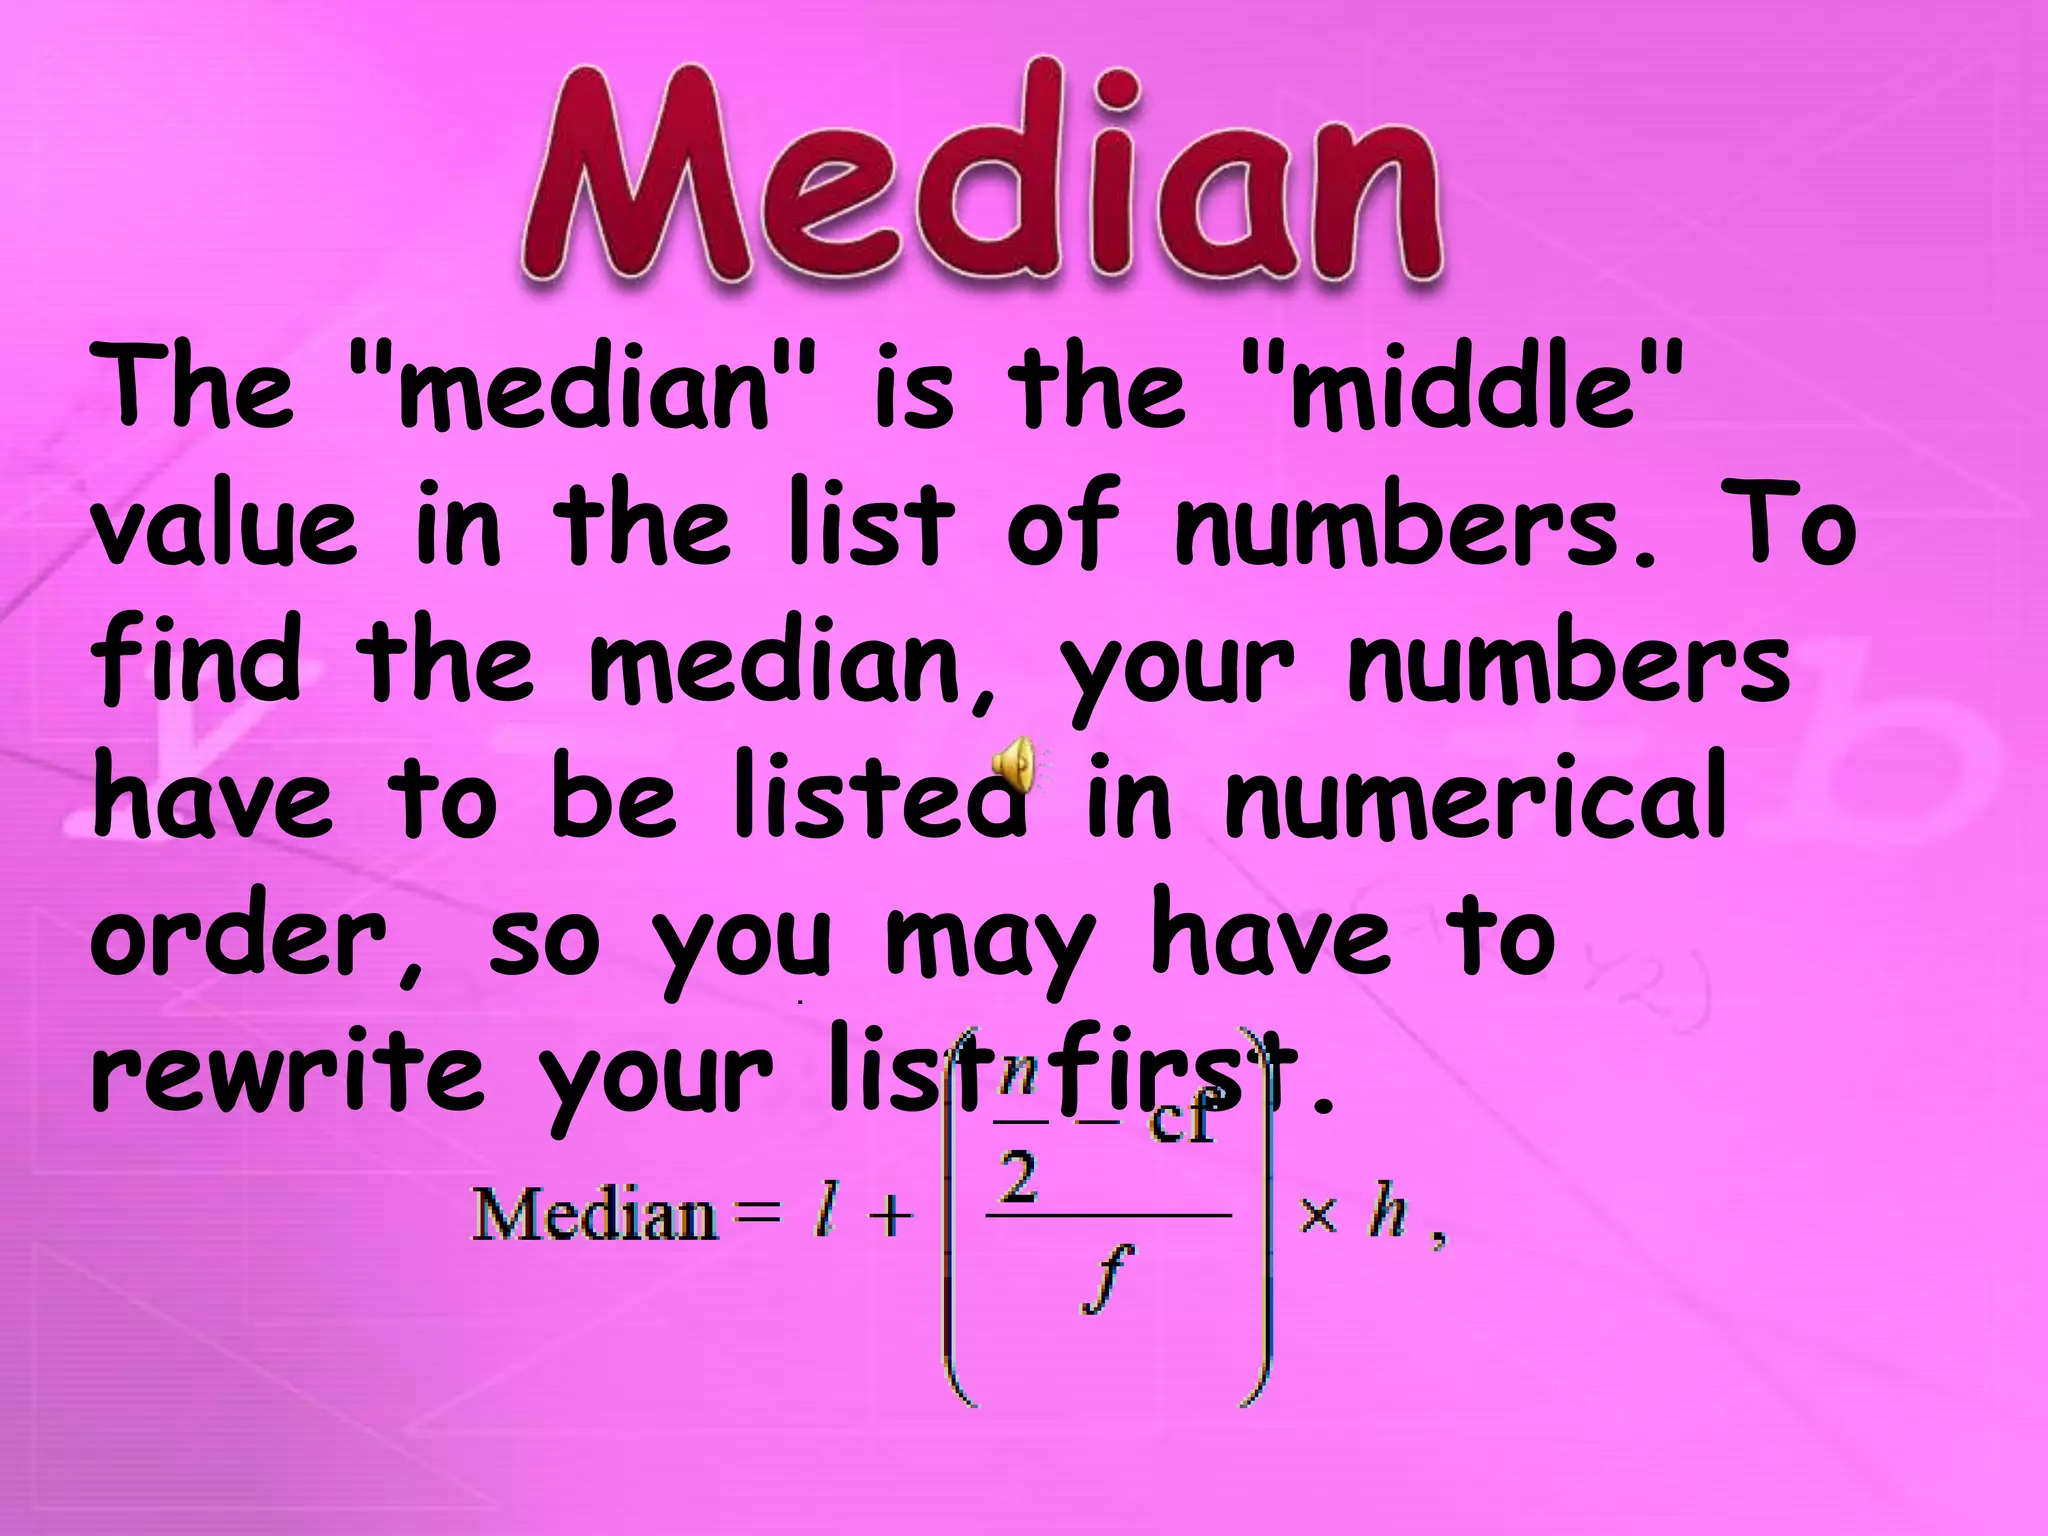
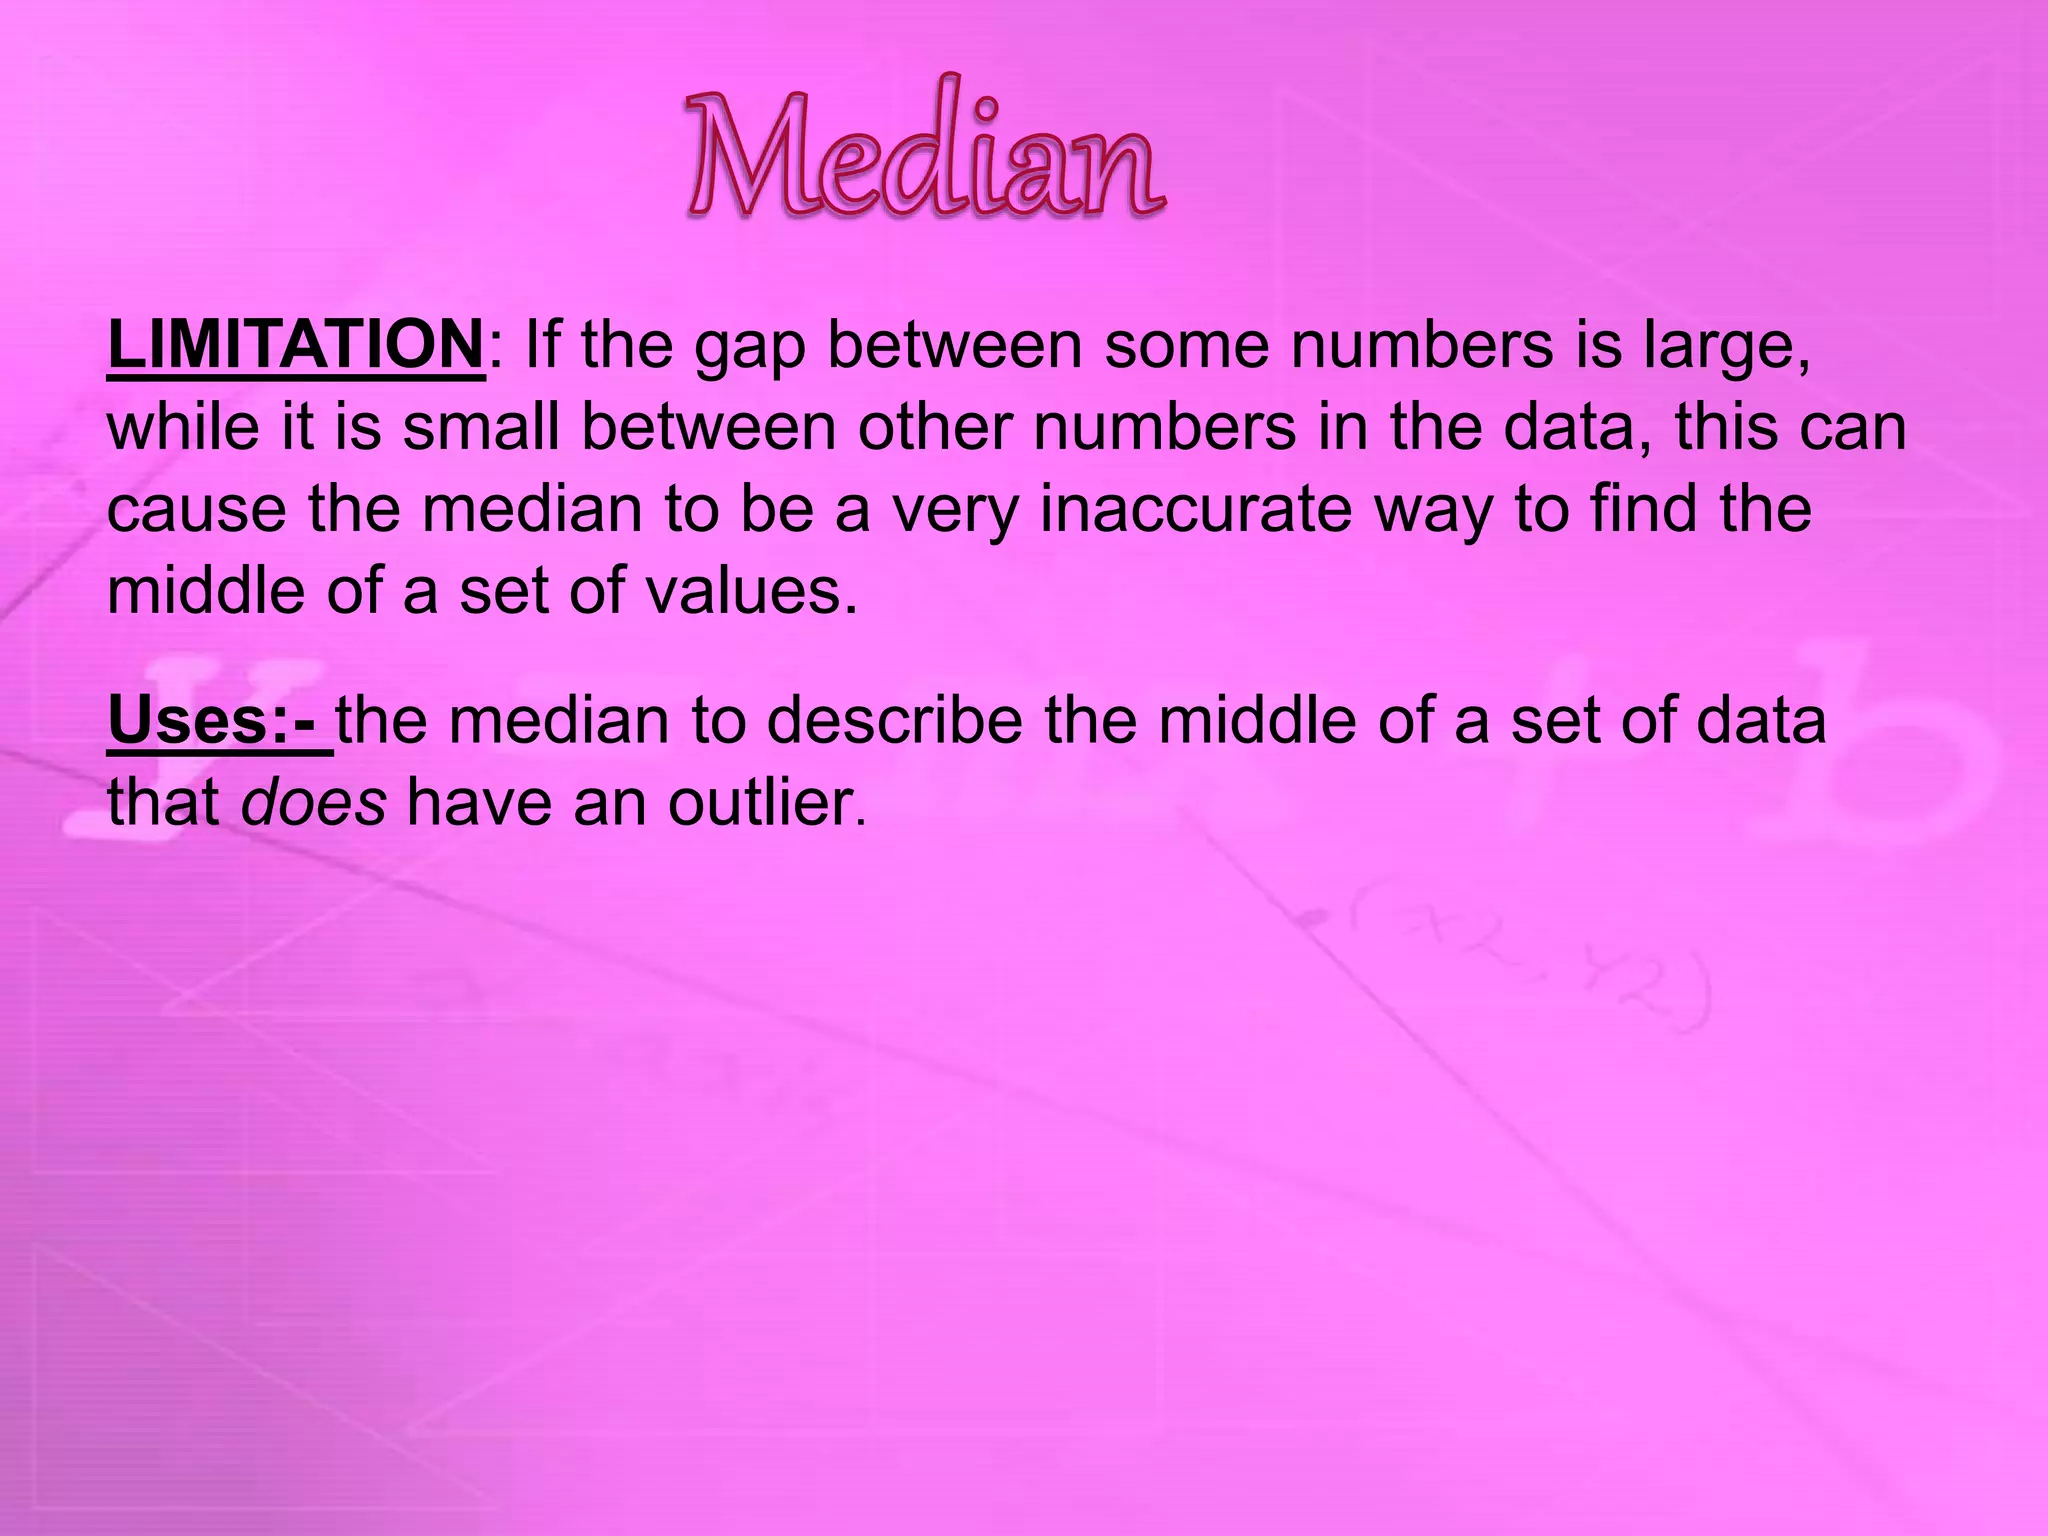
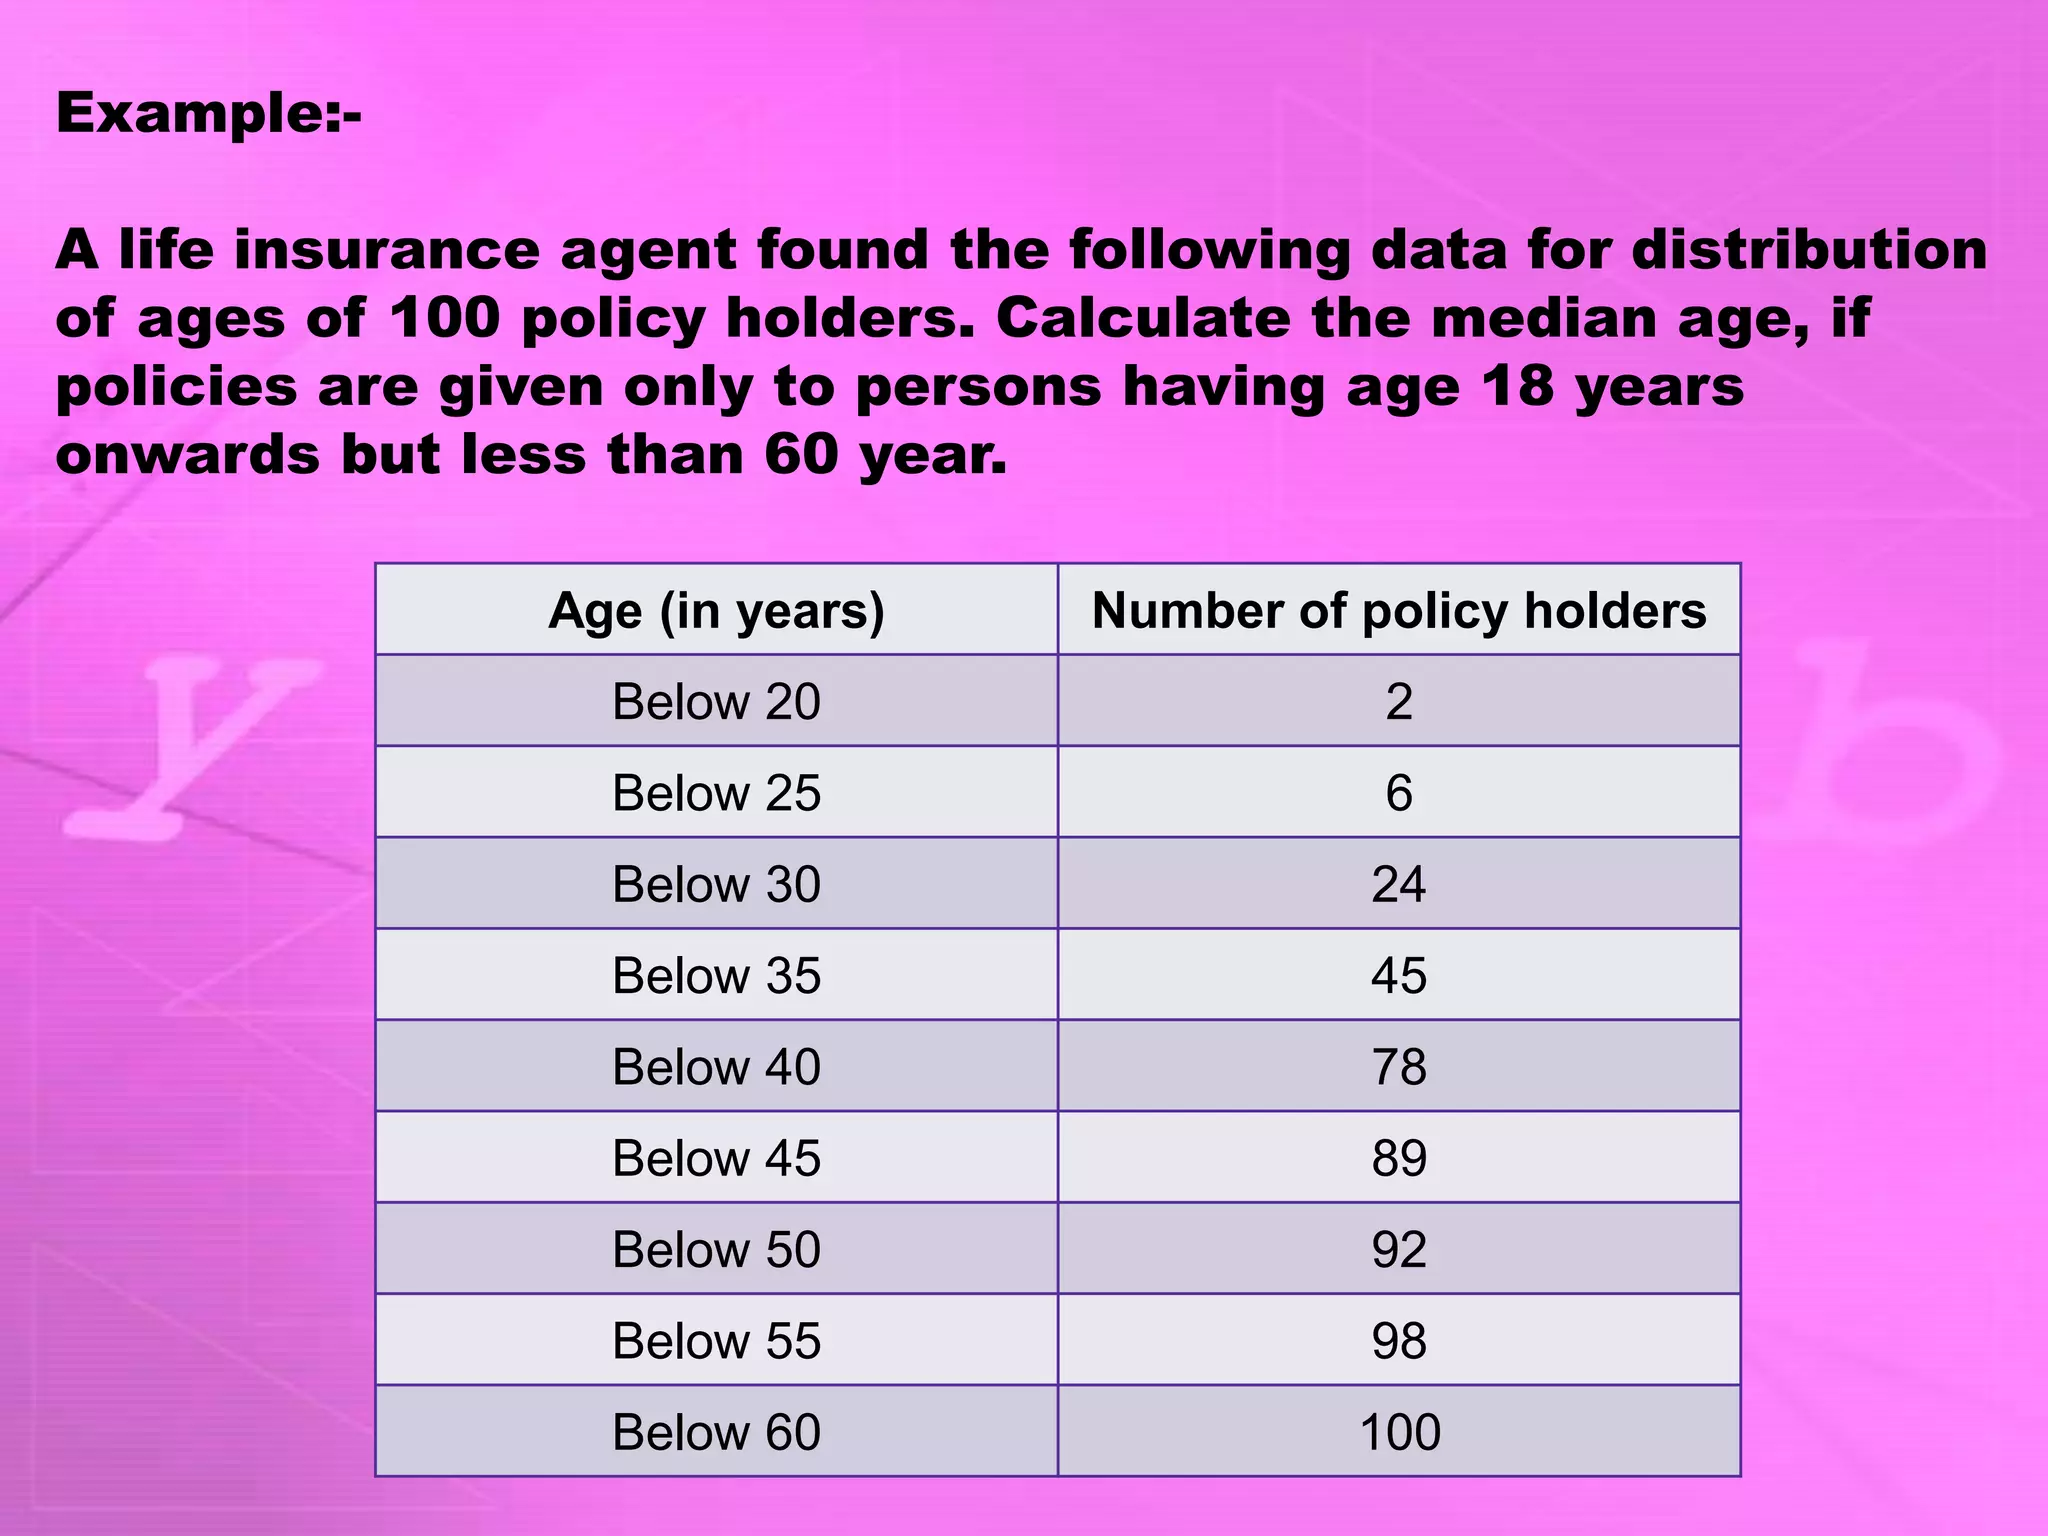
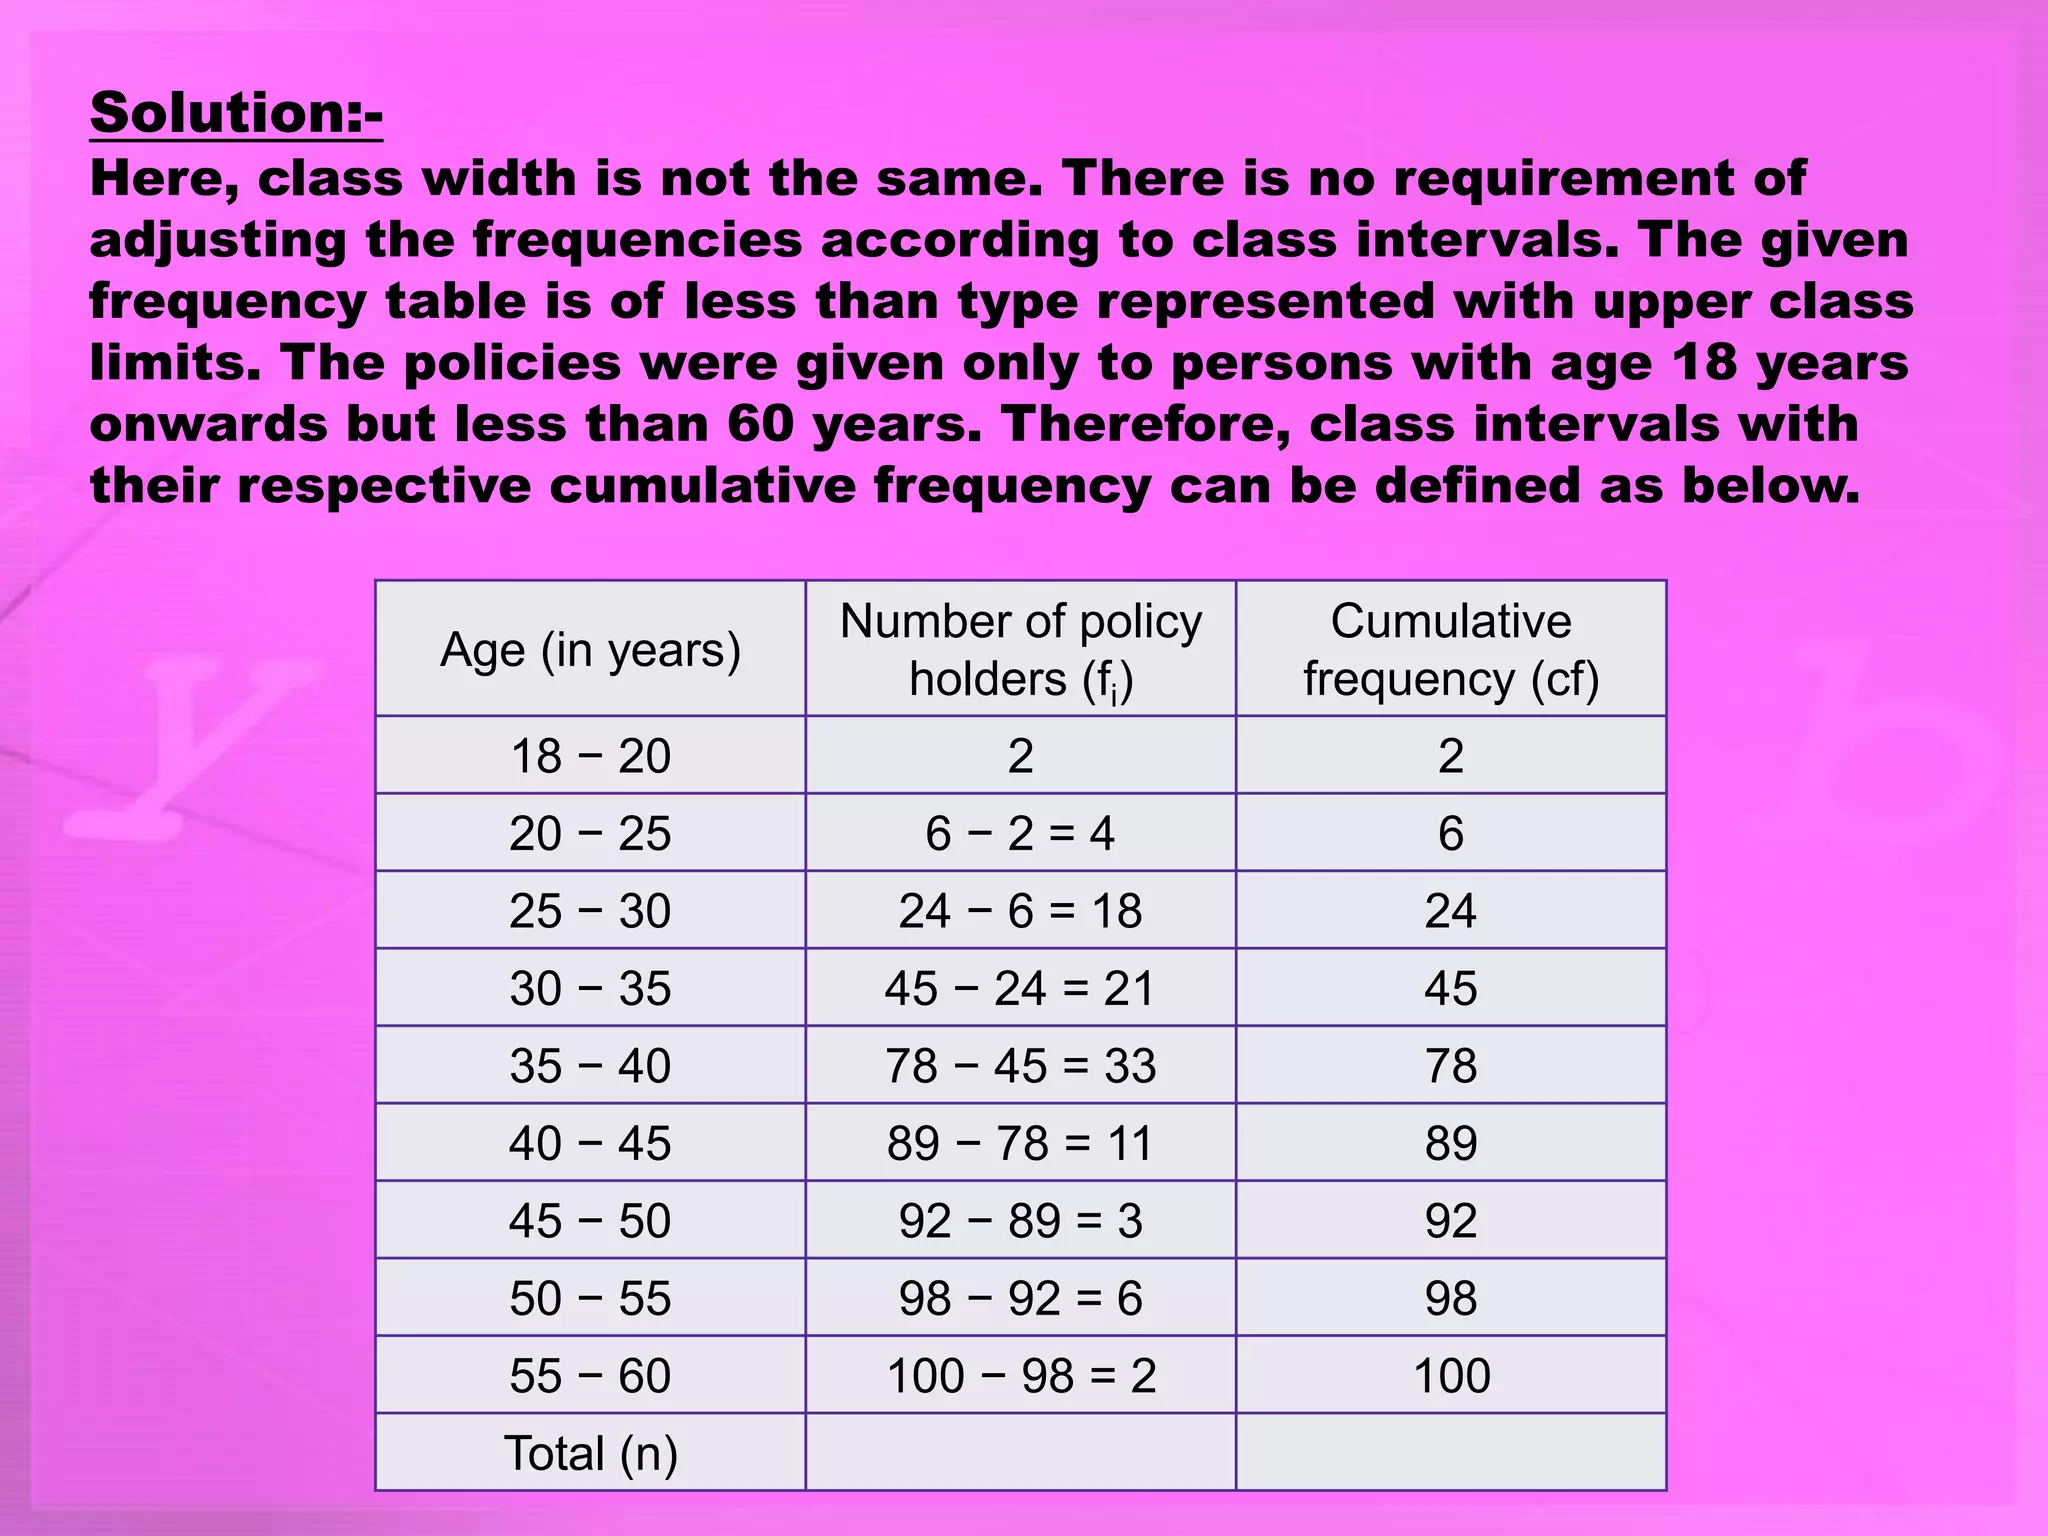
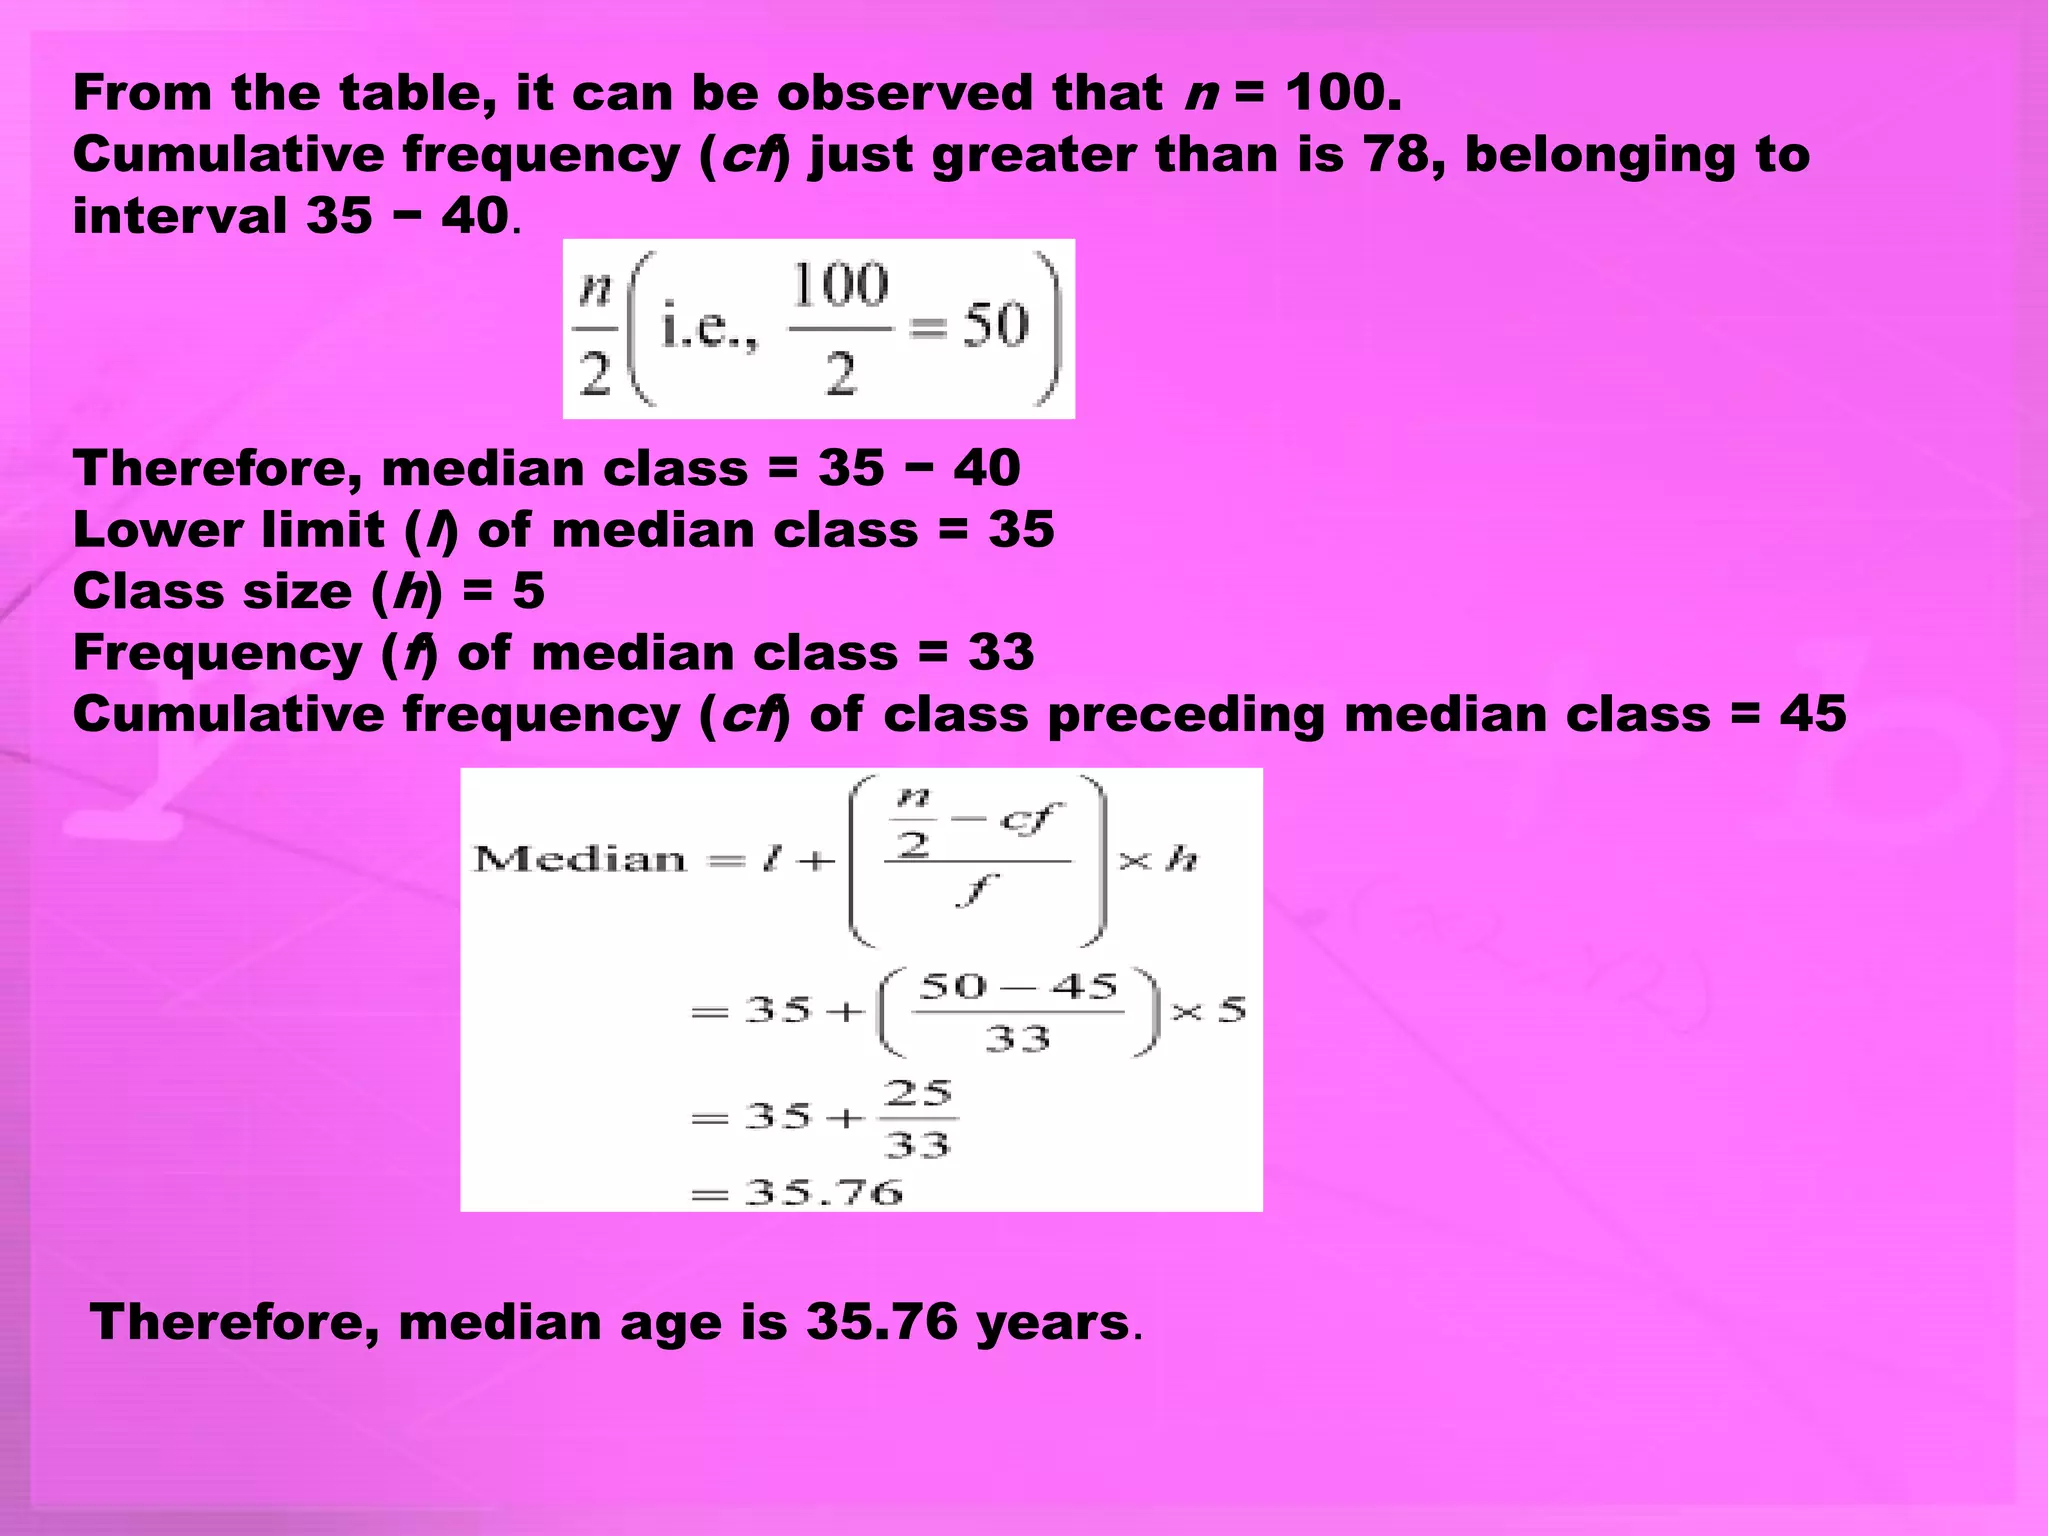
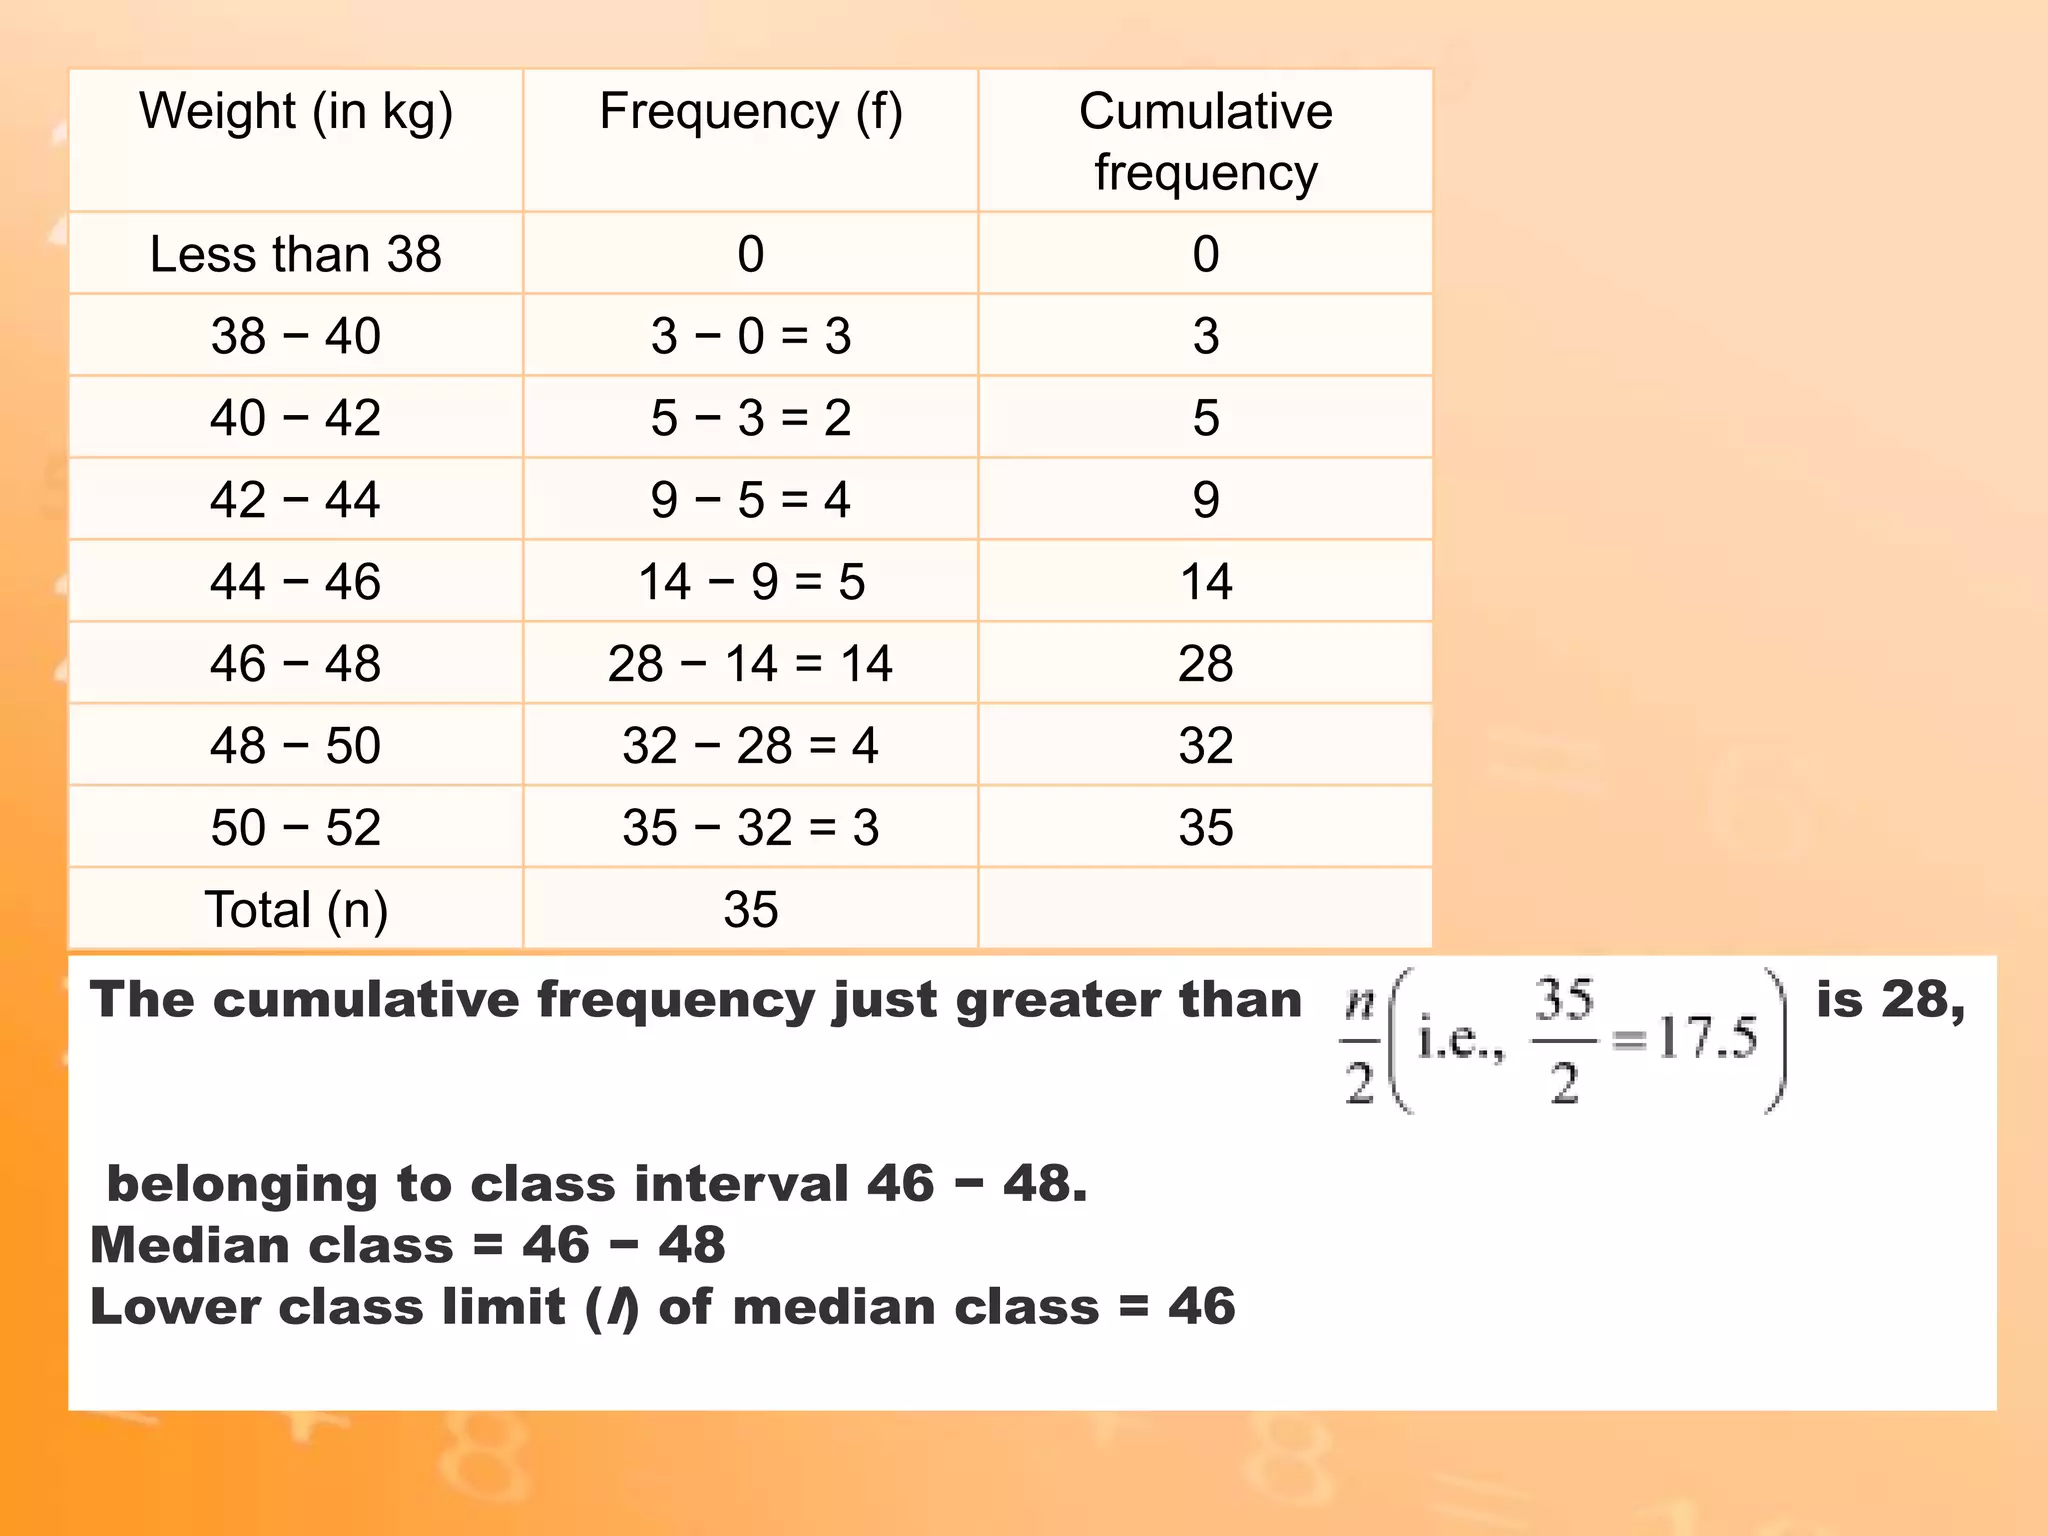
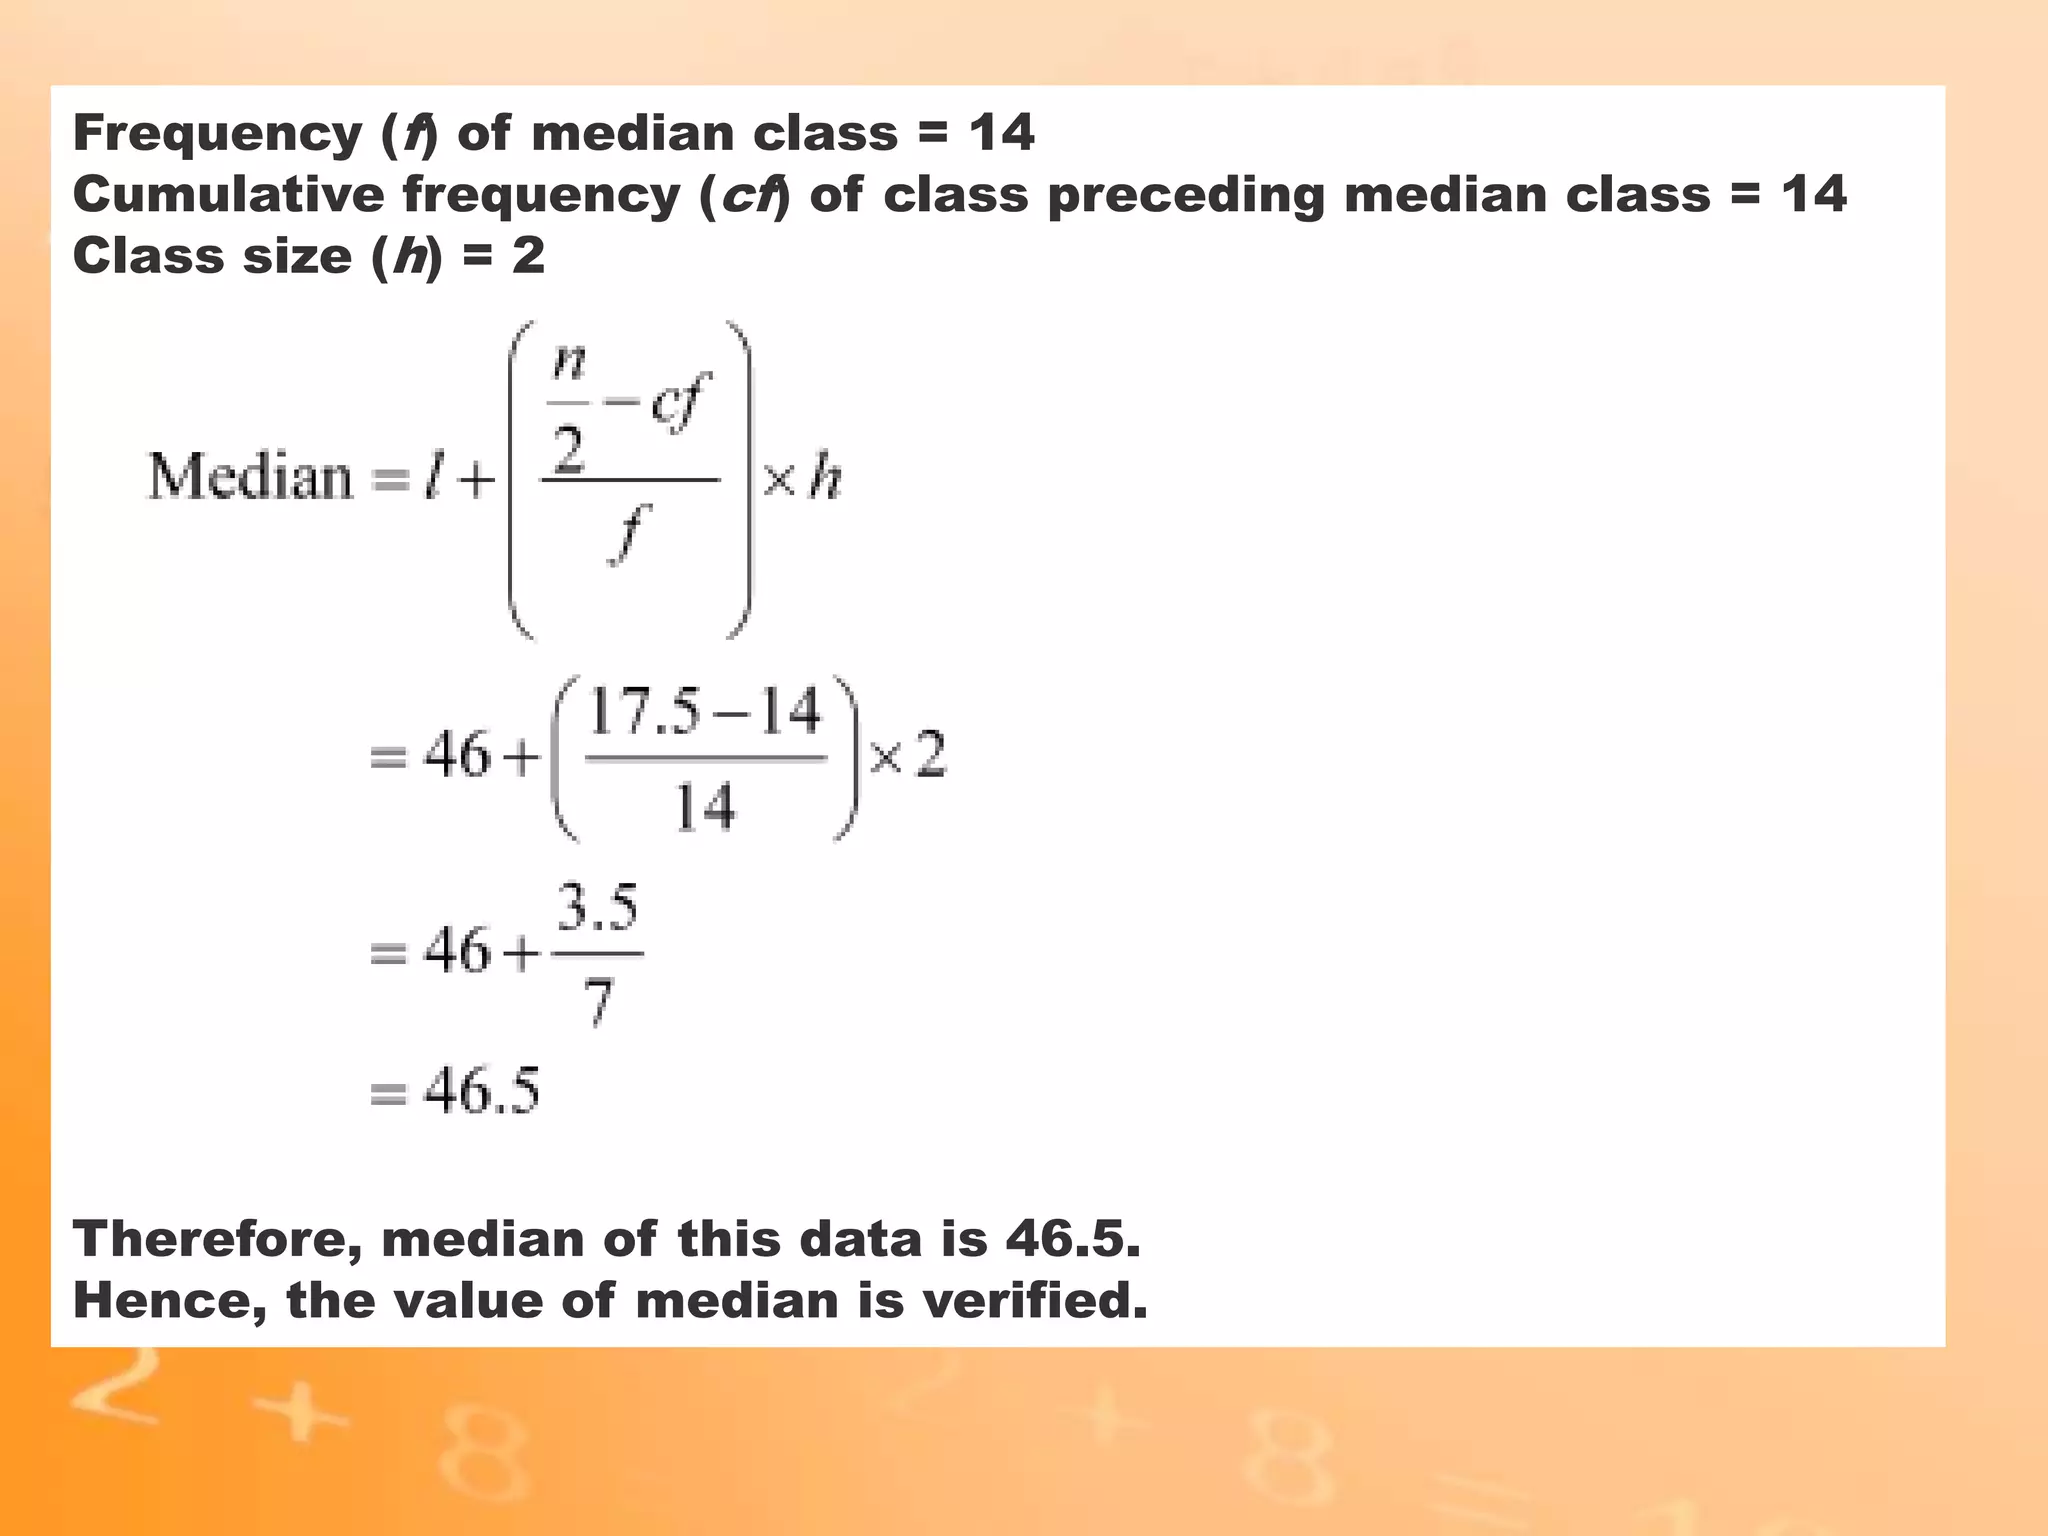
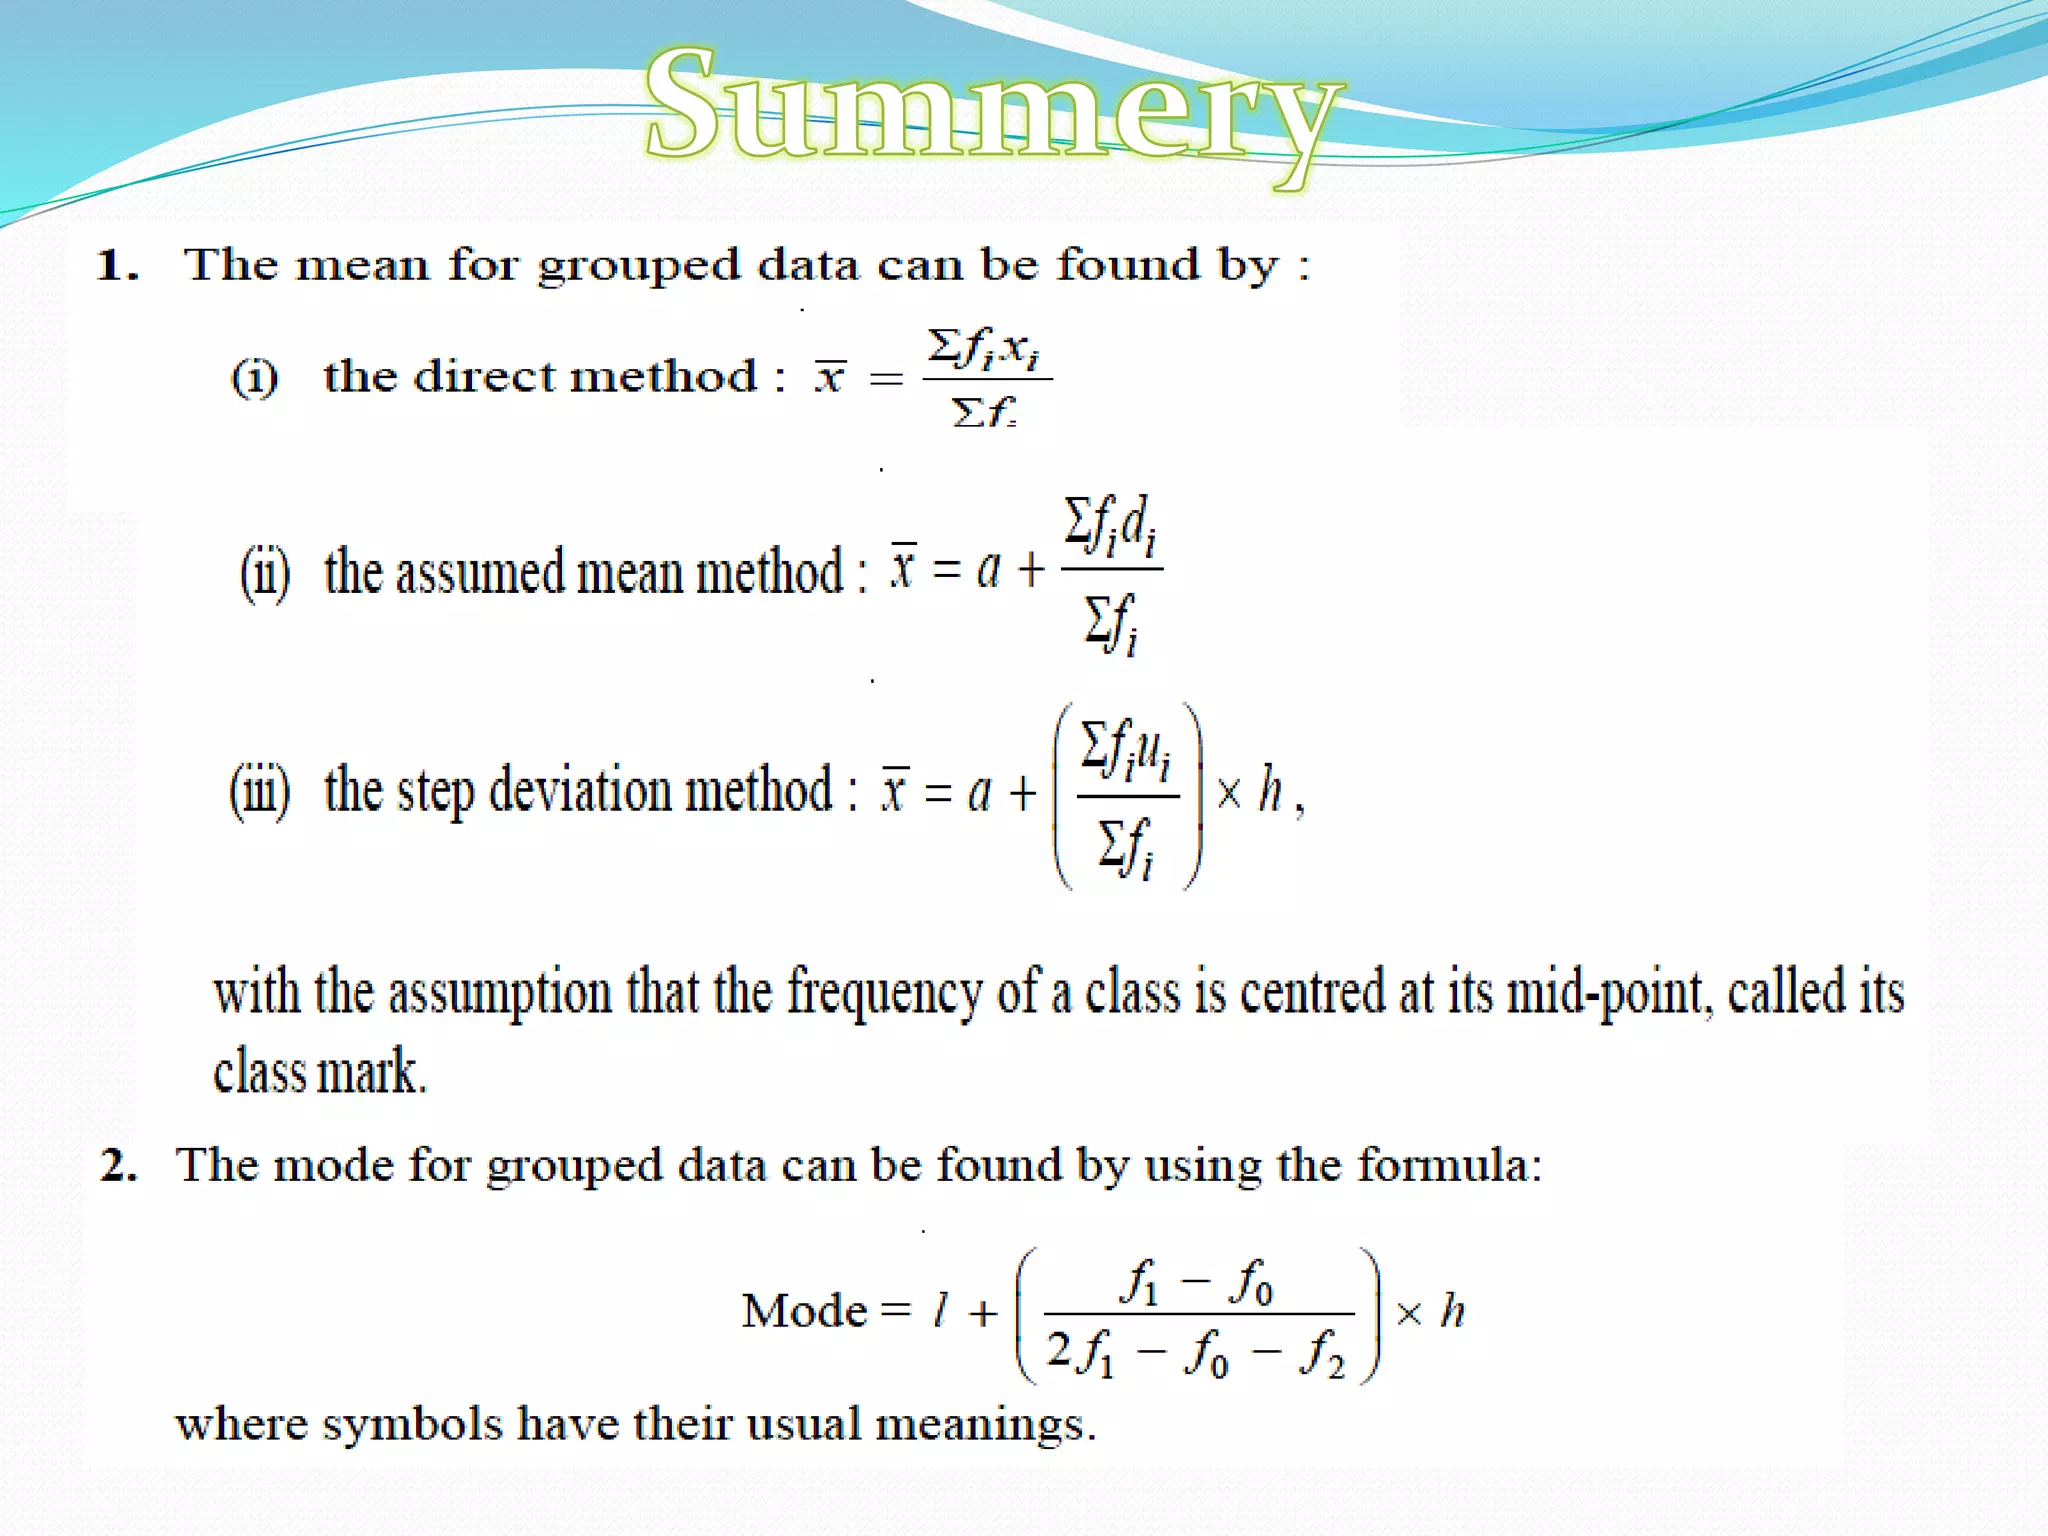
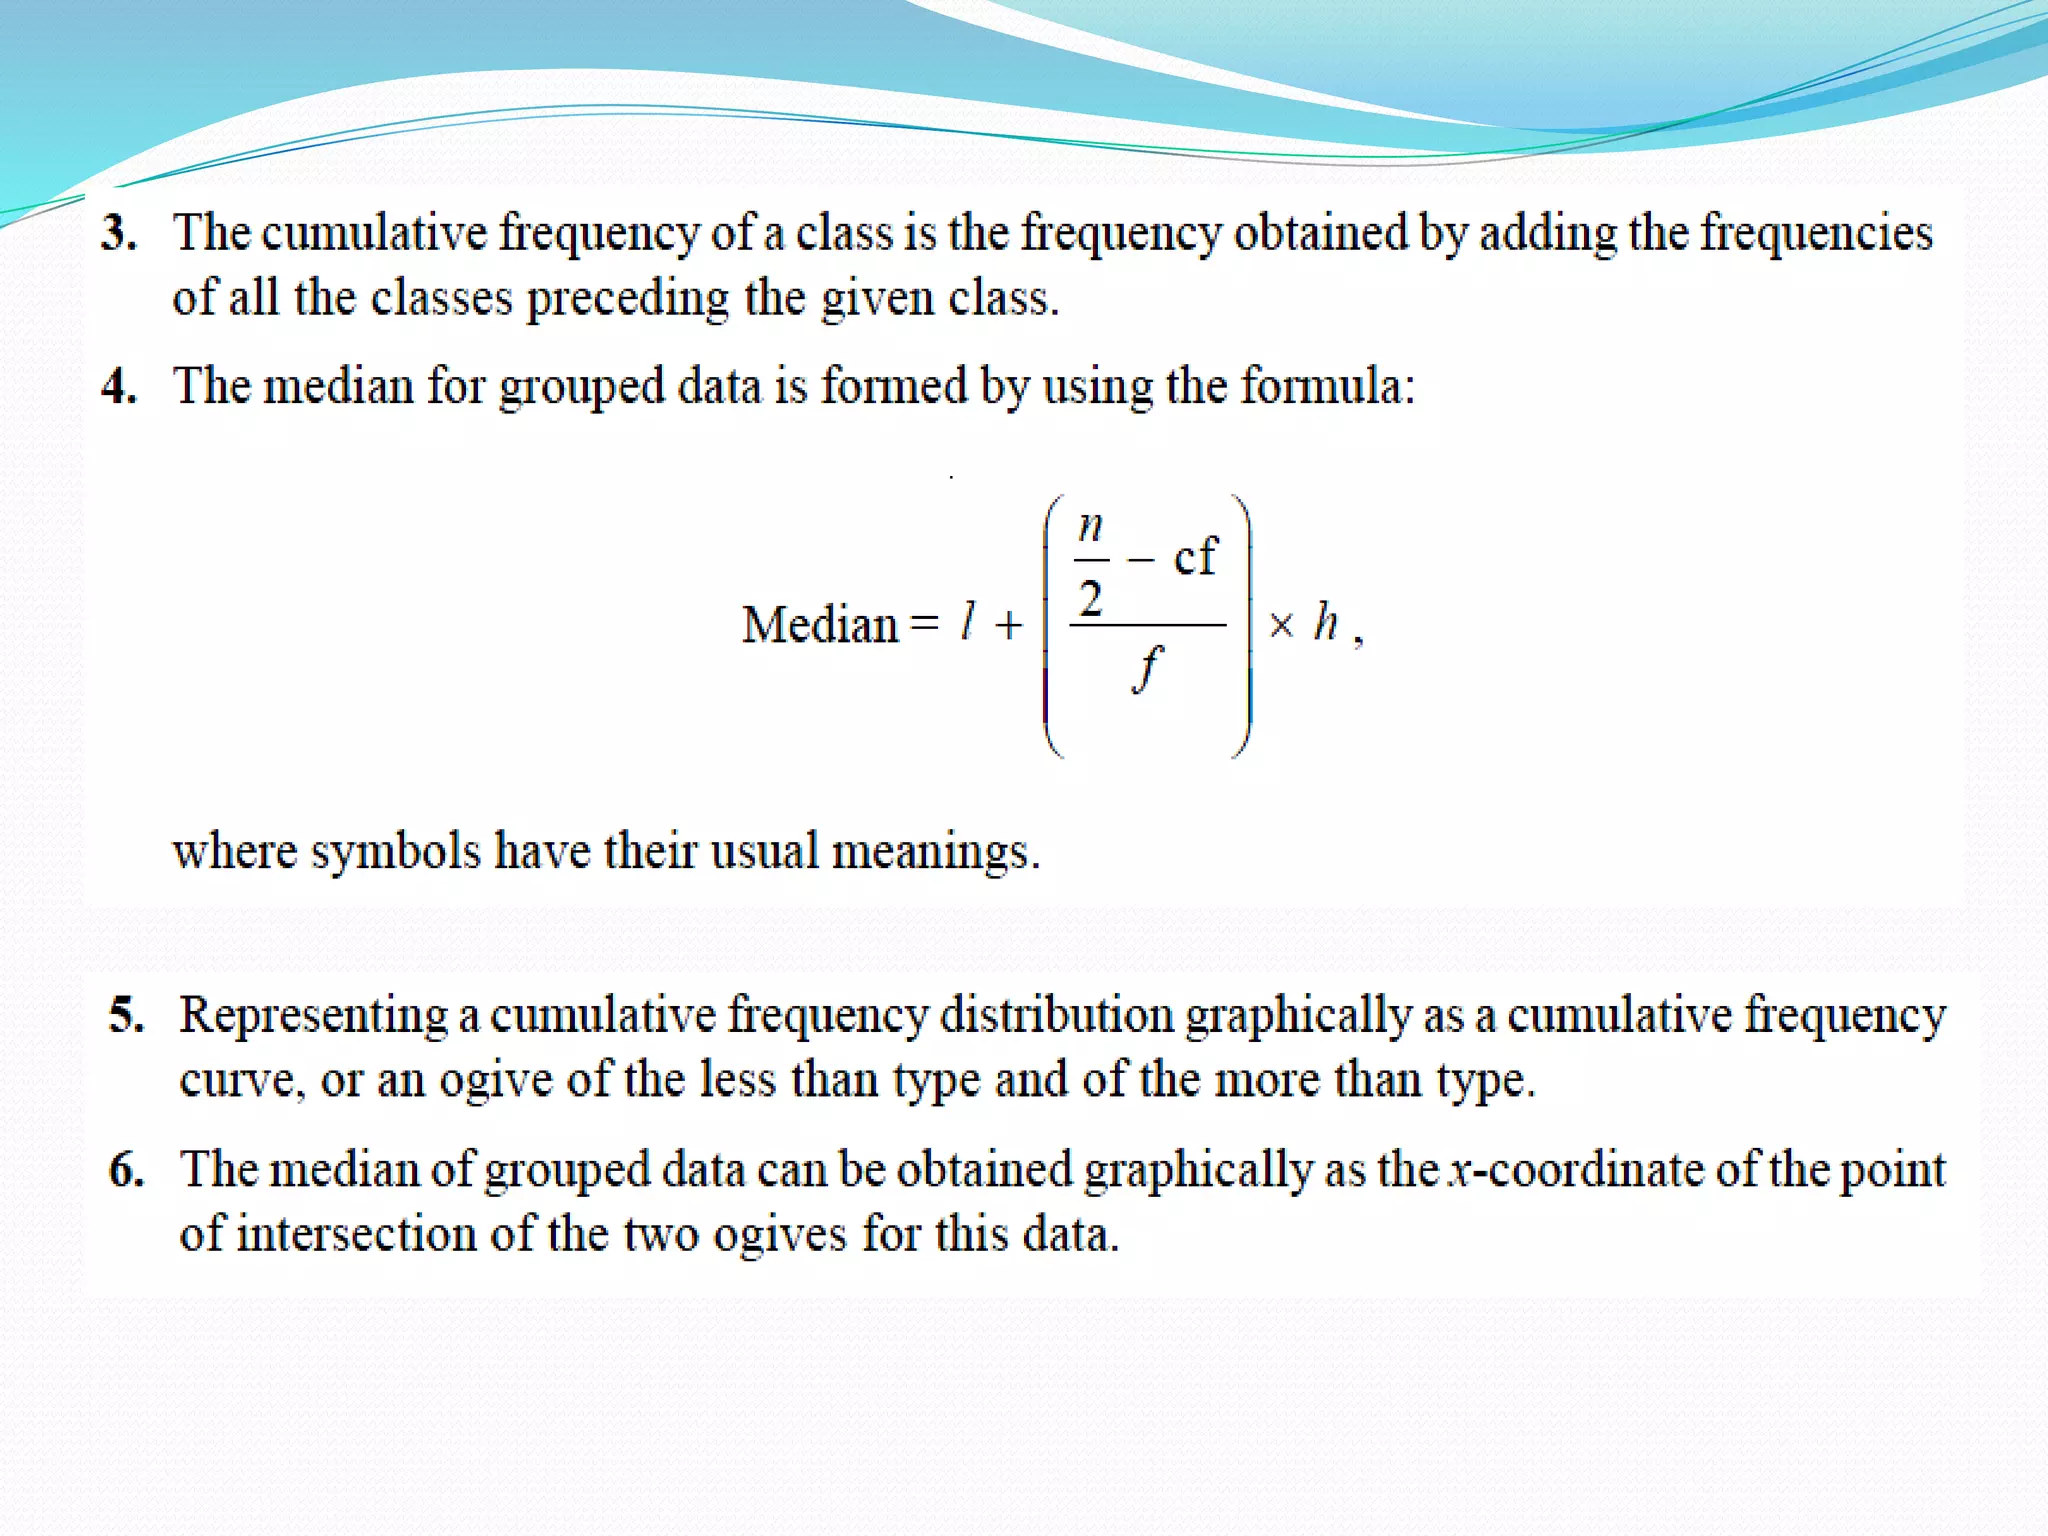


- The document discusses different statistical measures including the mean, median, and mode. - It provides examples of calculating the mean, median, and mode from sets of data. For example, it calculates the mean number of days students were absent from school based on attendance records. - The examples demonstrate how to determine the measure, possible limitations, and common uses of each statistical measure.


